. 2021 May 11;12(1):2624.
doi: 10.1038/s41467-021-22928-0.

Critical role of interferons in gastrointestinal injury repair

Affiliations

Critical role of interferons in gastrointestinal injury repair

Constance McElrath et al. Nat Commun. .

Abstract

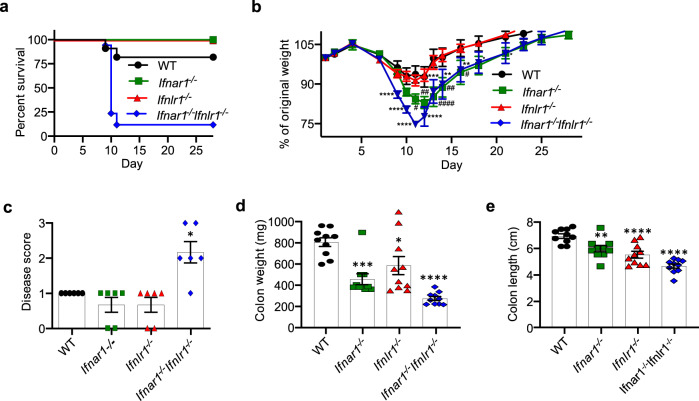
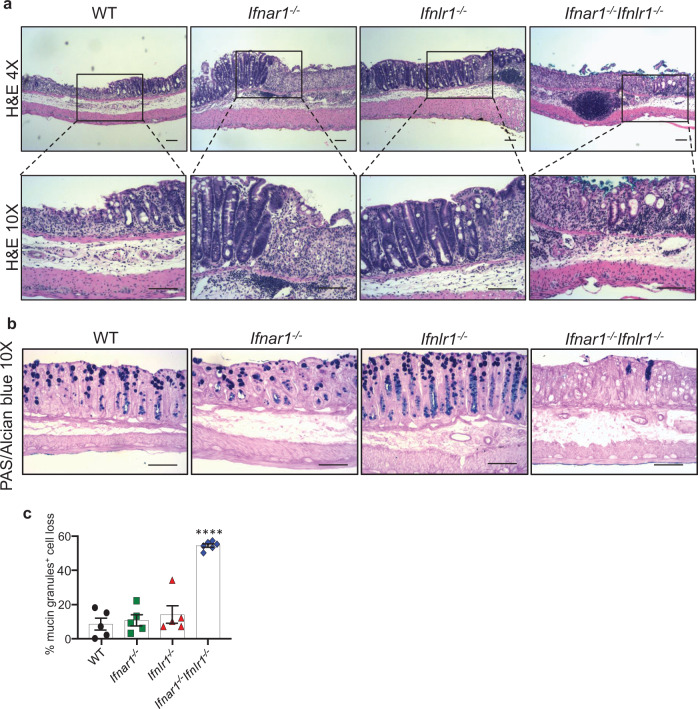
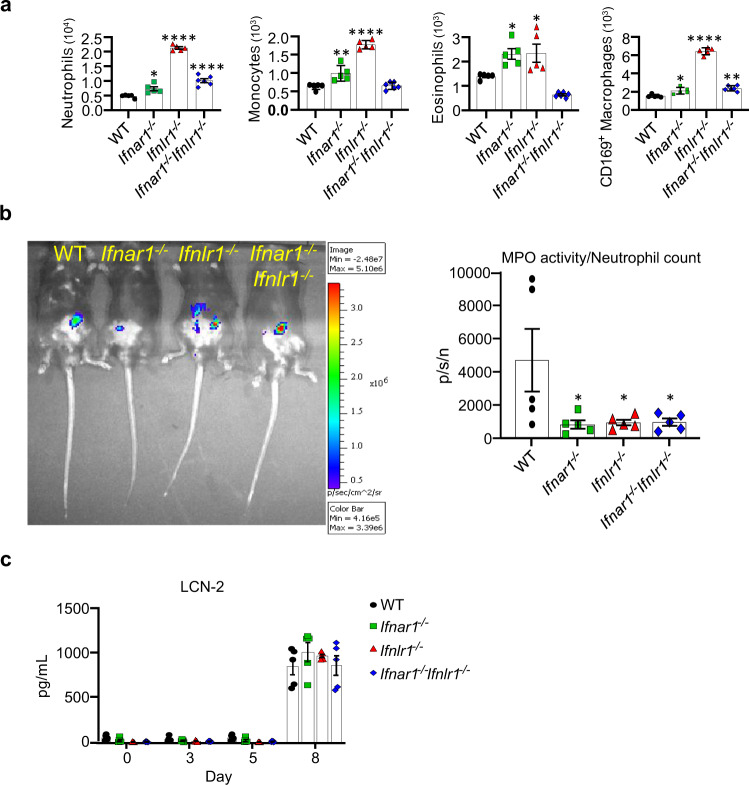
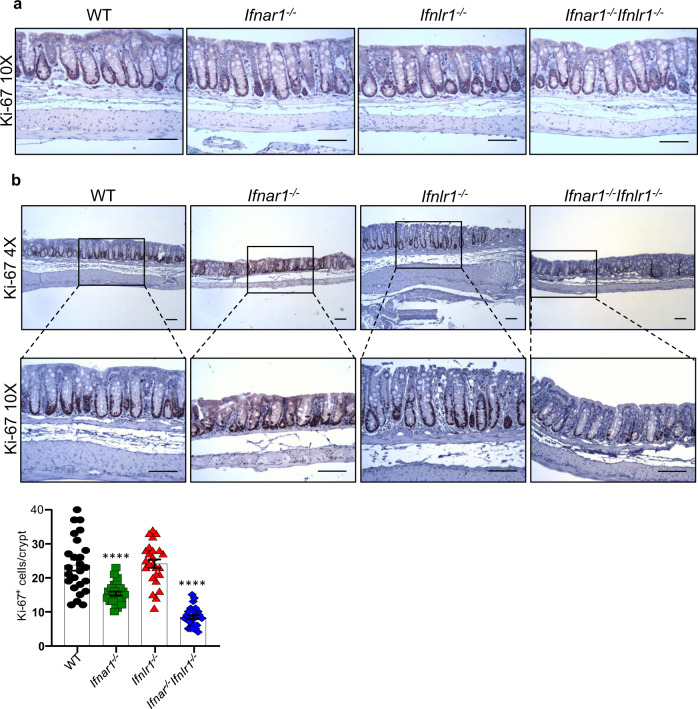
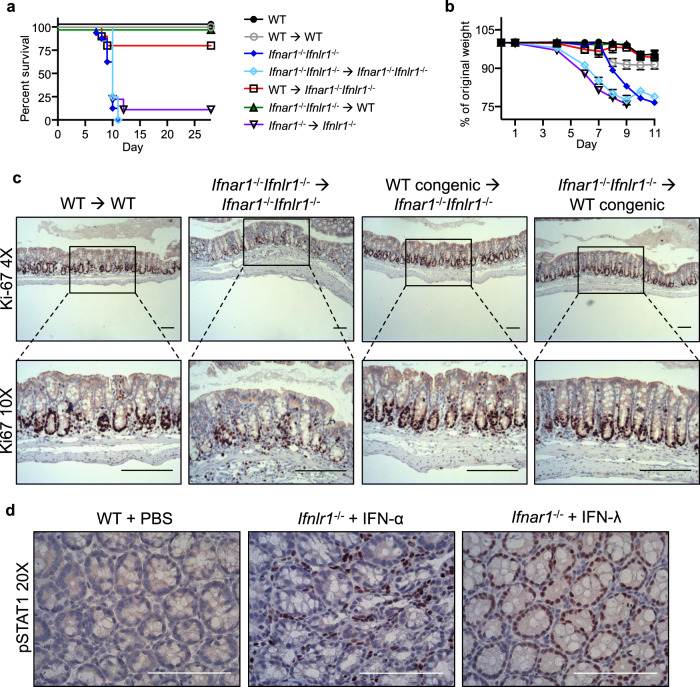
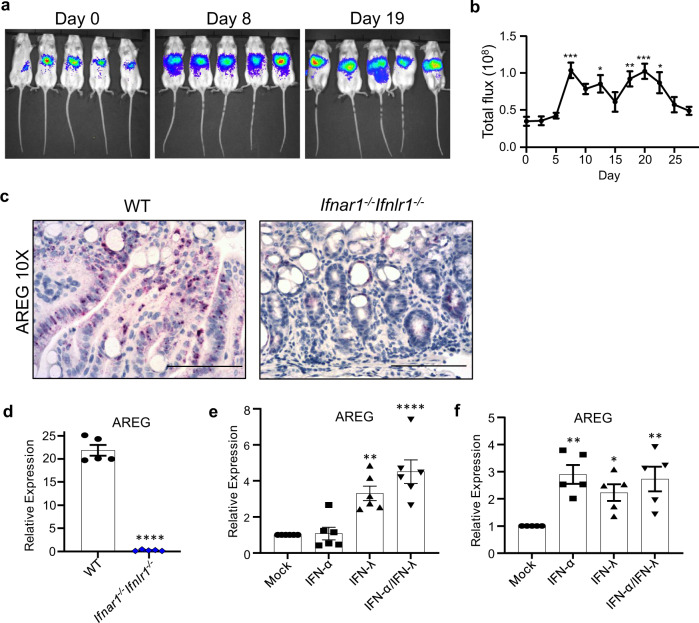
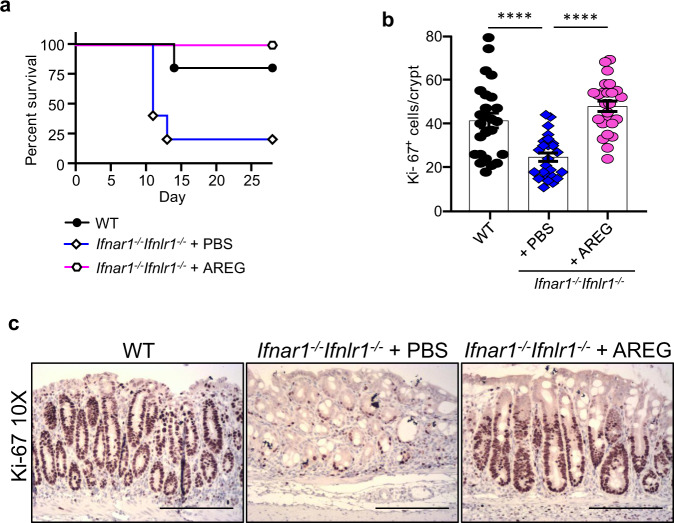
The etiology of ulcerative colitis is poorly understood and is likely to involve perturbation of the complex interactions between the mucosal immune system and the commensal bacteria of the gut, with cytokines acting as important cross-regulators. Here we use IFN receptor-deficient mice in a dextran sulfate sodium (DSS) model of acute intestinal injury to study the contributions of type I and III interferons (IFN) to the initiation, progression and resolution of acute colitis. We find that mice lacking both types of IFN receptors exhibit enhanced barrier destruction, extensive loss of goblet cells and diminished proliferation of epithelial cells in the colon following DSS-induced damage. Impaired mucosal healing in double IFN receptor-deficient mice is driven by decreased amphiregulin expression, which IFN signaling can up-regulate in either the epithelial or hematopoietic compartment. Together, these data underscore the pleiotropic functions of IFNs and demonstrate that these critical antiviral cytokines also support epithelial regeneration following acute colonic injury.


Conflict of interest statement

S.V.K. is an inventor on patents and patent applications related to IFN-λs, which have been licensed for commercial development. Other authors declare no competing interests.

Figures

Fig. 1
Fig. 1. Enhanced susceptibility of Ifnar1−/−Ifnlr1−/− mice to DSS treatment.
a–e 6–8-week-old mice were exposed to 1.5% DSS in drinking water for 7 days, followed by regular drinking water for recovery. Mice were monitored daily for a survival and b weight loss WT, n = 11; Ifnar1−/−, n = 6; Ifnlr1−/−, n = 9; Ifnar1−/−Ifnlr1−/−, n = 17. In additional sets of experiments, mice were euthanized on day 11 and c disease score (WT, n = 7; Ifnar1−/−, n = 6; Ifnlr1−/−, n = 6; Ifnar1−/−Ifnlr1−/−, n = 6), d colon weight (n = 10), and e colon length (n = 10) were evaluated. Data are representative of two independent experiments (a, b) or pooled from two independent experiments (c–e). Symbols represent values of individual mice (c–e). Quantitative data were analyzed using b mixed model or d, e one-way analysis of variance (ANOVA) or c nonparametric Kruskal–Wallis test followed by Bonferroni’s (b, d, e) or Dunn’s multiple comparisons test (c) and represent mean values with SEM. b *P = 0.0217 (day 18), *P = 0.0478 (day 21), **P = 0.0014 (day 14), **P = 0.0096 (day 16), ***P = 0.0001 (day 13), ****P ≤ 0.0001 (days 9, 10, 11, 12), an asterisk (*) denotes Ifnar1−/−Ifnlr1−/−; #P = 0.0131 (day 11), #P = 0.0445 (day 16), ##P = 0.0087 (day 12), ##P = 0.0043 (day 14), ####P ≤ 0.0001 (day 13), has symbol (#) denotes Ifnar1−/−. c *P = 0.0376. d *P = 0.0211, ***P = 0.0002, ****P ≤ 0.0001. e **P = 0.0082, ****P ≤ 0.0001. P values are for the indicated animal group compared with control group of WT mice (b–e).
Fig. 2
Fig. 2. Reduced number of goblet cells with mucin granules in the colon of Ifnar1−/−Ifnlr1−/− mice following DSS treatment.
a–c 6–8-week-old WT, single or double IFNR-deficient mice were exposed to 1.5% DSS in drinking water for 7 days, followed by regular drinking water for recovery, and euthanized on day 11. Representative a H&E and b PAS/Alcian blue staining for mucin granules-containing goblet cells with c quantitated loss of goblet cells stained positive for mucin granules (WT, n = 5; Ifnar1−/−, n = 5; Ifnlr1−/−, n = 5; Ifnar1−/−Ifnlr1−/−, n = 6) are shown. Scale bars are 100 μM. Data are representative of three independent experiments. Symbols represent values of individual mice (c). Quantitative data were analyzed using one-way ANOVA followed by Bonferroni’s multiple comparisons test and represent mean values with SEM. ****P ≤ 0.0001 and is for the indicated animal group compared with control group of WT mice.
Fig. 3
Fig. 3. Aberrant inflammatory response in the colon of IFNR-deficient mice following DSS treatment.
a–c 6–8-week-old WT, single or double IFNR-deficient mice were exposed to 1.5% DSS in drinking water for 7 days, followed by regular drinking water for recovery. a Mice were euthanized on day 8 and immune cell infiltrates in the colon were enumerated by flow cytometry (WT, n = 5; Ifnar1−/−, n = 5; Ifnlr1−/−, n = 5; Ifnar1−/−Ifnlr1−/−, n = 6). b Neutrophil function was analyzed by evaluating myeloperoxidase (MPO) activity by measuring in vivo luminescence in mice injected with luminescent MPO substrate. Representative images display MPO activity (photon radiance (photons s−1 cm−2 steradian−1; p/s/cm2/sr) presented as pseudo-color images ranging from red (most intense) to blue (least intense) superimposed over gray photographs. Relative MPO activity measured as photon flux (p/s) normalized to the number (p/s/n) of colon-infiltrating neutrophils (live, CD45+CD11b+Ly6G+) is shown (n = 5). c Fecal lipocalin 2 (LCN-2) levels were measures by ELISA on selected days of experimental DSS-induced colitis (n = 5). Data are representative of two independent experiments (a, c). Symbols represent values of individual mice (a–c). Quantitative data were analyzed using a, b one-way ANOVA or c two-way ANOVA followed by Bonferroni’s multiple comparisons test (a–c) and represent mean values with SEM. a *P = 0.0207 (neutrophils, Ifnar1−/−); **P = 0.0016 (monocytes, Ifnar1−/−); *P = 0.0216 (eosinophils, Ifnar1−/−), *P = 0.0172 (eosinophils, Ifnlr1−/−); *P = 0.0296 (CD169+ macrophages, Ifnar1−/−), **P = 0.0011 (CD169+ macrophages, Ifnar1−/−Ifnlr1−/−). b *P = 0.0346 (Ifnar1−/−), *P = 0.0417 (Ifnlr1−/−), *P = 0.043 (Ifnar1−/−Ifnlr1−/−). ****P ≤ 0.0001. P values are for the indicated animal group compared with control group of WT mice (a, b).
Fig. 4
Fig. 4. Impaired proliferation of colon epithelium in Ifnar1−/−Ifnlr1−/− mice following DSS treatment.
a 6–8-week-old naive WT, single or double IFNR-deficient mice receiving regular water were euthanized and proliferation of colon epithelial cells were evaluated by immunohistochemistry (IHC) staining for Ki-67 (n = 5). b 6–8-week-old WT, single or double IFNR-deficient mice were exposed to 1.5% DSS in drinking water for 7 days, followed by regular drinking water for recovery. Mice were euthanized on day 8 and proliferation of colon epithelial cells was evaluated by IHC staining for Ki-67 (n = 5). Representative colon images and quantified data are shown. Scale bars are 100 μM. Data are representative of two independent experiments. Symbols represent the number of Ki-67+ cells per crypt (five crypt/slide/animal; n = 5). Quantitative data were analyzed using one-way ANOVA followed by Bonferroni’s multiple comparisons test and represent mean values with SEM. ****P ≤ 0.0001 and are for the indicated animal group compared with control group of WT mice.
Fig. 5
Fig. 5. Compartmentalized IFN signaling supports epithelial proliferation in experimental DSS-induced colitis.
a–c Indicated bone marrow chimera mice and age-matched WT and Ifnar1−/−Ifnlr1−/− mice were exposed to 1.5 % DSS in drinking water for 7 days, followed by regular water for recovery. Mice were monitored daily for a survival and b weight loss (WT, n = 8; WT→WT, n = 5; Ifnar1−/−Ifnlr1−/−, n = 14; Ifnar1−/−Ifnlr1−/−Ifnar1−/−Ifnlr1−/−, n = 4, Ifnar1−/−Ifnlr1−/−→WT, n = 10; WT→Ifnar1−/−Ifnlr1−/−, n = 10; Ifnar1−/−Ifnlr1−/−, n = 9). Data are presented as mean values with SEM. c Mice were euthanized on day 8 and colon epithelial cell proliferation was evaluated by IHC staining for Ki-67 (n = 5). d 6–8-week-old WT mice were treated with IFN (1.0 μg) or PBS as a control by subcutaneous injection, and euthanized 30 min later. IFN-induced activation of STAT1 was evaluated by IHC staining with antibodies against phosphorylated STAT1 (n = 5). Scale bars are 100 μM. Data are representative of two independent experiments (a–d).
Fig. 6
Fig. 6. Ifnar1−/−Ifnlr1−/− mice have diminished AREG expression following DSS treatment and IFNs regulate AREG expression.
a, b Mx2-Luciferase reporter mice (n = 5) were exposed to 1.5% DSS in drinking water for 7 days, followed by regular water. Mice were injected with luciferin and levels of IFN-controlled Mx2 promoter-driven luciferase expression were measured by IVIS on selected days. c, d 6–8-week-old WT and Ifnar1−/−Ifnlr1−/− mice were administered 1.5% DSS in drinking water for 7 days, followed by regular water. Levels of colonic AREG transcripts were analyzed on day 11 by c in situ hybridization (n = 5) and d qPCR from total colon homogenates (n = 5). e Murine intestinal epithelial cells (mIECs) or f fluorescent-activated cell (FAC)-sorted bone marrow-derived CD45+ cells were treated with IFN for 30 min and upregulation of AREG transcripts were analyzed by qPCR (e, n = 6; f, n = 5). Scale bars are 100 μM. Data are representative of two (a, b) or three independent experiments (c) or pooled from two independent experiments (d–f). Symbols represent individual data points (d–f). Quantitative data were analyzed using b, e, f one-way ANOVA or d two-tailed unpaired t-test followed by Tukey’s (b) or Bonferroni’s multiple comparisons test (e, f) and represent mean values with SEM. b *P = 0.0231 (day 13), *P = 0.0168 (day 22), **P = 0.0055 (day 18), ***P = 0.0004 (day 8), ***P = 0.0005 (day 19); P values are for the indicated day compared with day 0. d ****P ≤ 0.0001 and is for the indicated animal group compared with control group of WT mice. e **P = 0.0027, ****P ≤ 0.0001. f *P = 0.0483 (IFN-λ), **P = 0.0023 (IFN-α), **P = 0.005 (IFN-α/IFN-λ). P values are for the indicated treatment compared with mock (e, f).
Fig. 7
Fig. 7. Administration of AREG rescues Ifnar1−/−Ifnlr1−/− mice from experimental DSS-induced colitis and restores colonic regeneration.
a–c 6–8-week-old WT and Ifnar1−/−Ifnlr1−/− were exposed to 1.5% DSS in drinking water for 7 days, followed by regular water. On days 5, 7, 9, and 11, Ifnar1−/−Ifnlr1−/− mice were administered AREG (5.0 μg) or PBS as a control by IP injection, and the animals were monitored daily for survival (a) (n = 5). b, c On day 11, mice were euthanized (n = 5) and proliferation of epithelial cells in the colon was evaluated by IHC staining for Ki-67. Symbols in b represent the number of Ki-67+ cells per crypt (five crypt/slide/animal; n = 5). c Representative images. Scale bars are 100 μM. Data are representative of two independent experiments. Quantitative data were analyzed using one-way ANOVA followed by Bonferroni’s multiple comparisons test and represent mean values with SEM. ****P ≤ 0.0001.

References

    1. de Souza HSP, Fiocchi C, Iliopoulos D. The IBD interactome: an integrated view of aetiology, pathogenesis and therapy. Nat. Rev. Gastroenterol. Hepatol. 2017;14:739–749. doi: 10.1038/nrgastro.2017.110. - DOI - PubMed
    1. Maloy KJ, Powrie F. Intestinal homeostasis and its breakdown in inflammatory bowel disease. Nature. 2011;474:298–306. doi: 10.1038/nature10208. - DOI - PubMed
    1. Cho JH. The genetics and immunopathogenesis of inflammatory bowel disease. Nat. Rev. Immunol. 2008;8:458–466. doi: 10.1038/nri2340. - DOI - PubMed
    1. Imhann F, et al. Interplay of host genetics and gut microbiota underlying the onset and clinical presentation of inflammatory bowel disease. Gut. 2018;67:108–119. doi: 10.1136/gutjnl-2016-312135. - DOI - PMC - PubMed
    1. Jostins L, et al. Host-microbe interactions have shaped the genetic architecture of inflammatory bowel disease. Nature. 2012;491:119–124. doi: 10.1038/nature11582. - DOI - PMC - PubMed

Publication types

MeSH terms