. 2021 May 11;12(1):2637.
doi: 10.1038/s41467-021-22898-3.

Engineered red blood cells as an off-the-shelf allogeneic anti-tumor therapeutic

Affiliations

Engineered red blood cells as an off-the-shelf allogeneic anti-tumor therapeutic

Xuqing Zhang et al. Nat Commun. .

Abstract

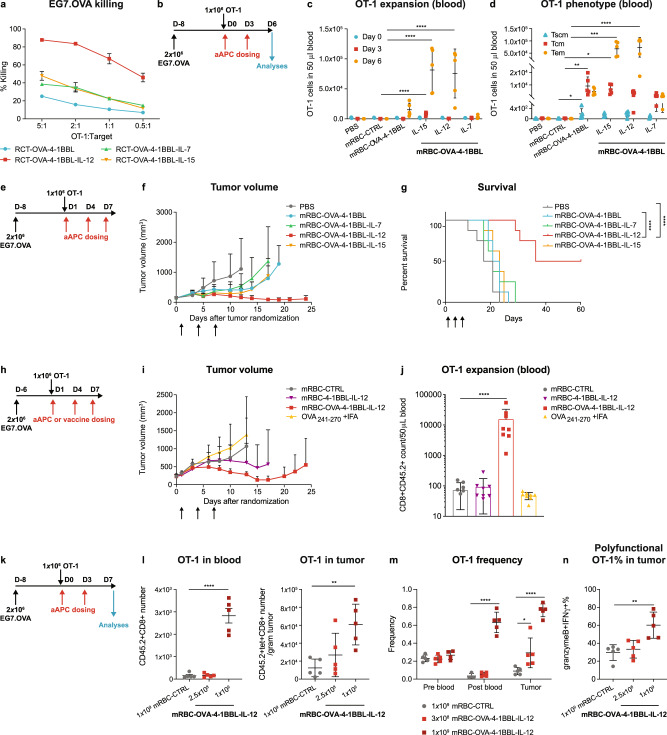
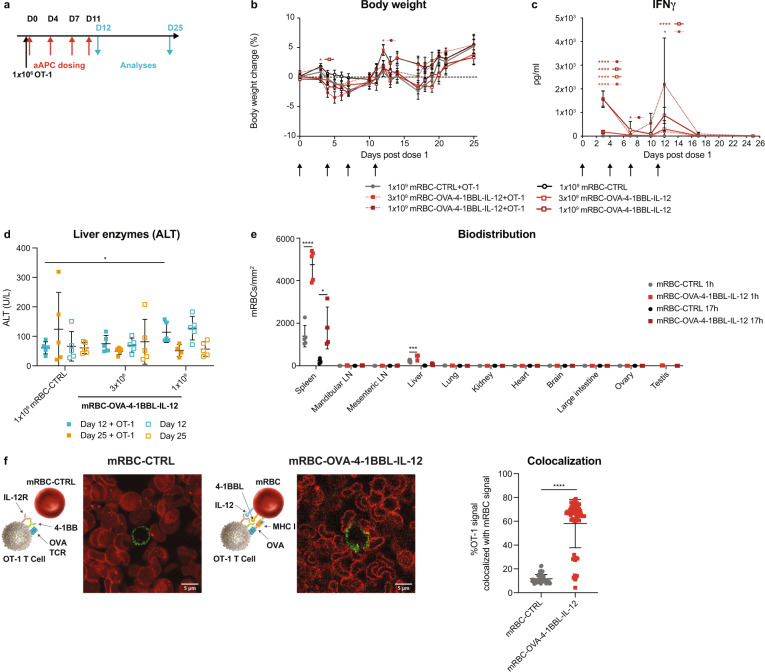
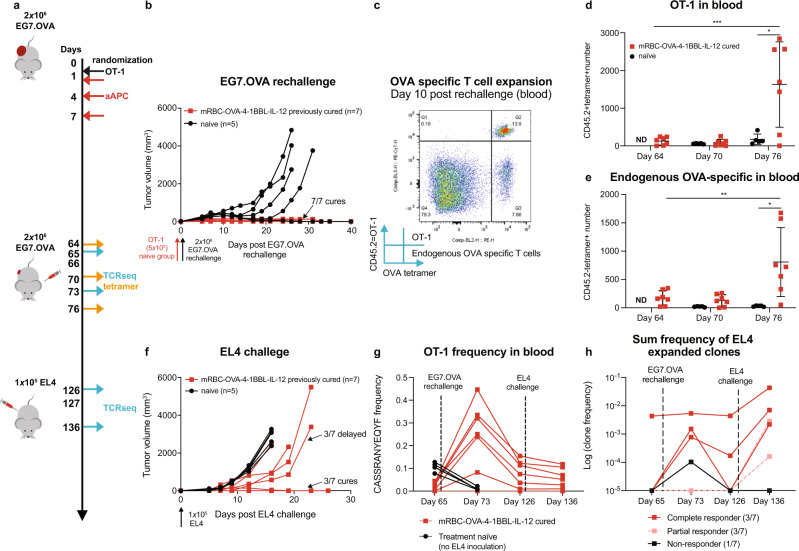
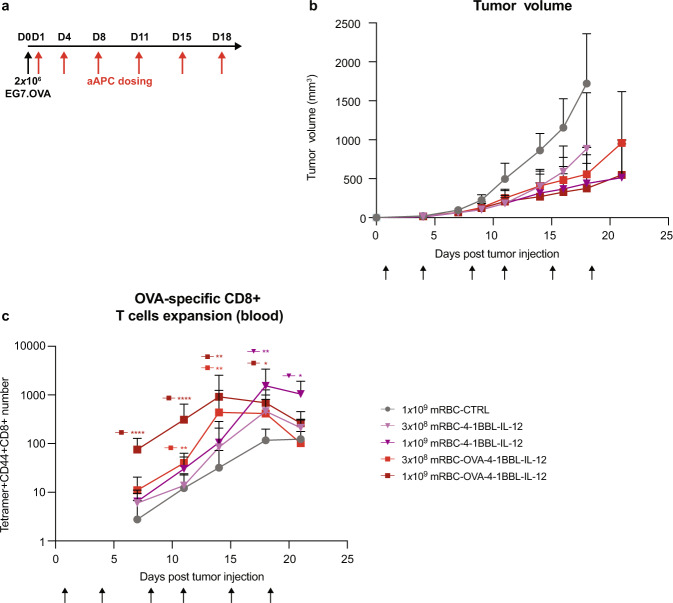
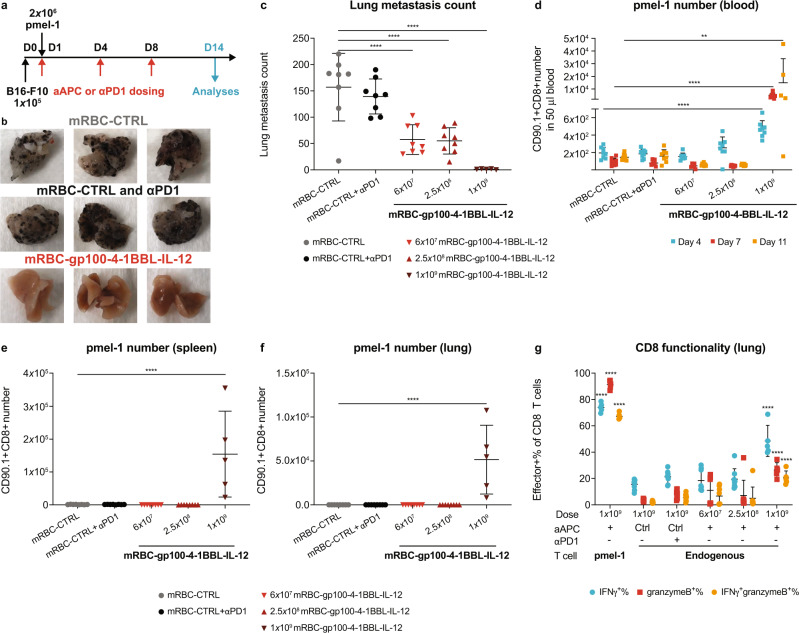
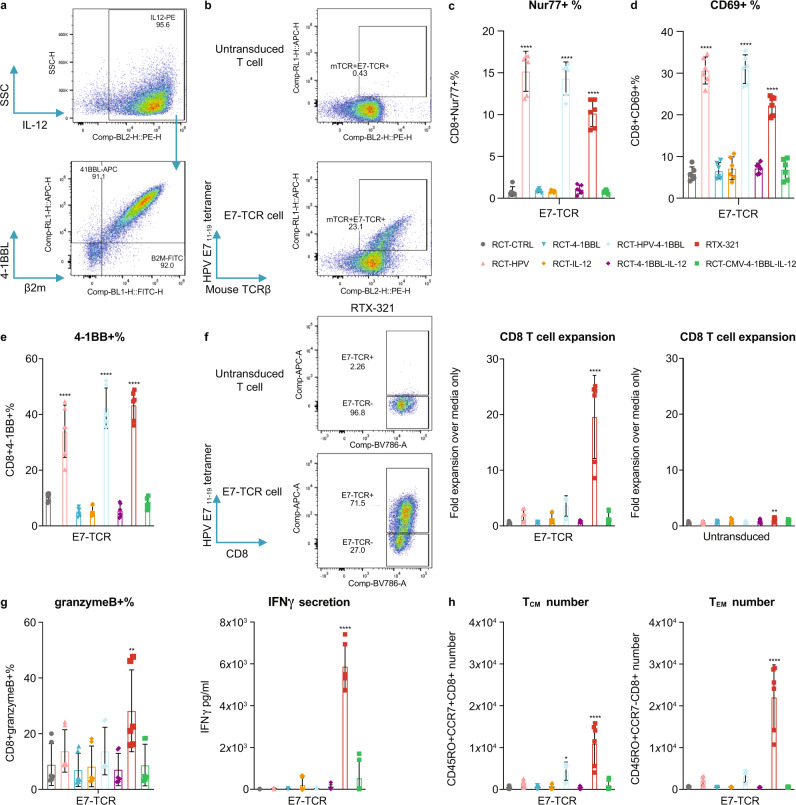
Checkpoint inhibitors and T-cell therapies have highlighted the critical role of T cells in anti-cancer immunity. However, limitations associated with these treatments drive the need for alternative approaches. Here, we engineer red blood cells into artificial antigen-presenting cells (aAPCs) presenting a peptide bound to the major histocompatibility complex I, the costimulatory ligand 4-1BBL, and interleukin (IL)-12. This leads to robust, antigen-specific T-cell expansion, memory formation, additional immune activation, tumor control, and antigen spreading in tumor models in vivo. The presence of 4-1BBL and IL-12 induces minimal toxicities due to restriction to the vasculature and spleen. The allogeneic aAPC, RTX-321, comprised of human leukocyte antigen-A*02:01 presenting the human papilloma virus (HPV) peptide HPV16 E711-19, 4-1BBL, and IL-12 on the surface, activates HPV-specific T cells and promotes effector function in vitro. Thus, RTX-321 is a potential 'off-the-shelf' in vivo cellular immunotherapy for treating HPV + cancers, including cervical and head/neck cancers.


Conflict of interest statement

All authors have or had employment and equity ownership in Rubius Therapeutics during conduct of research or currently. M.L. is currently an employee of Takeda Pharmaceutical Company Limited, Cambridge, Massachusetts, USA. M.N. is currently an employee of Merck & Co., Inc., Boston, Massachusetts, USA. A.K. and C.L.C. are currently employees of Catamaran Bio, Inc., Cambridge, Massachusetts, USA. A.L. is currently an employee of Kymera Therapeutics, Inc., Watertown, Massachusetts, USA. D.C.M. is currently an employee of MoMa Therapeutics, Inc., Cambridge, Massachusetts, USA. L.A.T is a scientific founder and holds equity in Rheos Medicines, Inc., Cambridge, Massachusetts, USA, and is a scientific advisory board member and holds equity in Solid BioSciences, Inc., Cambridge, Massachusetts, USA. T.J.W. is currently an employee of GentiBio, Inc., Boston, Massachusetts, USA. The trademarks of Rubius Therapeutics, Inc. – including Red Cell Therapeutics, RCT and RTX, are owned by Rubius Therapeutics and may only be used with its express permission.

Figures

Fig. 1
Fig. 1. RCT-aAPCs and mRBC-aAPCs promote antigen-specific T-cell expansion, memory formation, and cytotoxicity towards tumor cells in vitro and in vivo.
a EG7.OVA percent killing by RCT-activated OT-1 cells (n = 3). b CD45.1 Pep Boy mice were randomized (~180 mm3; n = 5), treated with naïve OT-1 cells, and dosed with 1 × 109 mRBC-CTRL or mRBC-aAPC. c OT-1 number on days 0, 3, and 6. One-way ANOVA compared to mRBC-CTRL; Day 3: mRBC-OVA-4-1BBL-IL-15 P < 0.0001; Day 6: mRBC-OVA-4-1BBL-IL-15 P < 0.0001, mRBC-OVA-4-1BBL-IL-12 P = 0.0001. d Memory OT-1 number on day 6 in blood. One-way ANOVA compared to mRBC-CTRL; Tscm (stem memory T cells): mRBC-OVA-4-1BBL P = 0.038; Tcm: mRBC-OVA-4-1BBL P = 0.0016, mRBC-OVA-4-1BBL-IL-15 P = 0.025; Tem: mRBC-OVA-4-1BBL-IL-15 P = 0.0001, mRBC-OVA-4-1BBL-IL-15 P < 0.0001. e CD45.1 Pep Boy mice were randomized (~150 mm3; n = 8), treated with naïve OT-1 cells, and dosed with 2.5 × 108 mRBC-CTRL or mRBC-aAPC. f Tumor growth and g survival. Log-rank (Mantel-Cox, one-sided) test of survival curve; mRBC-OVA-4-1BBL vs mRBC-OVA-4-1BBL-IL-12 and PBS vs mRBC-OVA-4-1BBL-IL-12 P < 0.0001. h CD45.1 Pep Boy mice were randomized (~230 mm3; n = 8), treated with naïve OT-1 cells, and dosed with OVA241-270 peptide with IFA or 1 × 109 mRBC-CTRL, mRBC-4-1BBL-IL-12, or mRBC-OVA-4-1BBL-IL-12. i Tumor growth. j OT-1 number in blood on Day 6. One-way ANOVA compared to mRBC-CTRL; mRBC-OVA-4-1BBL-IL-12 P < 0.0001. k CD45.1 Pep Boy mice were randomized (~175 mm3; n = 5), treated with naïve OT-1 cells, and dosed with 1 × 109 mRBC-CTRL or a dose titration of mRBC-OVA-4-1BBL-IL-12 (1 × 109, 2.5 × 108). l OT-1 numbers in 50 μL blood and per gram of tumor on day 7. One-way ANOVA compared to mRBC-CTRL; blood: 1 × 109P < 0.0001; tumor: 1 × 109 P = 0.0046. m TCRβ sequencing analyses of OT-1 TCR frequency in blood on day 0 (pre-blood), on day 7 (post-blood), and in tumor on day 7. One-way ANOVA compared to mRBC-CTRL; post blood: 1 × 109 P < 0.0001; tumor: 3 × 108 P = 0.02, 1 × 109 P < 0.0001. n Polyfunctionality (granzyme B+IFNγ+ %) in the tumor-infiltrating OT-1 cells on day 7. One-way ANOVA compared to mRBC-CTRL; 1 × 109 P = 0.0021. Data are depicted as mean ± s.d. and are representative of four (l blood), two (a, c, d, f, g, l tumor, n), or one (i, j, m) independent experiments. Source data are provided as a Source Data file.
Fig. 2
Fig. 2. mRBC-OVA-4-1BBL-IL-12 was well tolerated, with preferential biodistribution to the spleen to facilitate T-cell interaction.
a CD45.1 Pep Boy mice (n = 10) were treated with 1 × 106 naïve OT-1 cells or left untreated, and either dosed with 1 × 109 mRBC-CTRL or a dose titration of mRBC-OVA-4-1BBL-IL-12 (1 × 109, 3 × 108) on days 0, 4, 7, and 11. n = 5 were killed on day 12, with n = 5 measured for time points post day 12 for all groups except for n = 4 for mRBC-OVA-4-1BBL-IL-12+OT-1. b Body weight changes compared to day 0. Two-way ANOVA compared to mRBC-CTRL; day 3: 1 × 109 P = 0.019; day 12: 1 × 109 + OT-1 P = 0.048. c Plasma IFNγ levels over time. n = 10 for days 3 and 7; n = 5 post day 10 except for n = 4 for mRBC-OVA-4-1BBL-IL-12+OT-1 on days 17 and 25. Two-way ANOVA compared to mRBC-CTRL; day 3: 3 × 108 and 1 × 109 P < 0.0001, 3 × 108 + OT-1 P = 0.0002, 1 × 109 + OT-1 P < 0.0001; day 7: 3 × 108 + OT-1 P = 0.018; day 12: 3 × 108 + OT-1 P = 0.025, 1 × 109 P < 0.0001. d Serum ALT levels on days 12 and 25. One-way ANOVA compared to mRBC-CTRL; day 12: 1 × 109 + OT-1 P = 0.023. e CD45.1 Pep Boy mice (n = 5) were transferred with 2 × 106 naïve CellTrace Yellow dye-labeled OT-1 cells before dosing with 1 × 109 CellTrace Far Red dye-labeled mRBC-CTRL or mRBC-OVA-4-1BBL-IL-12. Fluorescently-labeled mRBCs per tissue area by immunofluorescent analyses at 1 h or 17 h post mRBC injection. One-way ANOVA compared to mRBC-CTRL; spleen: 1 h P < 0.0001, 17 h P = 0.022; liver: 1 h P = 0.0006. f Representative frame of confocal live cell imaging analyses of activated OT-1 cells (green) landing onto a layer of immobilized CellTrace Far Red dye-labeled mRBC-CTRL cells or mRBC-OVA-4-1BBL-IL-12 that were conjugated with DL650-labeled 4-1BBL protein (red). Mander’s colocalization coefficient was used to quantify percent of OT-1 signal which overlaps with mRBC signal in each frame (mRBC-CTRL: n = 54 frames; mRBC-OVA-4-1BBL-IL-12: n = 58 frames) of the live cell imaging video. Unpaired two-sided Student’s t-test; P < 0.0001. Data are depicted as mean ± s.d. and are representative of two independent experiments. Source data are provided as a Source Data file.
Fig. 3
Fig. 3. mRBC-OVA-4-1BBL-IL-12 promotes immune memory and epitope spreading, and harnesses endogenous T cells.
a CD45.1 Pep Boy mice were randomized when EG7.OVA tumors reached ~230 mm3 (n = 8), treated with naïve OT-1 cells, and dosed with 2.5 × 108 mRBC-OVA-4-1BBL-IL-12. Seven out of eight mice cured of original EG7.OVA tumors and were rechallenged on day 66 with EG7.OVA. Age-matched naïve CD45.1 Pep Boy mice (n = 5) were treated on day 65 with 5 × 105 naïve OT-1 cells 1 day before challenge with EG7.OVA cells, as controls. b All previously cured mice rejected EG7.OVA rechallenge. c Representative flow cytometry plots showing OT-1 and endogenous OVA-specific T cells in 50 μL of peripheral blood 10 days after EG7.OVA rechallenge (Day 76). d OT-1 and e endogenous OVA-specific T-cell numbers in 50 μL peripheral blood 2 days before rechallenge (Day 64), 4 days post rechallenge (Day 70), and 10 days post rechallenge (Day 76). One-way ANOVA compared to day 64; OT-1: day 75 P = 0.0009; endogenous OVA-specific: day 75 P = 0.0079. Unpaired two-way Student’s t test compared to naïve; OT-1 day 75 P = 0.018; endogenous OVA-specific: day 75 P = 0.018. f At 61 days post-second EG7.OVA challenge on day 127, cured mice (n = 7) along with age-matched naïve control mice (n = 5) were challenged with EL4. Three out of seven cured mice had delayed EL4 growth and three out of seven rejected EL4. g TCRβ sequencing analyses of OT-1 frequency on days 65, 73, 126, and 136 in the blood. h The significantly expanded TCR clones after EL4 challenge were tracked throughout the tumor challenges. The log of the sum clone frequencies in individual mice is shown. Data are depicted as mean ± s.d. and are representative of two (bf) or one (g, h) independent experiment. Source data are provided as a Source Data file.
Fig. 4
Fig. 4. mRBC-OVA-4-1BBL-IL-12 and mRBC-4-1BBL-IL-12 delays EG7.OVA tumor growth in mice without OT-1 transfer.
a C57BL/6 mice were inoculated subcutaneously with 2 × 106 EG7.OVA cells. Following that, 1 × 109 mRBC-CTRL, or a dose titration of mRBC-4-1BBL-IL-12 or mRBC-OVA-4-1BBL-IL-12 (1 × 109, 3 × 108) was administered (n = 8) on days 1, 4, 8, 11, 15, and 18. b Tumor growth curve after treatments. c OVA tetramer+ CD8+ T cells in 50 μL blood. Two-way ANOVA compared to mRBC-CTRL; 1 × 109 mRBC-4-1BBL-IL-12: day 18 P = 0.0057, day 21 P = 0.014; 3 × 108 mRBC-OVA-4-1BBL-IL-12: day 11 P = 0.0087, day 14 P = 0.023; 1 × 109 mRBC-OVA-4-1BBL-IL-12: days 7 and 11 P < 0.0001, day 14 P = 0.006, and day 18 P = 0.017. Data are depicted as mean ± s.d. and are representative of two independent experiments. Source data are provided as a Source Data file.
Fig. 5
Fig. 5. mRBC-aAPCs targeted against a tumor-associated antigen (gp100) promote antigen-specific pmel-1 T-cell expansion and effector function and dramatically reduce lung metastasis of B16-F10 tumors.
a C57BL/6 mice were injected intravenously with 1 × 105 B16-F10 tumor cells on day 0 followed by transfer of 2 × 106 naïve pmel-1 T cells on day 1. Mice (n = 8) were then dosed with 1 × 109 mRBC-CTRL, 1 × 109 mRBC-CTRL with anti-PD-1 (αPD-1), or 1 × 109, 2.5 × 108, or 6 × 107 mRBC-gp100-4-1BBL-IL-12 on days 1, 4, and 8. Analyses were performed on day 14 unless otherwise specified. For 1 × 109 mRBC-gp100-4-1BBL-IL-12, n = 5 for day 14 analyses. b Representative lung photos of 1 × 109 mRBC-CTRL, 1 × 109 mRBC-CTRL + αPD-1, or 1 × 109 mRBC-gp100-4-1BBL-IL-12-dosed mice. c Lung metastasis counts on day 14. One-way ANOVA P < 0.0001 compared to mRBC-CTRL at all dose levels. dg pmel-1 cell number in 50 μL blood (d), the spleen (e), the left lobe of perfused lung (f), and the effector function of lung-infiltrating pmel-1 and endogenous CD8+ T cells (g). One-way ANOVA compared to mRBC-CTRL; blood (d): 1 × 109 day 4 and day 7 P < 0.0001, day 11 P = 0.002; spleen (e) and lung (f): 1 × 109 P < 0.0001; functionality (g): pmel-1 and endogenous CD8 at 1 × 109 dose P < 0.0001 for IFNγ+%, granzymeB+%, and IFNγ+granzymeB+%. Data are depicted as mean ± s.d. and are representative of two independent experiments. Source data are provided as a Source Data file.
Fig. 6
Fig. 6. RTX-321 drives primary antigen-specific T-cell expansion, activation, memory differentiation, and effector function in vitro.
a RTX-321 expression by anti-IL-12, anti-4-1BBL, and anti-β2M staining. b Representative flow plots showing TCR expression of E7-TCR cells compared with untransduced T cells before co-culture. ch E7-TCR cells (duplicates from three donors) were incubated with RCT-CTRL, RCT-HPV, RCT-4-1BBL, RCT-IL-12, RCT-HPV-4-1BBL, RCT-4-1BBL-IL-12, RTX-321, or RCT-CMV-4-1BBL-IL-12. The Nur77+% at 2 h (c), CD69+% at 24 h (d), and 4-1BB+% on day 5 (e) of E7-TCR cells. f Representative flow plots showing E7-TCR+ expression of RCT-CTRL- and RTX-321-treated E7-TCR cells on day 5. Fold expansion of E7-TCR cells and untransduced CD8+ T cells over media-treated controls on day 5. g The granzyme B+ % of E7-TCR cells on day 1 and IFNγ concentration in the supernatant on day 5. h TCM and TEM of E7-TCR cell numbers on day 5. One-way ANOVA compared to RCT-CTRL; Nur77+% (c), CD69+% (d), and 4-1BB+% (e): RCT-HPV, RCT-HPV-4-1BBL, or RTX-321 P < 0.0001; CD8 T-cell expansion (f): RTX-321 E7-TCR P < 0.0001, untransduced P = 0.0062; granzymeB+% (g): RTX-321 P = 0.0021; IFNγ secretion (g): RTX-321 P < 0.0001; TCM number (h): RCT-HPV-4-1BBL P = 0.011, RTX-321 P < 0.0001; TEM number (h): RTX-321 P < 0.0001. Data are depicted as mean ± s.d and are representative of two independent experiments. Source data are provided as a Source Data file.

References

    1. Li D, et al. Genetically engineered T cells for cancer immunotherapy. Signal Transduct. Target. Ther. 2019;4:1–17. doi: 10.1038/s41392-018-0034-5. - DOI - PMC - PubMed
    1. Wang DY, et al. Fatal toxic effects associated with immune checkpoint inhibitors: A systematic review and meta-analysis. JAMA Oncol. 2018;4:1721–1728. doi: 10.1001/jamaoncol.2018.3923. - DOI - PMC - PubMed
    1. June CH, O’Connor RS, Kawalekar OU, Ghassemi S, Milone MC. CAR T cell immunotherapy for human cancer. Science. 2018;359:1361–1365. doi: 10.1126/science.aar6711. - DOI - PubMed
    1. Hay KA. Cytokine release syndrome and neurotoxicity after CD19 chimeric antigen receptor-modified (CAR-) T cell therapy. Br. J. Haematol. 2018;183:364–374. doi: 10.1111/bjh.15644. - DOI - PubMed
    1. Barrueto L, et al. Resistance to checkpoint inhibition in cancer immunotherapy. Transl. Oncol. 2020;13:100738. doi: 10.1016/j.tranon.2019.12.010. - DOI - PMC - PubMed

Publication types

MeSH terms