. 2021 May 11;12(1):2717.
doi: 10.1038/s41467-021-22901-x.

Comprehensive cell type decomposition of circulating cell-free DNA with CelFiE

Affiliations

Comprehensive cell type decomposition of circulating cell-free DNA with CelFiE

Christa Caggiano et al. Nat Commun. .

Abstract

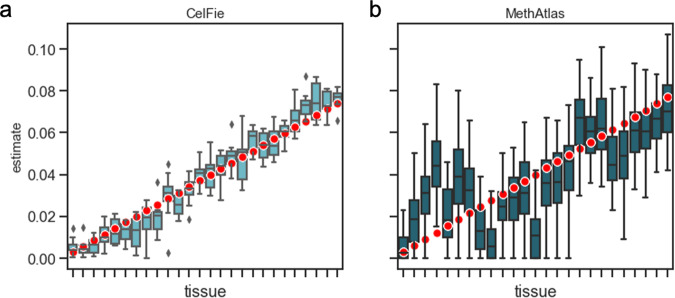
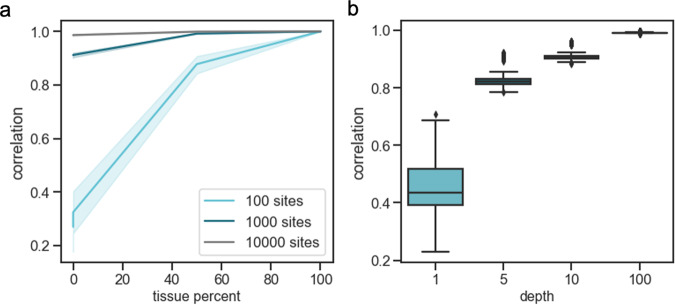
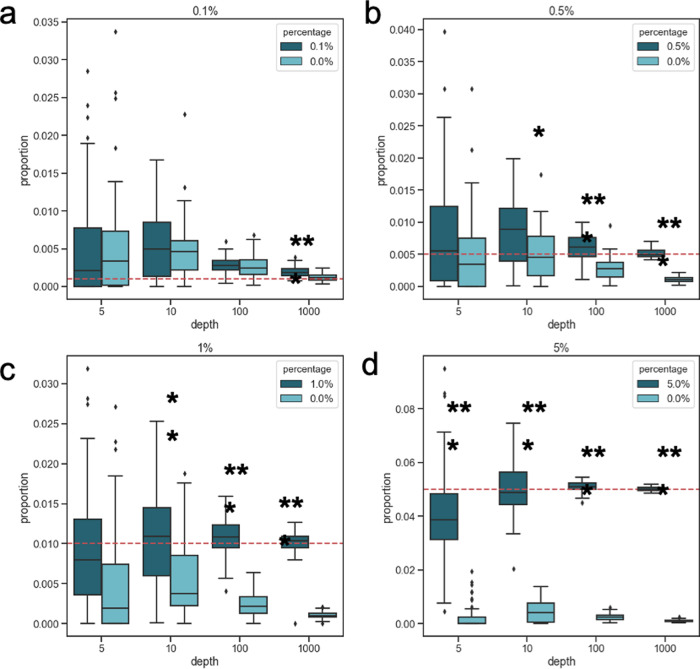
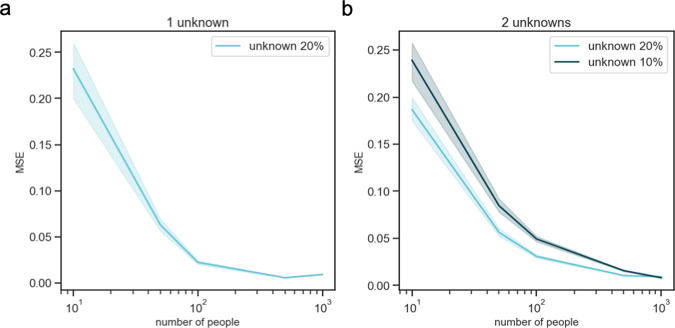
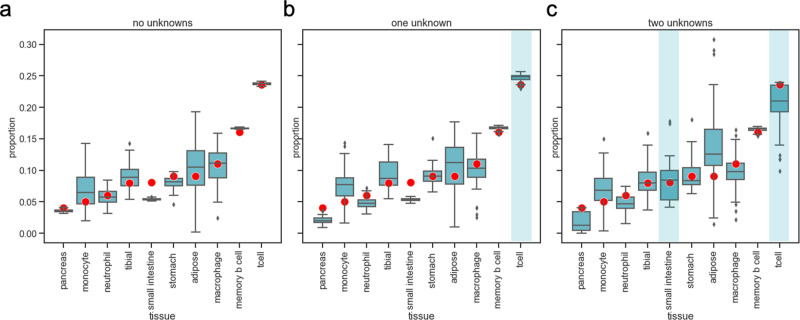
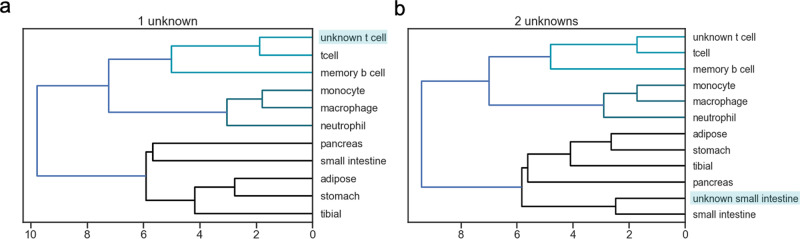
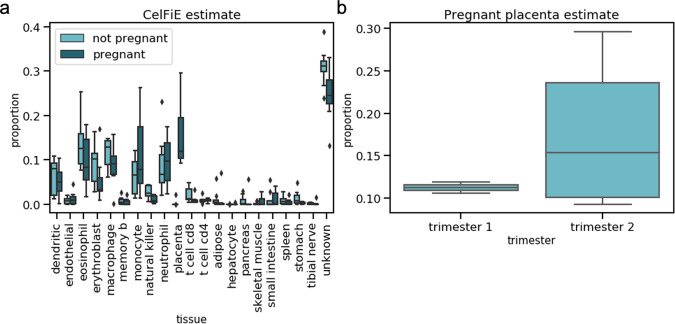
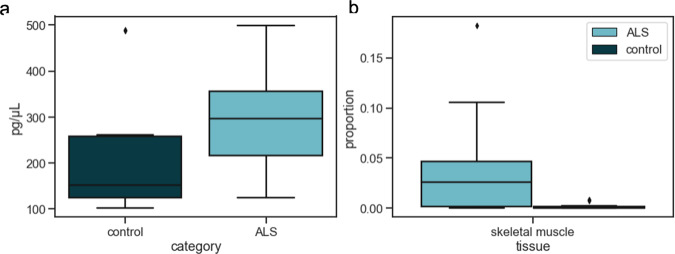
Circulating cell-free DNA (cfDNA) in the bloodstream originates from dying cells and is a promising noninvasive biomarker for cell death. Here, we propose an algorithm, CelFiE, to accurately estimate the relative abundances of cell types and tissues contributing to cfDNA from epigenetic cfDNA sequencing. In contrast to previous work, CelFiE accommodates low coverage data, does not require CpG site curation, and estimates contributions from multiple unknown cell types that are not available in external reference data. In simulations, CelFiE accurately estimates known and unknown cell type proportions from low coverage and noisy cfDNA mixtures, including from cell types composing less than 1% of the total mixture. When used in two clinically-relevant situations, CelFiE correctly estimates a large placenta component in pregnant women, and an elevated skeletal muscle component in amyotrophic lateral sclerosis (ALS) patients, consistent with the occurrence of muscle wasting typical in these patients. Together, these results show how CelFiE could be a useful tool for biomarker discovery and monitoring the progression of degenerative disease.


Conflict of interest statement

N.Z., B.L.B., B.C., and F.G. have a founding interest in Mercury Epigenomics, LLC, which was not directly or indirectly involved in any of these studies. All other authors report no competing interests.

Figures

Fig. 1
Fig. 1. Decomposition of simulated cfDNA mixtures by CelFiE (A) and MethAtlas (B).
50 replications for a single simulated individual were performed, and the estimated mixing proportions were plotted (light blue and dark blue boxes, respectively). The red dots indicate the true cell type proportion for each simulated tissue. The center line of the box indicates the mean, the outer edges of the box indicate the upper and lower quartiles, and the whiskers indicate the maxima and minima of the distribution.
Fig. 2
Fig. 2. The performance of CelFiE on simulated mixtures.
First, a cell type is fixed at a proportion between 0% and 100%, and reads are simulated for 100 (light blue line), 1000 (dark blue line), and 10,000 (black line) CpG sites at 10× depth (a). The Pearson’s correlation between the true and estimated cell-type proportion is plotted. Solid lines indicate the mean and the shading around the line indicates a 95% confidence interval. On (b) the average Pearson’s correlation between the true methylation values for the fixed tissues and the CelFiE estimated methylation values for 1000 sites simulated with 1×, 5×, 10×, and 100× depths (light blue boxes). The center of the boxplot indicates the mean of the distribution, the edges of the box indicate the upper and lower quartiles, and the edge of the whiskers indicate the maxima and minima of the distribution. Data is shown for 50 independent simulations of one individual.
Fig. 3
Fig. 3. Cell type proportion estimates for n = 5 simulated individuals (dark blue boxes) with a cell type of interest and n = 5 individuals without that cell type (light blue boxes).
Cell type proportions are simulated at (a) 0.1% (two-sided grouped t-test; 5×: n.s., 10×: n.s, 100×: n.s., 1000×: p = 3.5 × 10−5), (b) 0.5% (two-sided grouped t-test; 5×: n.s., 10×: p = 0.013, 100×: 2.1 × 10−6, 1000×: p = 5.7 × 10−11), (c) 1% (two-sided grouped t-test; 5×: n.s., 10×: p = 1.5 × 10−3, 100×: 2.8 × 10−9, 1000×: p = 4.3 × 10−12), or (d) 5% (two-sided grouped t-test; 5×: 4.8 × 10−8, 10×: p =5.4 × 10−9, 100×: 1.8 × 10−14, 1000×: p < 2.0 × 10−16). The true fixed percentage of the cases is indicated by a red dotted line. Significant differences between the groups are indicated by *(p < 0.05), **(p < 0.01), and ***(p < 0.001). The centerline of the box indicates the mean, the outer edges of the box indicate the upper and lower quartiles, and the whiskers indicate the maxima and minima of the distribution. Data is shown for 50 independent simulations.
Fig. 4
Fig. 4. Decomposition results for 50 independent simulations of cfDNA mixtures with missing cell types in the reference.
We simulate cfDNA for 10, 50, 100, 500, and 1000 people, and exclude one cell type truly in the mixture at 20% (light blue) (a) or two cell types (b), one in the mixture at a mean proportion of 20% (light blue), and the other at 10% (dark blue). We calculate the MSE between the true unknown proportion and the CelFiE estimate for 50 simulation experiments. The 95% confidence interval is indicated by the light and dark blue shading.
Fig. 5
Fig. 5. CelFiE cell type proportion estimates for a randomly selected individual’s real WGBS cfDNA over 50 simulation experiments.
The blue boxes represent estimates of the true cell type composition (red dots) for 100 individuals in 50 simulation experiments in the scenario where there are no missing cell types (a), when CD4+ T cells are a missing cell type (indicated by blue shading) (b) and when CD4+ T cell and small intestine are both missing (c). The center line of the boxplot indicates the mean, the outer edges of the box indicate the upper and lower quartiles, and the whiskers indicate the maxima and minima of the distribution.
Fig. 6
Fig. 6. Hierarchical clustering of the CelFiE methylation proportion estimates for (a) one unknown and (b) 2 unknowns with the true WGBS methylation proportions.
The shaded blue box indicates the unknown tissue. The light blue, dark blue, and black colors indicate clusters of tissues detected by the hierarchical clustering algorithm.
Fig. 7
Fig. 7. Decomposition estimates for cfDNA derived from pregnant women and non-pregnant controls.
a CelFiE decomposition estimates for independent samples of n = 8 non-pregnant (light blue) and n = 7 pregnant women (dark blue). b CelFiE placenta estimates for n = 3 pregnant women in the first trimester and n = 4 women in the second trimester. In all cases, the center line of the boxplot indicates the mean, the outer edges of the box indicate the upper and lower quartiles, and the whiskers indicate the maxima and minima of the distribution.
Fig. 8
Fig. 8. CfDNA concentration and decomposition estimates for ALS patients and age-matched controls.
a CfDNA concentrations for n = 28 independent cases and n = 25 independent controls and b CelFiE skeletal muscle estimates for n = 16 ALS patients (light blue) and n = 16 controls (dark blue) from both UCSF and University of Queensland. In both panels, the center line of the boxplot indicates the mean, the outer edges of the box indicate the upper and lower quartiles, and the whiskers indicate the maxima and minima of the distribution.

References

    1. Nagata S. Apoptosis by death factor. Cell. 1997;88:355–365. doi: 10.1016/S0092-8674(00)81874-7. - DOI - PubMed
    1. Meier P, et al. Apoptosis in development. Nature. 2000;407:796–801. doi: 10.1038/35037734. - DOI - PubMed
    1. Joka D, et al. Prospective biopsy-controlled evaluation of cell death biomarkers for prediction of liver fibrosis and nonalcoholic steatohepatitis. Hepatology. 2012;55:455–464. doi: 10.1002/hep.24734. - DOI - PubMed
    1. Vila M, Przedborski S. Targeting programmed cell death in neurodegenerative diseases. Nat. Rev. Neurosci. 2003;4:365–375. doi: 10.1038/nrn1100. - DOI - PubMed
    1. Turner M, et al. Mechanisms, models and biomarkers in amyotrophic lateral sclerosis. Amyotroph. Lateral Scler. frontotemporal Degener. 2013;14:19–32. doi: 10.3109/21678421.2013.778554. - DOI - PMC - PubMed

Publication types

MeSH terms