. 2021 May 11;12(1):2628.
doi: 10.1038/s41467-021-22933-3.

Aortic disease in Marfan syndrome is caused by overactivation of sGC-PRKG signaling by NO

Affiliations

Aortic disease in Marfan syndrome is caused by overactivation of sGC-PRKG signaling by NO

Andrea de la Fuente-Alonso et al. Nat Commun. .

Abstract

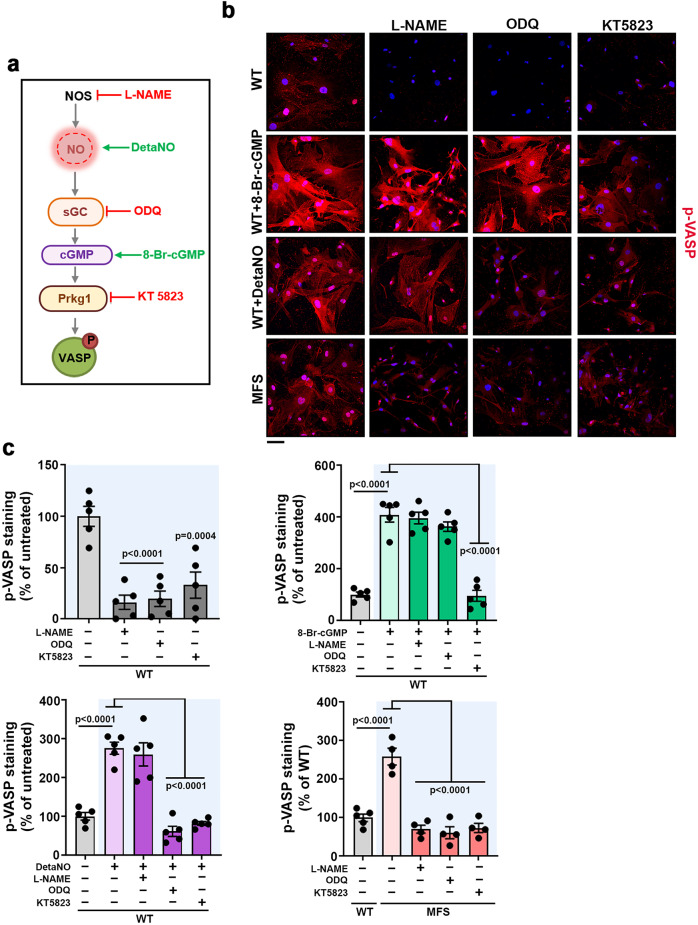
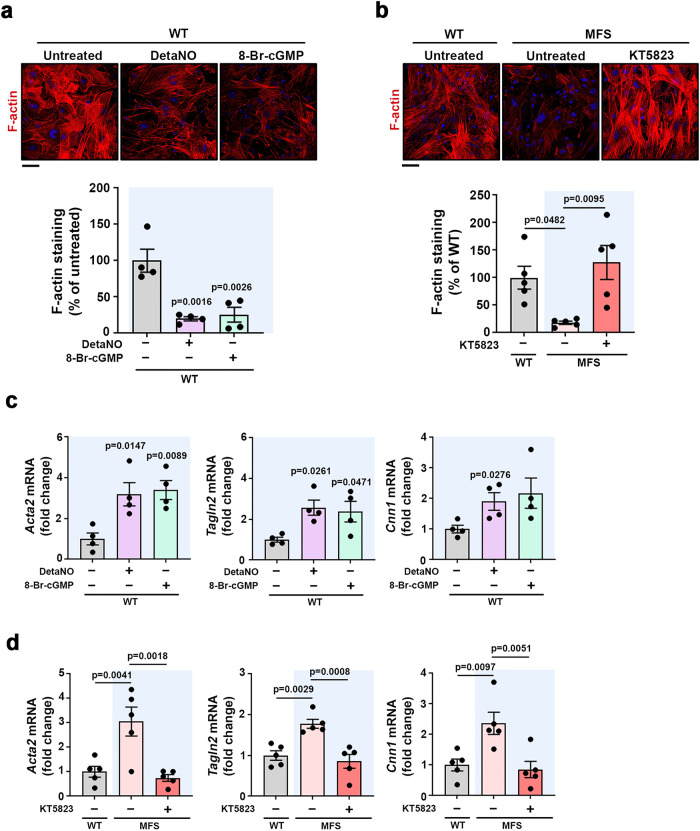
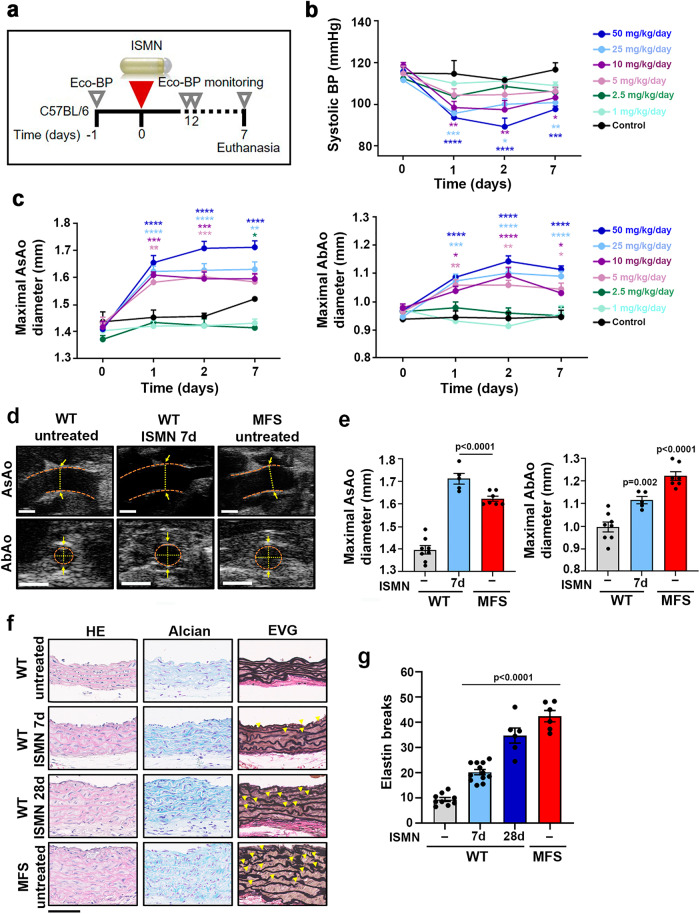
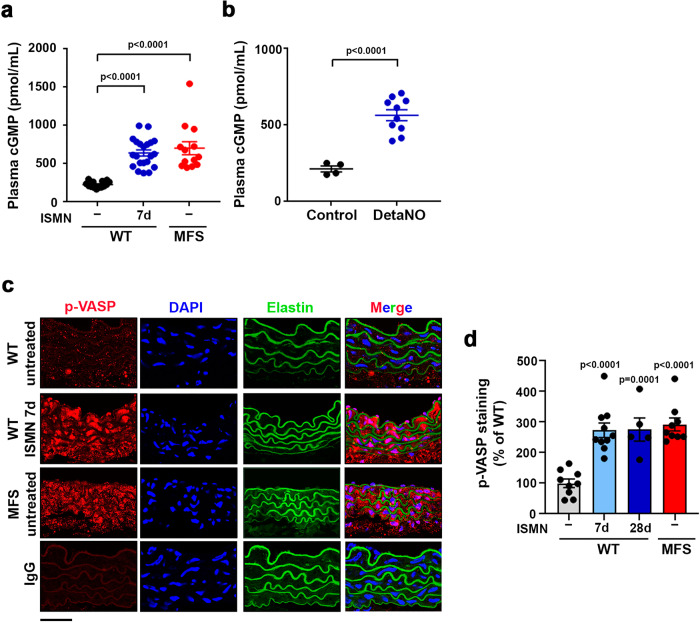
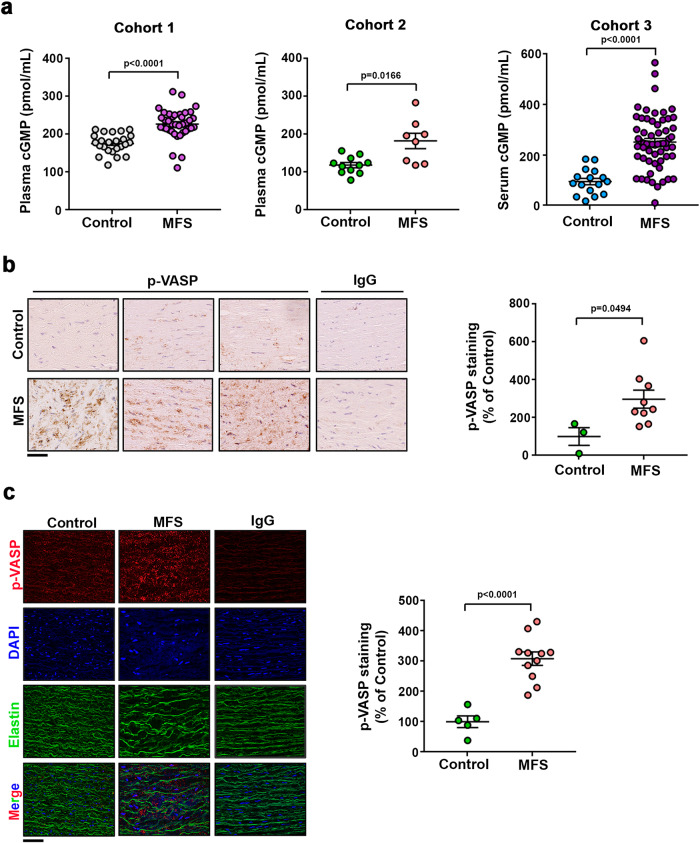
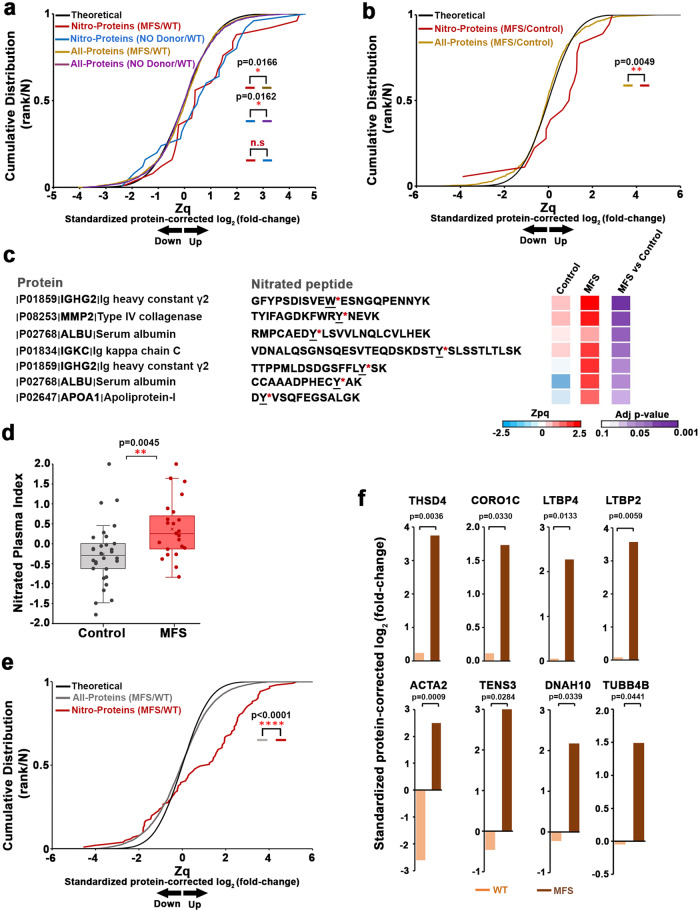
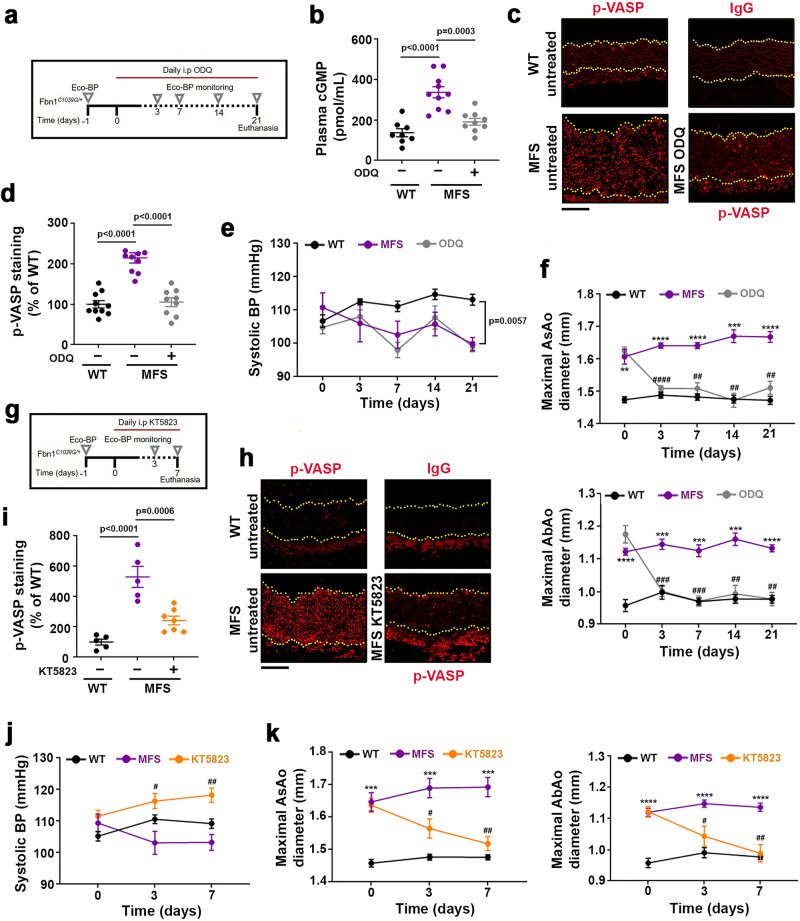
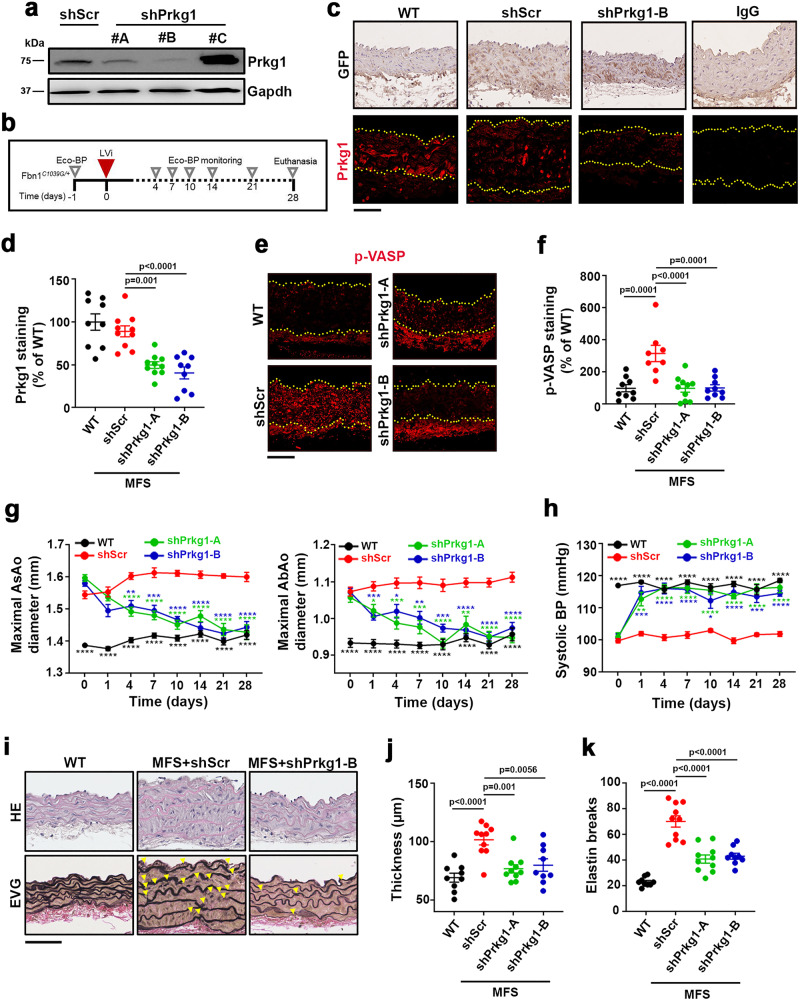
Thoracic aortic aneurysm, as occurs in Marfan syndrome, is generally asymptomatic until dissection or rupture, requiring surgical intervention as the only available treatment. Here, we show that nitric oxide (NO) signaling dysregulates actin cytoskeleton dynamics in Marfan Syndrome smooth muscle cells and that NO-donors induce Marfan-like aortopathy in wild-type mice, indicating that a marked increase in NO suffices to induce aortopathy. Levels of nitrated proteins are higher in plasma from Marfan patients and mice and in aortic tissue from Marfan mice than in control samples, indicating elevated circulating and tissue NO. Soluble guanylate cyclase and cGMP-dependent protein kinase are both activated in Marfan patients and mice and in wild-type mice treated with NO-donors, as shown by increased plasma cGMP and pVASP-S239 staining in aortic tissue. Marfan aortopathy in mice is reverted by pharmacological inhibition of soluble guanylate cyclase and cGMP-dependent protein kinase and lentiviral-mediated Prkg1 silencing. These findings identify potential biomarkers for monitoring Marfan Syndrome in patients and urge evaluation of cGMP-dependent protein kinase and soluble guanylate cyclase as therapeutic targets.


Conflict of interest statement

The authors declare no competing interests.

Figures

Fig. 1
Fig. 1. Pharmacological inhibition of signaling components of the NO–sGC–PRKG pathway decreases pVASP-S239 induction in VSMCs from MFS mice.
a NO signaling components and the targets of pharmacological stimuli (green) and inhibitors (red). b Representative images of pVASP-S239 immunofluorescence (red) and DAPI-stained nuclei (blue). c Quantification of pVASP-S239 immunofluorescence in WT and MFS VSMCs treated with 300 µM L-NAME, 10 µM ODQ, or 1 µM KT5823 for 1 h before stimulation for 5 minutes with 100 µM 8-Br-cGMP or 100 µM DetaNO, as indicated. b, c Five independent cell batches were used for all conditions except for MFS VSMCs (n = 4). Scale bar, 50 μm. Data are shown relative to untreated WT cells as mean ± s.e.m. Each data point denotes the mean value from an independent experiment. Differences were analyzed by one‐way ANOVA with Dunnett’s post-hoc test (p-values are shown). Source data are provided in the Source Data file.
Fig. 2
Fig. 2. The NO–sGC–PRKG pathway modulates the contractility phenotype of VSMCs.
a, b Representative images of F-actin staining (red) and DAPI-stained nuclei (blue) and F-actin quantification in a WT VSMCs treated as indicated for 5 min (n = 4 independent cell batches per condition) and b WT and MFS VSMCs untreated or treated with KT5823 for 24 h (n = 5 independent cell batches per condition). Scale bar, 50 μm. Data are shown relative to untreated WT cells as mean ± s.e.m. Each data point denotes the mean value from an independent experiment. Differences were analyzed by one‐way ANOVA with Tukey’s post-hoc test (p-values are shown). c, d RT-qPCR analysis of Acta2, Cnn1, and Tagln2 mRNA expression in c WT VSMCs treated as indicated for 4 h and d WT or MFS VSMCs treated as indicated for 24 h (n = 4 independent cell batches per group in c and n = 5 independent cell batches per group in d). mRNA amounts were normalized to Gapdh expression (mean ± s.e.m.). Each data point denotes the mean value from an independent experiment. Differences were analyzed by one‐way ANOVA followed by Dunnett’s post-hoc test (p-values are shown). Source data are provided in the Source Data file.
Fig. 3
Fig. 3. ISMN induces an MFS-like aortopathy in WT mice.
a Experimental design. 12-week-old C57BL/6 mice were treated for 7 days (d) with the NO-donor ISMN at 1, 2.5, 5, 10, 25, or 50 mg/kg/day by osmotic minipump infusion. Mice were monitored by Eco-BP (ultrasound and BP analysis) at the indicated times (empty triangles). b Systolic BP during ISMN infusion. c Maximal AsAo diameter (left) and AbAo diameter (right) during ISMN infusion. Data in b and c are mean ± s.e.m; n = 5 per treated group, n = 3 for control group. *P < 0.05, **P < 0.01, ***P < 0.001, and ****P < 0.0001 (versus control at each time point) by repeated-measurements two-way ANOVA with Bonferroni’s post-hoc test. d Representative ultrasound images (orange dashed lines delineate the lumen boundary and yellow dashed lines mark the lumen diameter) and e quantification of end-of-experiment maximal AsAo and AbAo diameter in untreated WT mice (−) (n = 8), MFS mice (n = 7), and WT mice treated with 50 mg/kg/day ISMN for 7 d (n = 5). Each data point denotes an individual mouse, whereas histograms show mean ± s.e.m. f Representative staining with hematoxylin and eosin (HE) (left), Alcian blue (middle), and elastic van Gieson (EVG) (right) in the AsAo from 9 to 12-week-old untreated WT mice (−), 6 MFS mice, and WT mice treated with 50 mg/kg/day ISMN for 7 d (n = 12 mice) or 28 d (n = 6 mice). Yellow arrowheads indicate elastin breaks. Scale bar, 50 μm. g Quantification of elastin breaks in AsAo sections from 9 to 12-week-old untreated WT mice (−), 6 MFS mice, and WT mice treated with 50 mg/kg/day ISMN for 7 d (n = 12 mice) or 28 d (n = 6 mice). Each data point denotes an individual mouse, whereas histograms denote mean ± s.e.m. e, g Differences were analyzed by one-way ANOVA with Dunnett’s post-hoc test (p-values are shown). Source data are provided in the Source Data file.
Fig. 4
Fig. 4. The sGC–PRKG pathway is activated in MFS and in NO-donor-treated mice.
a Plasma cGMP in 12–13-week-old untreated WT mice (−) (n = 14), MFS mice (n = 13), and WT mice treated with 50 mg/kg/day ISMN for 7 d (n = 20). b Plasma cGMP in untreated WT mice (Control) (n = 4) and WT mice treated with 5 mg/kg/day DetaNO for 2 d (n = 10). c Representative images of pVASP-S239 immunofluorescence (red), elastin autofluorescence (green), and DAPI-stained nuclei (blue). d Quantification of pVASP-S239 immunofluorescence in aortic sections from 12-week-old untreated WT mice (−) (n = 9), MFS mice (n = 9), and WT mice treated with 50 mg/kg/day ISMN for 7 d (n = 10) or 28 d (n = 5). IgG staining served as a negative control. Scale bar, 50 µm. a, b, d Data are shown relative to untreated WT mice as mean ± s.e.m. Data points denote individual mice. Differences were analyzed by a, d one-way ANOVA with Dunnett’s post-hoc test or b unpaired two-tailed t-test (p-values are shown). Source data are provided in the Source Data file.
Fig. 5
Fig. 5. The sGC–PRKG pathway is activated in aortas of MFS patients.
a Plasma (Cohorts 1 and 2) and serum (Cohort 3) cGMP in three independent cohorts including 24 healthy donors and 38 MFS patients (Cohort 1); 11 healthy donors and 8 MFS patients (Cohort 2); and 11 healthy donors and 33 MFS patients (Cohort 3). Data are mean ± s.e.m. Each data point denotes an individual. b Representative medial layer images and quantification of pVASP-S239 immunohistochemistry in aortic cross-sections of human samples from 3 control donors and 9 MFS patients. Scale bar, 50 μm. IgG staining served as a negative control. Data are shown relative to healthy donors as mean ± s.e.m. Each data point denotes an individual. c Representative medial layer images and quantification of pVASP-S239 immunofluorescence (red) and DAPI-stained nuclei (blue) in sections from 5 control donors and 11 MFS patients. Scale bars, 50 μm. IgG staining served as a negative control. Data are shown relative to healthy donors as mean ± s.e.m. Each data point denotes an individual. ac Differences were analyzed by unpaired two-tailed t-test with Welch’s correction (p-values are shown). Source data are provided in the Source Data file.
Fig. 6
Fig. 6. Quantitative proteomics shows that increased protein nitration is a signature of MFS in mice and humans.
Quantitative proteomics analysis of plasma samples from a untreated WT mice (n = 7), MFS mice (n = 7), and DetaNO-treated WT mice (n = 6) and b MFS patients (n = 23) and healthy donors (n = 30). Data were analyzed using the SanXoT package. Theoretical, normal distribution; Nitro-proteins, cumulative distributions of indicated nitrated protein values corrected to the values for nonmodified peptides from the same protein; All-proteins, cumulative distributions of nonmodified peptides. Data are expressed in standardized log2-ratios (Zq) relative to a untreated WT or b healthy donors (Control). Differences were analyzed by two-tailed Kolmogorov-Smirnov test (p-values are shown; n.s., not significant). Representative annotated fragmentation spectra for 2 mouse nitro-peptides are provided in Supplementary Fig. 9. All MS/MS spectra of identified tryptic nitro-peptides are provided in the Data availability section. c List of nitrated peptides showing significantly higher abundance in MFS patients. The heatmap shows standardized log2-ratios (Zpq) and statistical significance calculated using limma analysis. The annotated fragmentation spectra of these 7 nitro-peptides are provided in Supplementary Fig. 10. d Nitrated plasma index, defined as the weighted mean of the nitro-peptides listed in c, for 23 MFS patients and 30 healthy donors (Control). Each data point denotes an individual, boxes enclose the interquartile range (IQR), the line in the box shows the centre (median), and whiskers extend 1.5 times above and below the IQR. Differences were analyzed by unpaired two-tailed Student’s t-test. e Quantitative proteomics analysis of pooled aortic samples from 12 untreated WT mice (n = 6 pools) and 12 MFS mice (n = 6 pools). Nitrated protein distributions are shown as in a and b. Differences were analyzed by two-tailed Kolmogorov-Smirnov test. f Barplots showing standardized log2-ratios (Zq) integrated by condition (untreated WT and MFS) for significantly upregulated nitro-proteins related to the cytoskeleton: thrombospondin type-1 domain-containing protein 4 (THSD4), coronin 1-C (CORO1C), latent-transforming growth factor beta 2 and 4 (LTBP2, LTBP4), actin aortic smooth muscle (ACTA2), tensin 3 (TNS3), dynein heavy chain 10 (DNAH10), and tubulin beta 4 chain (TUBB4B). Differences were analyzed by limma statistical analysis (exact p-values are shown). Source data are provided in the Source Data file.
Fig. 7
Fig. 7. Pharmacological inhibition of sGC or PRKG reverts aortopathy in Marfan syndrome.
a Experimental design. 14-week-old MFS mice were treated daily for 21 days with 20mg/kg/day ODQ. Longitudinal ultrasound and BP analysis (Eco-BP) was performed at the indicated times (empty triangles). b Plasma cGMP at 21 d (n = 8 WT mice, n = 10 MFS mice, and n = 9 ODQ-treated MFS mice). c Representative pVASP-S239 immunofluorescence (red) in mouse aortic sections. Yellow dashed lines delineate the lumen boundary. IgG staining served as a negative control. Scale bar, 50 µm. d Quantification of pVASP-S239 immunofluorescence in aortic sections from 10 untreated WT mice (−), 10 MFS mice, and 9 MFS mice treated with 20 mg/kg/day ODQ for 21 d. IgG staining served as a negative control. Scale bar, 50 µm. b, d Data are mean ± s.e.m. Each data point denotes an individual mouse. Differences were analyzed by one-way ANOVA with Tukey’s post-hoc test (p-values are shown). e, f Systolic BP (e) and maximal AsAo and AbAo (f) diameter at the indicated times (n = 5 mice each for untreated and ODQ-treated MFS groups; n = 7 mice for WT group). Data are mean ± s.e.m. **P < 0.01, ***P < 0.001, and ****P < 0.0001 (versus WT mice); ##P < 0.01, ###P< 0.001, and ####P < 0.0001 (versus untreated MFS) by repeated-measurements two-way ANOVA with Tukey’s post-hoc test. g Experimental design. 14-week-old MFS mice were treated daily for 7 days with 2 µmol/kg/day KT5823 and monitored for aortic dilation and BP before treatment and 3 d and 7 d post-treatment. h Representative pVASP-S239 immunofluorescence (red) in mouse aortic sections. Yellow dashed lines delineate the lumen boundary. IgG staining served as a negative control. Scale bar, 50 µm. i Quantification of pVASP-S239 immunofluorescence in aortic sections from untreated WT mice (−) (n = 5), MFS mice (n = 5), and MFS mice treated with 2 µmol /kg/day KT5823 for 7 d (n = 7). Data are shown relative to untreated WT mice as mean ± s.e.m. Each data point denotes an individual mouse. Differences were analyzed by one-way ANOVA with Tukey’s post-hoc test (p-values are shown). j, k Systolic BP (j) and maximal AsAo and AbAo (k) diameter at the indicated times (n = 10 for untreated WT group; n = 8 per each MFS group). Data are mean ± s.e.m. ***P < 0.001 and ****P < 0.0001 (versus WT), #P < 0.05 and ##P < 0.01 (versus untreated MFS) by repeated-measurements two-way ANOVA with Tukey’s post-hoc test. Source are provided in the Source Data file.
Fig. 8
Fig. 8. Prkg1 silencing reverts aortopathy in Marfan syndrome.
a Representative immunoblot analysis (n = 2 independent experiments) of Prkg1 expression in WT DetaNO-treated VSMCs transduced with lentivirus (LVi) encoding control shRNA (shScr) or Prkg1-specific shRNAs A, B, and C. Uncropped blots in Supplementary Fig. 13. b Experimental design; 14-week-old MFS mice were inoculated through the jugular vein with LVi encoding GFP and either a control shRNA (shScr) or Prkg1-specific shRNAs A and B. Mice were monitored for aortic dilation and BP prior to treatment and at the indicated times. c Representative images of GFP immunohistochemistry (top) and Prkg1 immunofluorescence (bottom). Top and bottom yellow dashed lines delineate the lumen and the adventitia boundary, respectively. IgG staining of AsAo sections from shScr-transduced MFS mice served as a negative control. Scale bar, 50 µm. d Quantification of Prkg1 immunofluorescence in AsAo sections of control WT and shScr-, and shPrkg1-B-transduced MFS mice (n = 9 in WT mice and MFS mice infected with shPrkg1-B, n = 10 in MFS mice infected with shScr or Prkg1-A). Data are shown relative to WT mice as mean ± s.e.m. Each data point denotes an individual mouse. e Representative pVASP-S239 immunofluorescence (red) in mouse aortic sections. Yellow dashed lines delineate the lumen boundary. IgG staining served as a negative control. Scale bar, 50 µm. f Quantification of pVASP-S239 immunofluorescence in aortic sections from 9 WT, 8 MFS shScr, 10 MFS shPrkg1-A, and 9 MFS shPrkg1-B mice. Data are shown relative to uninfected WT mice as mean ± s.e.m. Each data point denotes an individual mouse. d, f Differences were analyzed by one-way ANOVA with Tukey’s post-hoc test (p-values are shown). g, h Maximal AsAo and AbAo (g) diameter and systolic BP (h) at the indicated times (n = 10 per group). Data are mean ± s.e.m. *P < 0.05, **P < 0.01, ***P < 0.001, and ****P < 0.0001 versus shScr by repeated-measurements two-way ANOVA with Tukey’s post-hoc test. i Representative images showing staining with hematoxylin and eosin (HE) and elastic van Gieson (EVG) in AsAo of the indicated mice (n = 9–10 mice per group). Yellow arrowheads indicate elastin breaks. Scale bar, 50 μm. j Wall thickness and k elastin breaks in AsAo sections from the mouse cohorts shown in i. Data are mean ± s.e.m. Each data point denotes an individual mouse. j, k Differences were analyzed by one-way ANOVA with Tukey’s post-hoc test (p-values are shown). Source data are provided in the Source Data file.

References

    1. Ruddy JM, Jones JA, Ikonomidis JS. Pathophysiology of thoracic aortic aneurysm (TAA): is it not one uniform aorta? Role of embryologic origin. Prog. Cardiovasc. Dis. 2013;56:68–73. doi: 10.1016/j.pcad.2013.04.002. - DOI - PMC - PubMed
    1. Lindsay ME, Dietz HC. Lessons on the pathogenesis of aneurysm from heritable conditions. Nature. 2011;473:308–316. doi: 10.1038/nature10145. - DOI - PMC - PubMed
    1. Milewicz DM, et al. Genetic basis of thoracic aortic aneurysms and dissections: focus on smooth muscle cell contractile dysfunction. Annu. Rev. Genomics Hum. Genet. 2008;9:283–302. doi: 10.1146/annurev.genom.8.080706.092303. - DOI - PubMed
    1. Dietz HC, Loeys B, Carta L, Ramirez F. Recent progress towards a molecular understanding of Marfan syndrome. Am. J. Med. Genet. C. Semin. Med. Genet. 2005;139C:4–9. doi: 10.1002/ajmg.c.30068. - DOI - PubMed
    1. Judge DP, Dietz HC. Marfan’s syndrome. Lancet. 2005;366:1965–1976. doi: 10.1016/S0140-6736(05)67789-6. - DOI - PMC - PubMed

Publication types

MeSH terms