. 2021 May 11;12(1):2653.
doi: 10.1038/s41467-021-22849-y.

Variability of plasmid fitness effects contributes to plasmid persistence in bacterial communities

Affiliations

Variability of plasmid fitness effects contributes to plasmid persistence in bacterial communities

Aida Alonso-Del Valle et al. Nat Commun. .

Abstract

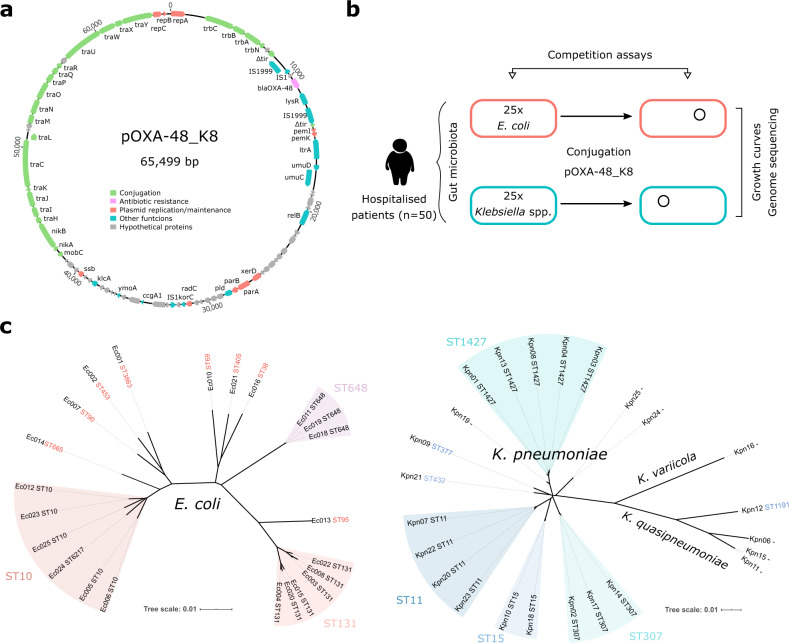
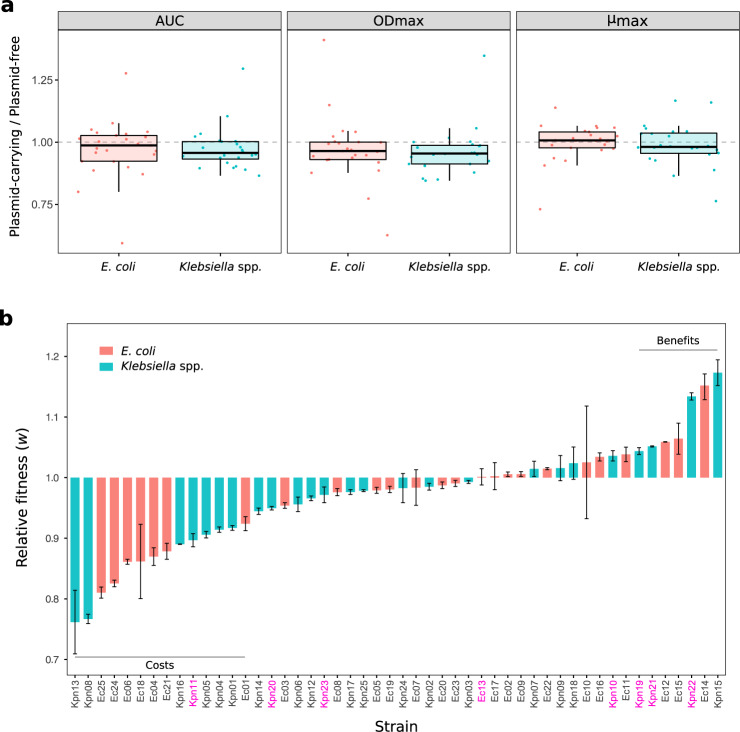
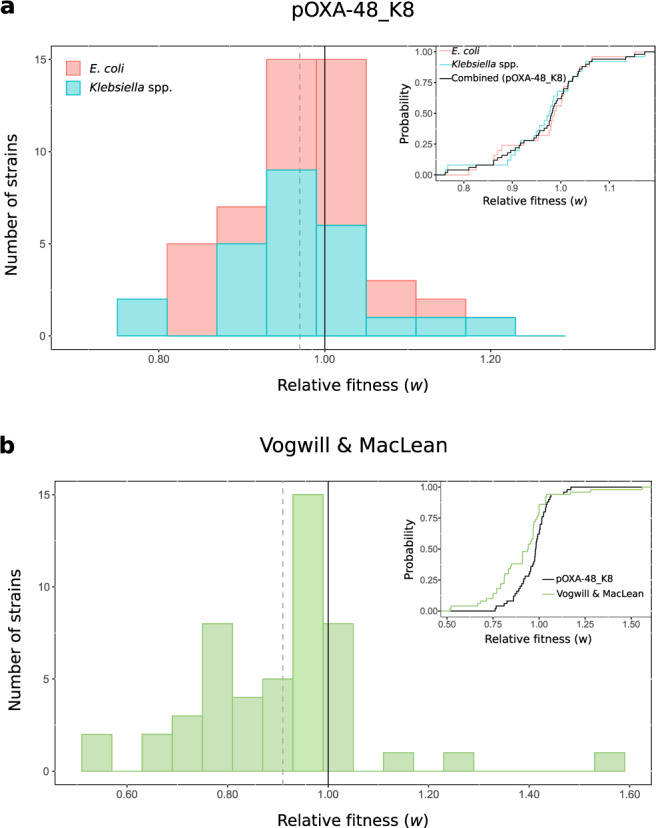
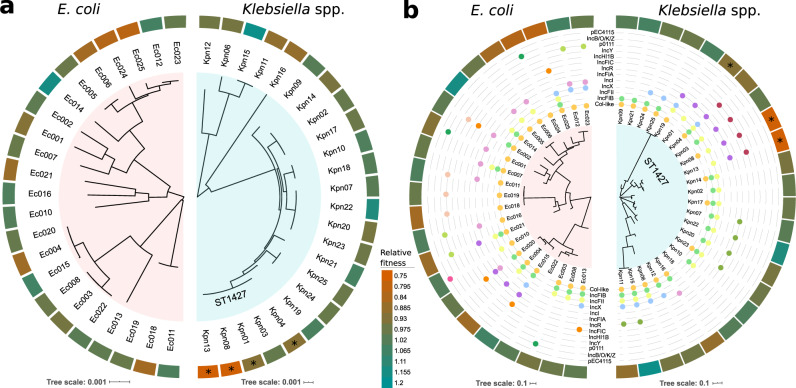
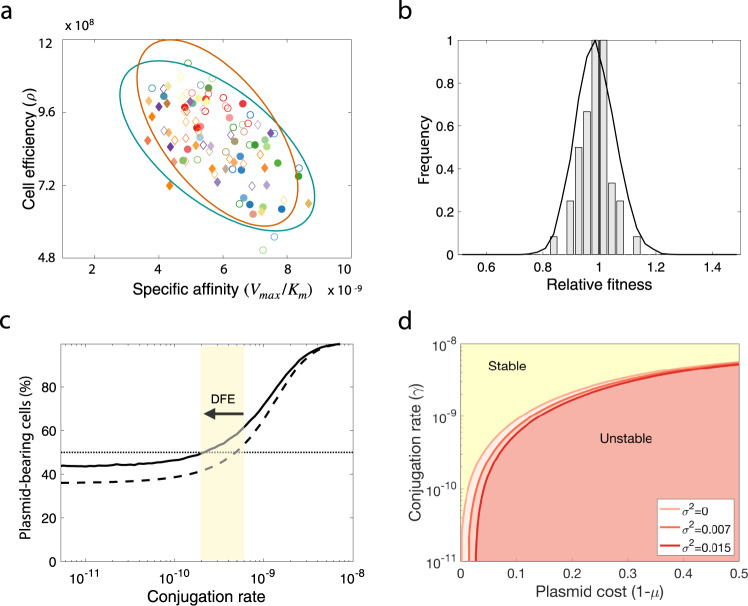
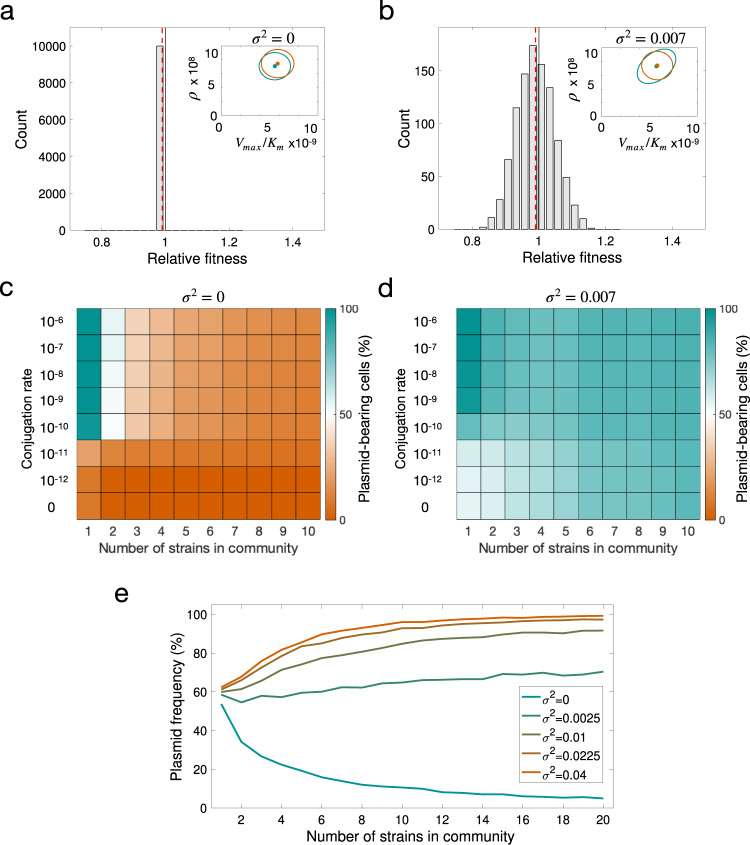
Plasmid persistence in bacterial populations is strongly influenced by the fitness effects associated with plasmid carriage. However, plasmid fitness effects in wild-type bacterial hosts remain largely unexplored. In this study, we determined the fitness effects of the major antibiotic resistance plasmid pOXA-48_K8 in wild-type, ecologically compatible enterobacterial isolates from the human gut microbiota. Our results show that although pOXA-48_K8 produced an overall reduction in bacterial fitness, it produced small effects in most bacterial hosts, and even beneficial effects in several isolates. Moreover, genomic results showed a link between pOXA-48_K8 fitness effects and bacterial phylogeny, helping to explain plasmid epidemiology. Incorporating our fitness results into a simple population dynamics model revealed a new set of conditions for plasmid stability in bacterial communities, with plasmid persistence increasing with bacterial diversity and becoming less dependent on conjugation. These results help to explain the high prevalence of plasmids in the greatly diverse natural microbial communities.


Conflict of interest statement

The authors declare no competing interests.

Figures

Fig. 1
Fig. 1. Experimental model system.
Representation of pOXA-48_K8 plasmid and the enterobacteria strains used in this study. a pOXA-48_K8 (accession number MT441554). Reading frames are shown as arrows, indicating the direction of transcription. Colours indicate gene function classification (see legend). The blaOXA-48 gene is shown in pink. b Schematic representation of the experimental design used in this study. c Unrooted phylogeny of whole-genome assemblies from E. coli clones (left) and Klebsiella spp. clones (right). Branch length gives the inter-assembly mash distance (a measure of k-mer similarity). The grouping of multilocus sequence types (ST) is also indicated (E. coli ST6217 belongs to the ST10 group). Note that the sequencing results revealed that a subset of isolates initially identified as K. pneumoniae were in fact Klebsiella quasipneumoniae (n = 4) and Klebsiella variicola (n = 1).
Fig. 2
Fig. 2. pOXA-48_K8 fitness effects in a set of ecologically compatible wild-type enterobacteria.
a Relative values of growth curve parameters (plasmid-carrying/plasmid-free isogenic clones): area under the growth curve (AUC), maximum optical density (ODmax), and maximum growth rate (μmax), represented as boxplots for E. coli (red) and Klebsiella spp. (blue) isolates separately. Horizontal lines inside boxes indicate median values, the upper and lower hinges correspond to the 25th and 75th percentiles, and whiskers extend to observations within 1.5 times the interquartile range. Dots represent each relative value. Values <1 indicate a reduction in these parameters associated with plasmid acquisition. Four and six biological replicates of the growth curves were performed for the wild-type isolates and the transconjugants, respectively (see Supplementary Figs. 1 and 2). b Relative fitness (w) of plasmid-carrying clones compared with plasmid-free clones obtained by competition assays (red, E. coli; blue, Klebsiella spp. see “Methods” for details). Values <1 indicate a reduction in w due to plasmid acquisition; values >1 indicate an increase in w. Bars represent normalised relative fitness after subtracting the effect of pBGC (average result of five independent biological replicates of the competition pOXA-48-carrying vs. pBGC-carrying strains divided by the average result of five independent biological replicates of the competition pOXA-48-free vs. pBGC-carrying strains), and error bars represent the propagated standard error. Two horizontal lines indicate those clones showing significant costs or benefits associated with carrying pOXA-48 plasmid (Bonferroni corrected two-sampled t test, P < 0.05). The names of the clones for which the relative fitness was calculated using E. coli strain J53 carrying the pBGC vector, instead of the pBGC-carrying parental strain, are indicated in pink. Source data are provided as Source data files.
Fig. 3
Fig. 3. Distribution of plasmid fitness effects.
Comparison between plasmid fitness effects obtained in this study and those from previous studies. a Distribution of pOXA-48_K8 fitness effects in the ecologically compatible collection of enterobacteria isolates. Bars indicate the number of E. coli (red) and Klebsiella spp. (blue) strains in each relative fitness category. The grey dotted line indicates the mean relative fitness of the population. Note that relative fitness values are normally distributed (w = 0.971, var = 0.0072, one-sided Shapiro–Wilk normality test, P = 0.14). The inset shows the cumulative distribution function (CDF) of the relative fitness of pOXA-48_K8-carrying E. coli (red), Klebsiella spp. (blue) clones, both individually and combined (black). b Distribution of plasmids fitness effects in bacterial hosts obtained in a previous meta-analysis. Most of the included studies were based on associations between plasmids and bacterial strains from different ecological origins. Bars indicate the number of plasmid–bacterium associations in each relative fitness category. The grey dotted line indicates the mean relative fitness across studies. Relative fitness values are not normally distributed (w = 0.91, var = 0.029; one-sided Shapiro–Wilk normality test, P = 0.0006). The inset shows the CDF of the relative fitness of pOXA-48_K8-carrying enterobacteria analysed in our study (black) and the CDF of the relative fitness of plasmid-carrying bacteria form Vogwill and MacLean meta-analysis (green). Source data are provided as a Source data file.
Fig. 4
Fig. 4. Fitness effects of pOXA-48_K8 across bacterial genome content.
An association was found between pOXA-48_K8 fitness effects and bacterial host genomic content for four K. pneumoniae ST1427 isolates. a Core genome relationships among E. coli (left) and Klebsiella spp. (right). Tree construction is based on polymorphisms in the core genome. The outer circle indicates the relative fitness of pOXA-48-carrying bacterial hosts (see legend for colour code; red indicates fitness costs and green indicates fitness benefits associated with pOXA-48_K8 carriage). Asterisks denote clones with a phylogenetic signal associated with plasmid fitness effects (LIPA, P < 0.05). b Accessory genome relationships among E. coli (left) and Klebsiella spp. (right) isolates. This tree is a gene content tree constructed based on the distance matrix of the accessory gene network of each group. The outermost circle indicates relative fitness as in a. The intermediate circles indicate presence/absence of plasmids belonging to the different plasmid families named in the figure. Note that only two isolates do not carry any plasmids. Asterisks denote clones with a significant phylogenetic signal associating accessory genome composition with pOXA-48 fitness effects (LIPA, P < 0.05).
Fig. 5
Fig. 5. Modelling pOXA-48 fitness effects.
a Distribution of parameter values obtained using Bayesian inference to estimate growth kinetic parameters from OD measurements obtained for each strain in isolation. Diamonds represent Klebsiella spp. strains and circles E. coli clones; filled symbols denote plasmid-bearing strains and empty symbols plasmid-free cells. The ellipses represent standard deviations of best-fit normal distributions (green for plasmid-bearing strains and orange for plasmid-free cells). b Bars represent a distribution of plasmid fitness effects obtained from in silico competition experiments with parameter values determined from experimental growth curves. The solid curve represents the computationally estimated distribution obtained by randomly sampling wild-type and transconjugant parameter distributions obtained using the MCMC algorithm and numerically solving the model to evaluate the relative fitness associated with plasmid carriage. c Fraction of plasmid-bearing cells (after competing against plasmid-free cells) as a function of the rate of horizontal transfer for random plasmid–host associations sampled from the MCMC parameter distribution. The dotted line illustrates the mean of 104 pair-wise competition experiments under the assumption that plasmid-bearing is associated with a constant reduction in fitness in different clones (w = 0.985, var = 0), while the solid line is obtained by considering a wide variability of fitness effects (w = 0.985, var = 0.0070). The arrow denotes the difference in the conjugation threshold that positively selects for plasmids in the population, supporting the tenet that the variability of fitness effects maintains plasmids in the population at lower conjugation rates. d Stability of plasmids as a function of plasmid cost and conjugation rate. Yellow area corresponds to the range of conjugation rates and plasmid costs that positively selects for the plasmid in the population, while red denotes the plasmid is unstable. Solid lines illustrate the critical conjugation rate estimated numerically after performing 103 pair-wise competition experiments under the assumption that plasmid-bearing is associated with different levels of variability of fitness effects (see legend). Note that the increase in plasmid stability associated with the variability of fitness effects is more relevant for plasmids producing low average fitness cost, and becomes negligible for plasmids producing large average fitness cost, which depend more dramatically on a high conjugation rate. Source data are provided as a Source data file.
Fig. 6
Fig. 6. Plasmid peristence in complex communities.
Modelling plasmid persistence in polymicrobial communities, assuming fixed (a, c) or variable (b, d) plasmid fitness effects. a, b Relative fitness histogram obtained by randomly sampling 104 parameter values from the parameter distribution shown in the inset plot (points illustrate the expected values of each distribution and ellipses their standard deviation; green, plasmid-bearing bacteria; orange, plasmid-free bacteria). The green ellipse in b is larger as a consequence of considering that the cost of plasmid-bearing is normally distributed with variance (σ2 = 0.007). As a result, the distribution of plasmid fitness effects also has higher variance, with a considerable fraction of plasmid–host associations producing a benefit to the host. Dotted red lines indicate mean relative fitness of plasmid carrying cells. c, d Colour gradient represents the percentage of cells carrying plasmids at the end of 5000 stochastic simulations; orange indicates a population without plasmids and green a community composed of plasmid-carrying cells. If plasmid-bearing is associated with a fixed fitness cost for all members of the community, plasmid maintenance requires a high conjugation rate. The increased proportion of plasmid-bearing cells in d indicates that a distribution of plasmid fitness effects with high variance reduces the critical conjugation rate needed to maintain plasmids in the population, enabling plasmids to persist at low conjugation rates. e Mean fraction of plasmid-bearing cells as a function of the number of strains in the community with a conjugation rate γ = 1.5 × 10−11. If the plasmid always produces a reduction in host fitness (mean w < 1 and low variance), plasmid frequency decreases as the number of strains in the community increases (green line). In contrast, for higher variance at the same mean w, the fraction of plasmid-bearing cells increases with community complexity (orange line).

References

    1. Lederberg J. Cell genetics and hereditary symbiosis. Physiol. Rev. 1952;32:403–430. doi: 10.1152/physrev.1952.32.4.403. - DOI - PubMed
    1. Frost LS, Leplae R, Summers AO, Toussaint A. Mobile genetic elements: the agents of open source evolution. Nat. Rev. Microbiol. 2005;3:722–732. doi: 10.1038/nrmicro1235. - DOI - PubMed
    1. Partridge, S. R., Kwong, S. M., Firth, N. & Jensen, S. O. Mobile genetic elements associated with antimicrobial resistance. Clin. Microbiol. Rev.31, e00088–17 (2018). - PMC - PubMed
    1. San Millan, A. Evolution of plasmid-mediated antibiotic resistance in the clinical context. Trends Microbiol.26, 978–985 (2018). - PubMed
    1. Bonomo RA, et al. Carbapenemase-producing organisms: a global scourge. Clin. Infect. Dis. 2018;66:1290–1297. doi: 10.1093/cid/cix893. - DOI - PMC - PubMed

Publication types

Substances