. 2021 May 11;12(1):2617.
doi: 10.1038/s41467-021-22918-2.

Expression of FoxP2 in the basal ganglia regulates vocal motor sequences in the adult songbird

Affiliations

Expression of FoxP2 in the basal ganglia regulates vocal motor sequences in the adult songbird

Lei Xiao et al. Nat Commun. .

Abstract

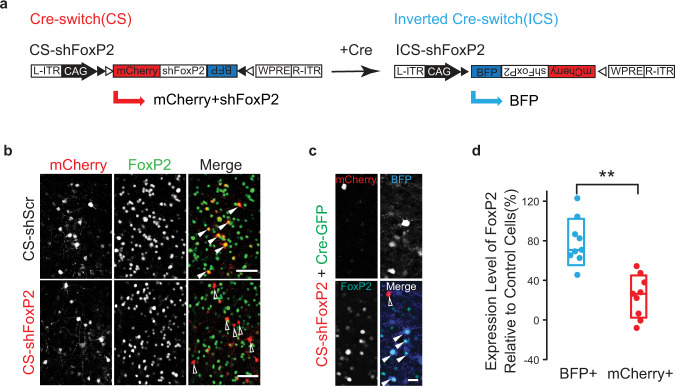
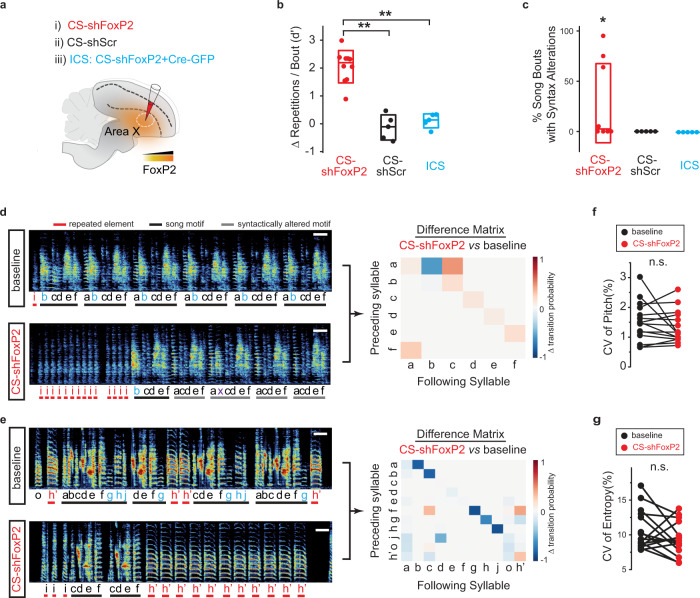
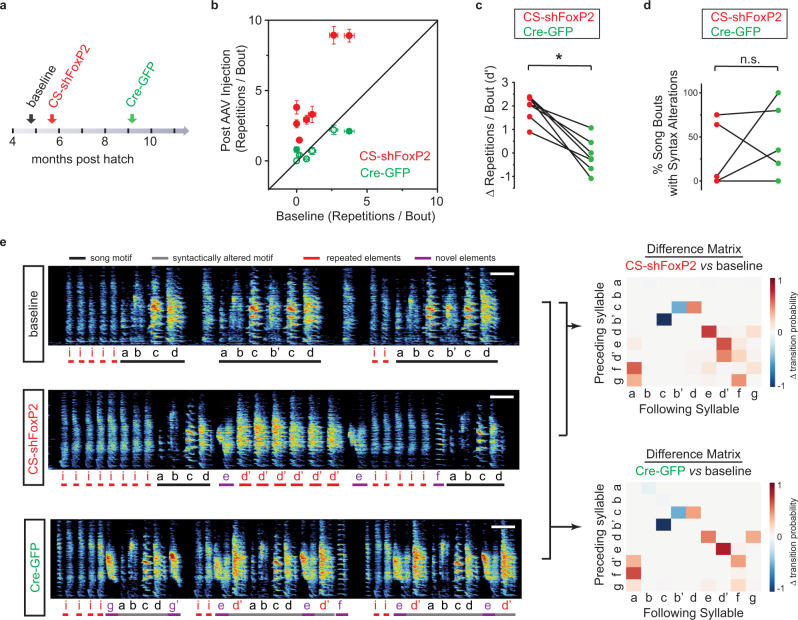
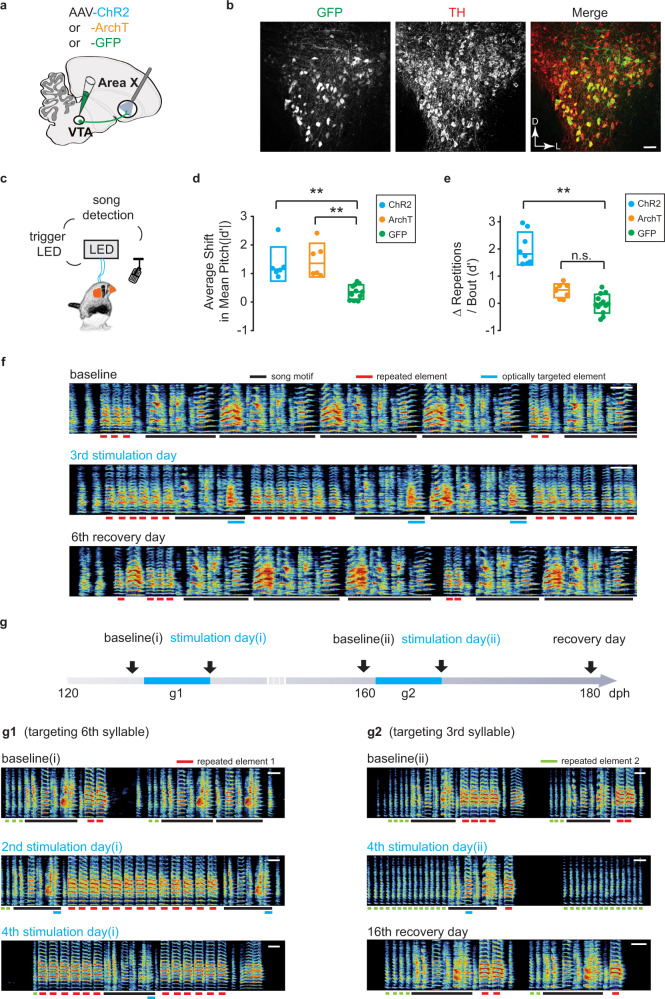
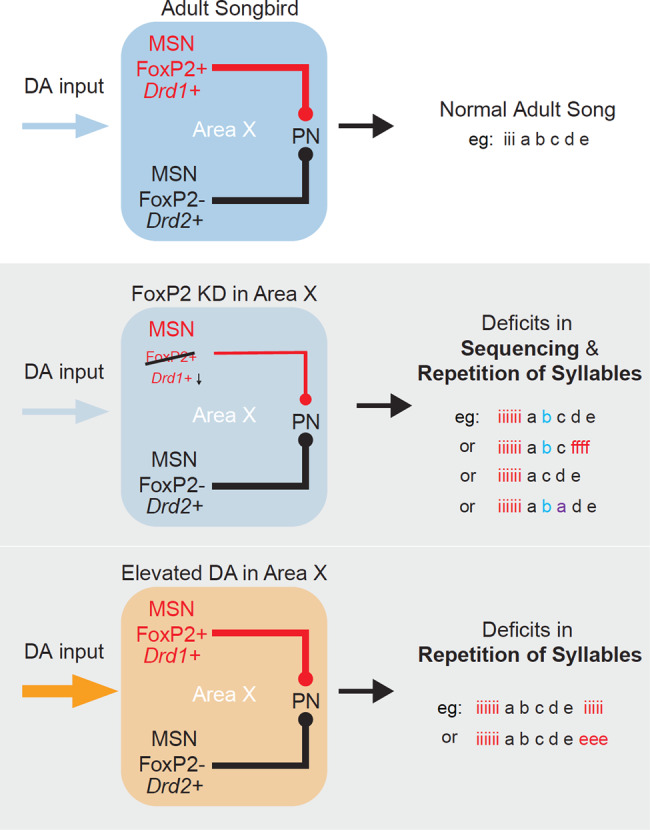
Disruption of the transcription factor FoxP2, which is enriched in the basal ganglia, impairs vocal development in humans and songbirds. The basal ganglia are important for the selection and sequencing of motor actions, but the circuit mechanisms governing accurate sequencing of learned vocalizations are unknown. Here, we show that expression of FoxP2 in the basal ganglia is vital for the fluent initiation and termination of birdsong, as well as the maintenance of song syllable sequencing in adulthood. Knockdown of FoxP2 imbalances dopamine receptor expression across striatal direct-like and indirect-like pathways, suggesting a role of dopaminergic signaling in regulating vocal motor sequencing. Confirming this prediction, we show that phasic dopamine activation, and not inhibition, during singing drives repetition of song syllables, thus also impairing fluent initiation and termination of birdsong. These findings demonstrate discrete circuit origins for the dysfluent repetition of vocal elements in songbirds, with implications for speech disorders.


Conflict of interest statement

The authors declare no competing interests.

Figures

Fig. 1
Fig. 1. A Cre-switch platform for testing the function of FoxP2 in learned vocalizations.
a AAV constructs to achieve Cre-dependent silencing of zebra finch FoxP2. For the Cre-Switch (CS) configuration, the expression of mCherry and shRNAs are only maintained in the absence of Cre, whereas the expression of tagBFP(BFP) is activated in the presence of Cre. WPRE, woodchuck polyresponse element. ITR, inverted terminal repeats. Open and filled triangles indicate loxP and lox2272 sites, respectively. b FoxP2 expression in the cells infected with CS-shScr (top, filled triangles) and CS-shFoxP2 (bottom, open triangles) in Area X of adult birds. mCherry+ cells are cells infected with CS constructs. Scale bar, 50 µm. c Confocal images showing the expression of FoxP2 in mCherry+ (open) and BFP+ (filled) cells within Area X of an adult bird injected with CS-shFoxP2 and Cre-GFP constructs. Scale bar, 20 µm. d Quantification of the expression level of FoxP2 in BFP+ and mCherry+ cells (blue 78 ± 18% vs red 23.7 ± 16.4%[mean ± SEM] relative to control cells) within Area X of adult birds injected with CS-shFoxP2 and Cre-GFP constructs (n = 9 slices from 3 birds). The expression level of FoxP2 in BFP+ cells is significantly higher than in mCherry+ cells (p = 0.0002, Mann–Whitney test). Each point represents the normalized expression level of FoxP2 in BFP+ or mCherry+ cells relative to control cells from individual slices. Box indicates the median ± SD.
Fig. 2
Fig. 2. FoxP2 Knockdown disrupts syllable sequencing and repetition in adulthood.
a CS constructs were bilaterally injected into Area X of adult birds, alone (i, CS-shFoxP2; ii, CS-shScr) or with Cre-GFP (iii, CS-shFoxP2/Cre-GFP, termed Inverted Cre-Switch (ICS)). b Changes in the number of vocal repeats per song bout for CS-shFoxP2+ birds (d′ = 2.05 ± 0.41[mean ± SEM], n = 8 birds), CS-shScr+ birds (d′ = −0.13 ± 0.56[mean ± SEM], n = 5 birds), and ICS+ birds (blue circles, d′ = 0.11 ± 0.31[mean ± SEM], n = 5 birds). Repetition changes in CS-ShFoxP2+ birds were significantly greater than CS-shScr+ and ICS+ birds (2 months post injection vs baseline, CS-shScr, p = 0.0023; ICS, p = 0.015, Kruskal–Wallis test). Box indicates the median ± SD. c % syntax alterations for CS-shFoxP2+ birds (n = 8 birds), CS-shScr+ birds (n = 5 birds), and ICS+ birds (n = 5 birds) 2 months post injection. Syntax alterations was significantly greater than zero in CS-ShFoxP2+ birds (p = 0.02, one tailed one sample t test). Box indicates the median ± SD. d Left panel: song recorded at baseline and 2 months after bilateral injection of CS-shFoxP2 in Area X of an adult bird. The number of repetitions of introductory elements ‘i’ (red) in each song bout were increased and syllable ‘b’ (blue) was omitted in a subset of motifs. Each letter indicates an individual syllable. Scale bar, 200 ms. Right panel: difference transition matrices. Subtracting the syllable transition matrix at 2 months following CS-shFoxP2 injection from the matrix at baseline reveals changes in the syllable transitions following FoxP2 knockdown. e Left panel: song recorded from a second bird at baseline and 2 months after bilateral injection of CS-shFoxP2 in Area X. The number of repetitions of syllable ‘h” (red) increased and other vocal elements (syllables ‘g’, ‘h’, and ‘j’, blue) were omitted. Syllable ‘h” is considered a variant of syllable ‘h’. Scale bar, 200 ms. Right panel: difference transition matrices. f Variability of syllable pitch at baseline (CV = 1.52 ± 0.17%[mean ± SEM]) and two months post injection of CS-shFoxP2+ birds (CV = 1.34 ± 0.14%[mean ± SEM]; p = 0.75, n = 15, Wilcoxon signed-rank test). g Variability of syllable entropy at baseline (CV = 10.7 ± 0. 75%[mean ± SEM]) and two months post injection of CS-shFoxP2(CV = 9.46 ± 0.62%[mean ± SEM]; p = 0.17, n = 15, Wilcoxon signed-rank test).
Fig. 3
Fig. 3. Reversal of FoxP2 knockdown in adult zebra finches rescues vocal repetitions but not disruptions in song syntax.
a Strategy for FoxP2 rescue in Area X. b Comparison of the number of syllable repetitions per song bout (mean ± SEM) at baseline versus 2 months after injection of CS-shFoxP2 or Cre-GFP (n = 5 birds). Red filled circles represent vocal elements with significant differences between baseline and post CS-shFoxP2 injection (p < 0.0001 and p = 0.012, Kruskal–Wallis test); green open circles, vocal elements with nonsignificant differences (p > 0.2, Kruskal–Wallis test); green filled circles, vocal elements with significant differences (p = 0.014 and p = 0.027, Kruskal–Wallis test) between baseline and post Cre-GFP injection. The number of syllable repetitions after Cre-GFP injection was significantly lower than the number of repetitions of the same syllables after CS-shFoxP2 injection (p = 0.016, n = 7, Wilcoxon signed-rank test). c Changes in the number of repeats per song bout, expressed in units of d’, for CS-shFoxP2+ birds (n = 5 birds) 2 months following CS-shFxoP2 injection (d′ = 1.94 ± 0.21[mean ± SEM]) and 3 months following Cre-GFP injection (d′ = −0.011 ± 0.27[mean ± SEM]). Changes in the number of repetitions relative to baseline were significantly decreased following Cre-GFP injection (p = 0.016, Wilcoxon signed-rank test). d % syntax alterations for CS-shFoxP2+ birds (n = 5 birds) 2 months following CS-shFxoP2 injection and 3 months following Cre-GFP injection. Changes were significantly greater than zero following Cre-GFP injection (p = 0.033) but not following CS-shFoxP2 injection (p = 0.084, one tailed one sample t-test). The frequencies of syntax alterations were not significantly changed following Cre-GFP injection (p > 0.99, Wilcoxon signed-rank test). e Left panel: spectrograms of song from one bird at baseline, 4 months after CS-shFoxP2 injection, and 3 months after Cre-GFP injection. The number of repetitions of introductory elements ‘i’ and syllable ‘d”(red) gradually increased and novel vocal elements (syllables ‘e’, ‘g’, ‘g”) emerged. Each letter indicates an individual syllable. Syllables ‘b”, ‘d” and ‘g” are variants of syllables ‘b’, ‘d’, and ‘g’, respectively. Scale bar, 200 ms. Right panel: difference transition matrices. Subtracting the syllable transition matrix at 4 months following CS-shFoxP2 injection (top) or at 3 months following Cre-GFP injection (bottom) from the matrix at baseline reveals changes in the syllable transitions during reversible knockdown of FoxP2.
Fig. 4
Fig. 4. Overview of cell types in Area X.
a UMAP projections of nuclei from Area X (left, shScr subset, n = 14,289; middle, shFoxP2 subset, n = 12,956; right, combined analysis, n = 27,245). Clusters are numbered in ascending order by decreasing size (1-largest; 23-smallest). b Cluster composition by each dataset (shScr or shFoxP2). c Hierarchical clustering and cell type gene marker expression of an independent analysis of the shScr group. For marker gene expression, the size of the dot indicates the percent of nuclei within a cluster expressing a given gene, and the color of the dot indicates the average normalized expression level. d Overall cell type composition in Area X of the shScr group.
Fig. 5
Fig. 5. Patterns of FoxP2 and dopamine receptor expression in Area X.
a UMAP projection of MSN clusters. Nuclei are colored based on Foxp2 expression: FoxP2+ (orange) or FoxP2− (gray). Percentages are rounded and reflect a proportion of the total number of MSNs. b UMAP projection of MSN clusters. Nuclei are colored based on the exclusive expression of Drd1/5 (blue), Drd2 (red), both (green), or neither (gray). Percentages are rounded and reflect a proportion of the total number of MSNs. c UMAP projection of MSN clusters. Nuclei are colored based on the exclusive expression of Drd1/5 (blue), Drd2 (red), FoxP2 (orange), any dopamine receptor and FoxP2 (green), or none (gray). Percentages are rounded and reflect a proportion of the total number of MSNs. d A stacked bar plot illustrating the percentage of nuclei expressing FoxP2, classified by dopamine receptor expression. e A scatter plot showing the differential expression of genes that distinguish nuclei grouped into a putative direct-like pathway (clusters 1 and 5) and indirect-like pathway (clusters 2, 3, and 4). Blue indicates direct-like pathway genes with p < 0.001, red indicates indirect-like pathway genes with p < 0.001, and gray indicates genes with p ≥ 0.001. f A hypothesized model for the circuitry of MSNs in Area X based on these data.
Fig. 6
Fig. 6. Altered expression of dopamine receptors resulting from FoxP2 knockdown.
a A scatterplot illustrating the correlation between normalized expression of Drd1 and Drd2 in FoxP2+ striatal cells that are also Drd1+ or Drd2+. Each point represents a nucleus. Diagonal line indicates the line of equality. Cells above the line have a ratio of Drd2/Drd1 greater than 1. Cells below the line have a ratio of Drd2/Drd1 below 1. b Distribution and boxplots of normalized expression for Drd1, Drd5, and Drd2 in FoxP2+ MSNs in CS-shScr+ and CS-shFoxP2+ birds. Cells are grouped by the expression of dopamine receptors, e.g., D1+ indicates the cells express Drd1 only and no other dopamine receptor, whereas D1+/D5+ indicates the cells express both Drd1 and Drd5. The expression level of Drd1 in cells from CS-shFoxP2+ birds was significantly lower than in CS-shScr+ birds (p < 0.001, Welch’s t-test) in all Drd1+ cells, as indicated by the leftward shift of the distribution of normalized expression in the CS-shScr+ population. The expression of Drd2 in FoxP2+ MSNs did not differ between the two groups, as no shift in the distribution of normalized expression is seen between the populations. The lower and upper bounds of the boxes indicate the 25th and 75th percentiles; the whiskers extend in either direction from the bound to the furthest value within 1.5 times the interquartile range.
Fig. 7
Fig. 7. Song contingent excitation of dopamine terminals in Area X induces dysfluent repetition of song syllables.
a Schematic of experimental design for optogenetic manipulation of dopamine release from VTA terminals in Area X. b Representative coronal section through VTA showing that most neurons infected with optogenetic constructs are TH-positive and located in the ventral and ventrolateral portions of VTA. Scale bar, 50 µm. c Schematic of closed-loop optogenetic experimental paradigm. d Average shift in mean pitch, expressed in units of |d′|, for ChR2+ birds (|d′| = 1.33 ± 0.6[mean ± SEM], n = 6 birds), ArchT+ birds (|d′| = 1.47 ± 0.59[mean ± SEM], n = 6 birds), and GFP+ birds (|d′| = 0.35 ± 0.077[mean ± SEM], n = 6 birds). Average shift in mean pitch for both ChR2+ and ArchT+ birds were higher than 0.75, and also significantly higher than control GFP+ birds (ChR2+, p = 0.0025; ArchT+, p = 0.0025; Kruskal–Wallis test). Box indicates the median ± SD. e Changes in the number of repetitions of vocal element per song bout between the baseline day and last illumination day, expressed in units of d’, for ChR2+ birds (d′ = 2.02 ± 0.5[mean ± SEM], n = 6 birds), ArchT+ birds (d′ = 0.46 ± 0.21[mean ± SEM], n = 6 birds), and GFP+ birds (d′ = −0.015 ± 0.2[mean ± SEM], n = 4 birds). Change in the number of repetitions of vocal elements in ChR2+ birds were significantly greater than change in GFP+ birds (p < 0.0001, Kruskal–Wallis test), but there was no significant difference between ArchT+ and GFP+ birds (p = 0.12, Kruskal–Wallis test). Box indicates the median ± SD. f Spectrograms of song recorded from a ChR2+ bird at baseline, 3rd stimulation day and 6th recovery day. Light pulses (~455 nm, 100 ms) were delivered over the target syllable during lower pitch variants but not during higher pitch variants. g Schematic of the experiment in a ChR2+ bird in which light pulses (~455 nm, 100 ms) were delivered over two different target syllables at different times over the course of 2 months. The bird starts repeating a song element either at the end of its motif (g1) or the beginning of its motif (g2) or both (g1 bottom), depending on which syllable in the song was optogenetically targeted. Scale bar, 200 ms.
Fig. 8
Fig. 8. Optical stimulation causes vocal repetitions independent of changes in pitch.
a Comparison of the number of repetitions of vocal element per song bout (mean ± SEM) for the baseline day versus last stimulation day in 6 ChR2+ birds (filled, p < 0.0001, Kruskal–Wallis test) or last recovery day (open, p > 0.35, Kruskal–Wallis test, n = 8 vocal elements). The number of repetitions of vocal elements on the last stimulation day was significantly higher than the number of repetitions on either the baseline day or the last recovery day (p = 0.0081, Friedman test), with no significant difference between the baseline day and the last recovery day (p > 0.99, Friedman test). b Comparison of the number of repetitions of vocal element per song bout (mean ± SEM) on the baseline day versus last inhibition day in 6 ArchT+ birds (5 filled circles, p > 0.08; 1 filled with black outline, p = 0.028, Kruskal–Wallis test, n = 8 syllables). c Same as b, but for GFP+ birds (blue outline, p > 0.8, Kruskal–Wallis test, n = 6 syllables from 3 birds; orange outline, p > 0.15, Kruskal–Wallis test, n = 7 syllables from 3 birds). Blue and orange outlines indicate birds illuminated by LED with wavelength of ~455 nm or 520 nm, respectively. d The number of syllable repetitions per song bout (top, mean ± 95% confidence interval[CI]) for the bird shown in Fig. 7f and changes of the mean pitch of the optically targeted syllable(bottom, mean ± 95% CI)(blue line in Fig. 7f) during baseline (black circles, days −1 and 0), stimulation (filled blue circles, days 1–3), and recovery (open blue circles, days 4–9). The number of repetitions of the affected syllable (red line in Fig. 7f) per song bout was significantly increased during days 1–6 relative to baseline (p < 0.01, Kruskal–Wallis test), whereas changes in the mean pitch of the target syllable during days 1–9 were significantly higher than changes at baseline (p < 0.01, Kruskal–Wallis test). e same as d, but for another bird. The number of repetitions of the affected syllable per song bout was significantly increased during days 2–8 relative to baseline (p < 0.01, Kruskal–Wallis test), whereas changes in the mean pitch of the target syllable during days 1–5 were significantly higher than changes at baseline (p < 0.01, Kruskal–Wallis test).
Fig. 9
Fig. 9. Hypothetical role of Area X in adult vocalization.
Coordinated activity between direct- and indirect-like pathways, as well as appropriate dopaminergic (DA) input into Area X, is needed for the production of normal adult song. Reduced FoxP2 expression in Area X may cause an imbalance in activity between the direct- and indirect-like pathways and result in deficits in song sequencing and the repetition of syllables. Similarly, elevated DA input into Area X may introduce the repetition of syllables at the onset or offset of song.

Similar articles

Cited by

References

    1. Ackermann H, Hage SR, Ziegler W. Brain mechanisms of acoustic communication in humans and nonhuman primates: an evolutionary perspective. Behav. Brain Sci. 2014;37:529–546. doi: 10.1017/S0140525X13003099. - DOI - PubMed
    1. Konopka G, Roberts TF. Insights into the neural and genetic basis of vocal communication. Cell. 2016;164:1269–1276. doi: 10.1016/j.cell.2016.02.039. - DOI - PMC - PubMed
    1. Watkins K. Developmental disorders of speech and language: from genes to brain structure and function. Prog. Brain Res. 2011;189:225–238. doi: 10.1016/B978-0-444-53884-0.00027-0. - DOI - PubMed
    1. Lai CS, Gerrelli D, Monaco AP, Fisher SE, Copp AJ. FOXP2 expression during brain development coincides with adult sites of pathology in a severe speech and language disorder. Brain. 2003;126:2455–2462. doi: 10.1093/brain/awg247. - DOI - PubMed
    1. Teramitsu I, Kudo LC, London SE, Geschwind DH, White SA. Parallel FoxP1 and FoxP2 expression in songbird and human brain predicts functional interaction. J. Neurosci. 2004;24:3152–3163. doi: 10.1523/JNEUROSCI.5589-03.2004. - DOI - PMC - PubMed

Publication types

MeSH terms