. 2021 May 11;12(1):2622.
doi: 10.1038/s41467-021-22925-3.

Peripheral-specific Y1 receptor antagonism increases thermogenesis and protects against diet-induced obesity

Affiliations

Peripheral-specific Y1 receptor antagonism increases thermogenesis and protects against diet-induced obesity

Chenxu Yan et al. Nat Commun. .

Abstract

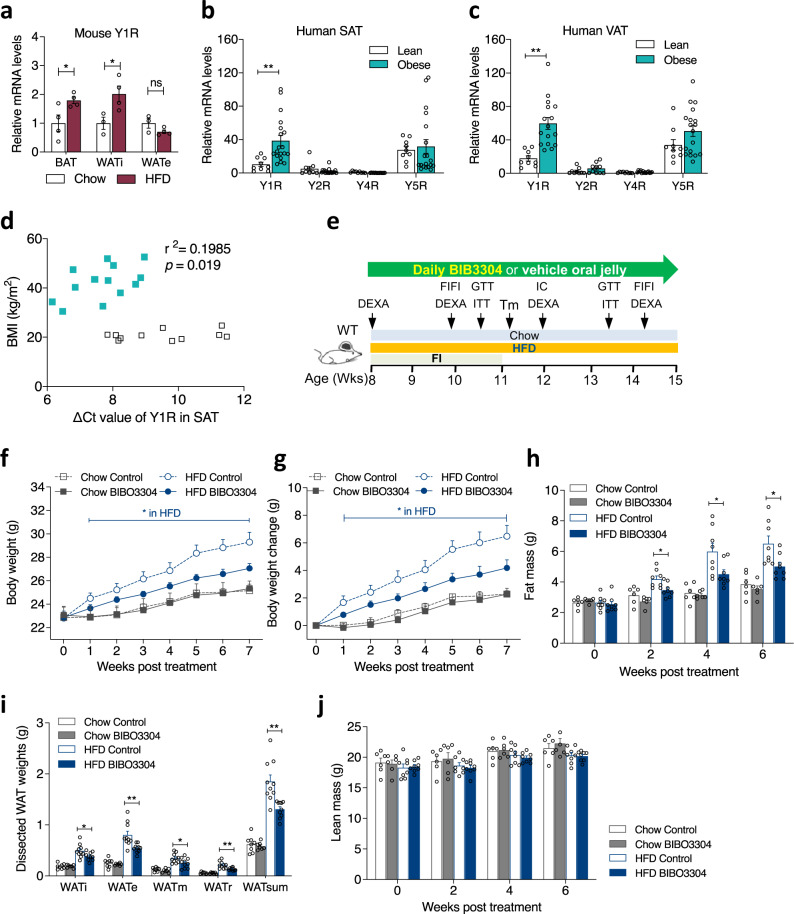
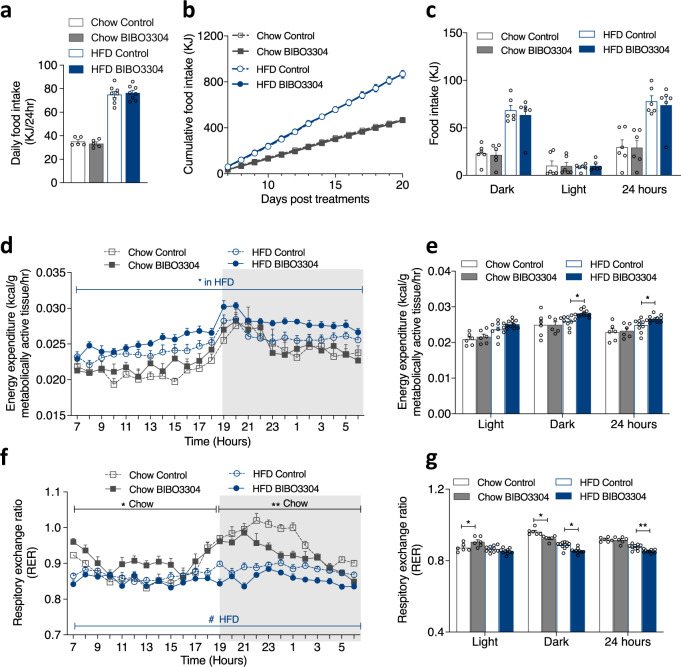
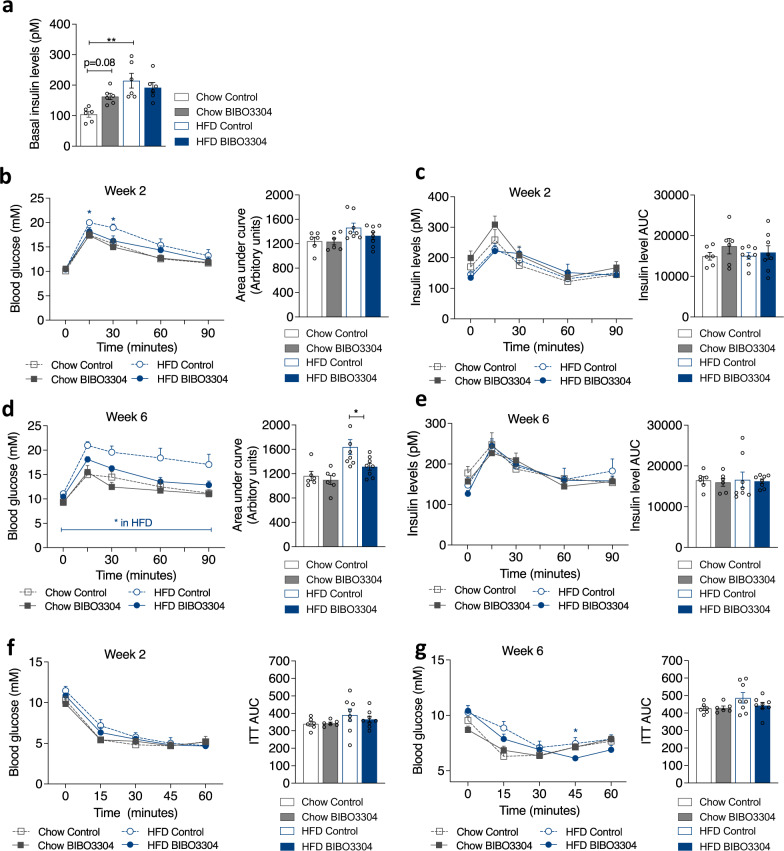
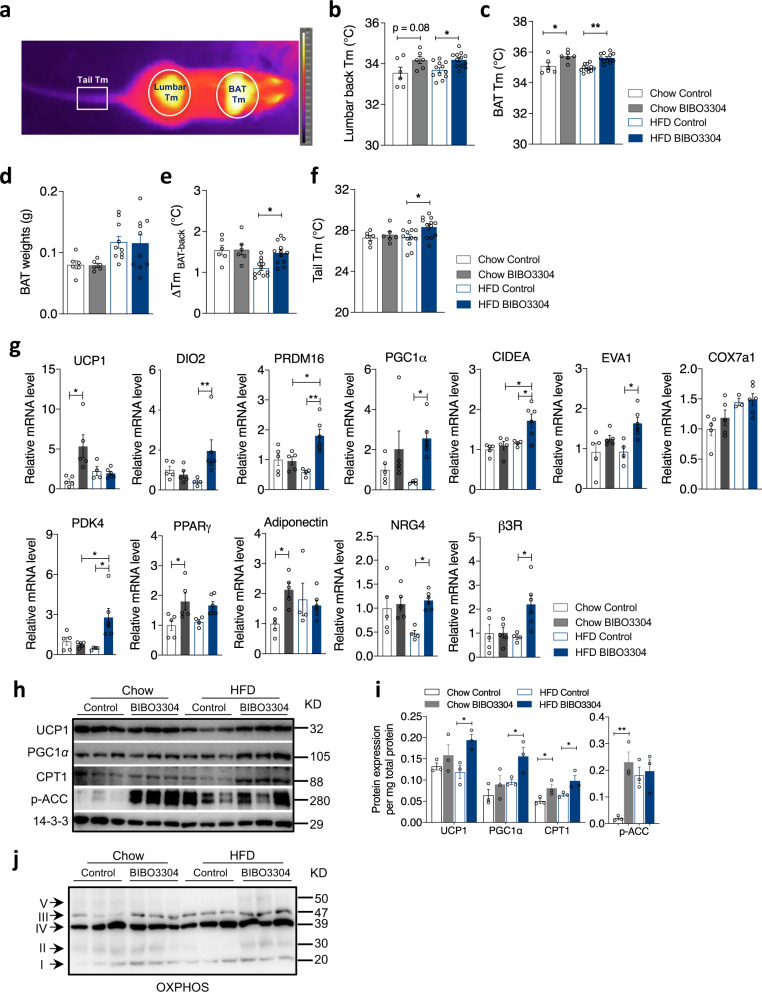
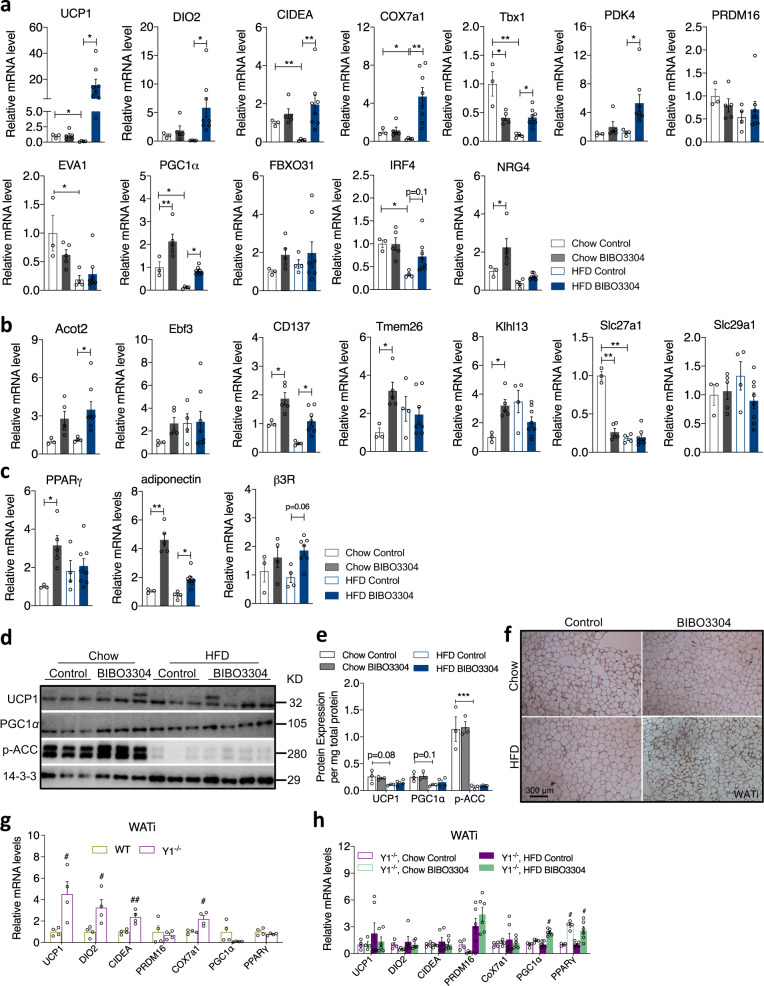
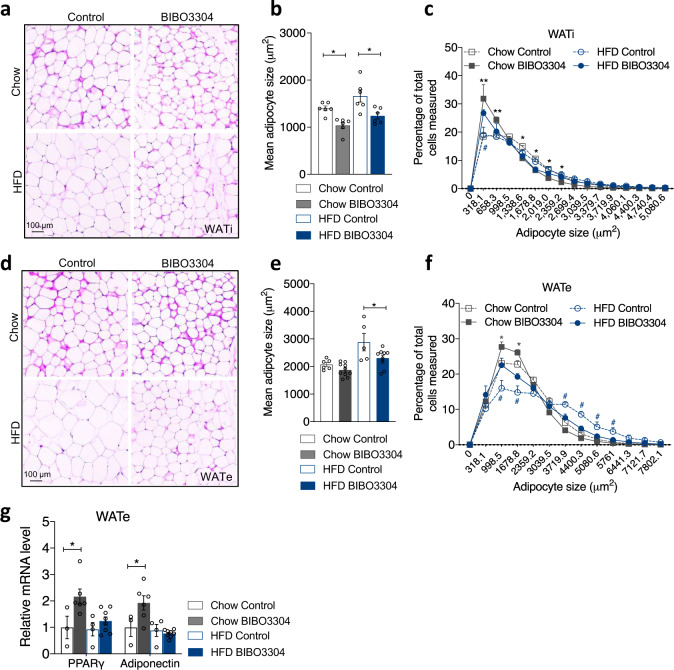
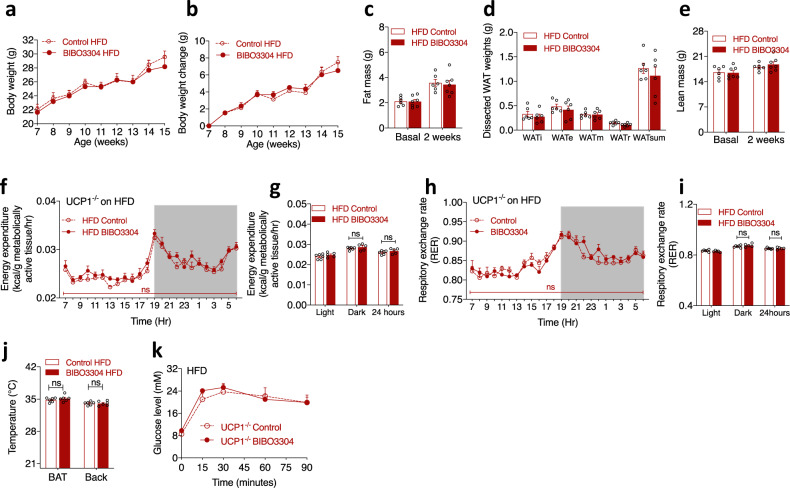
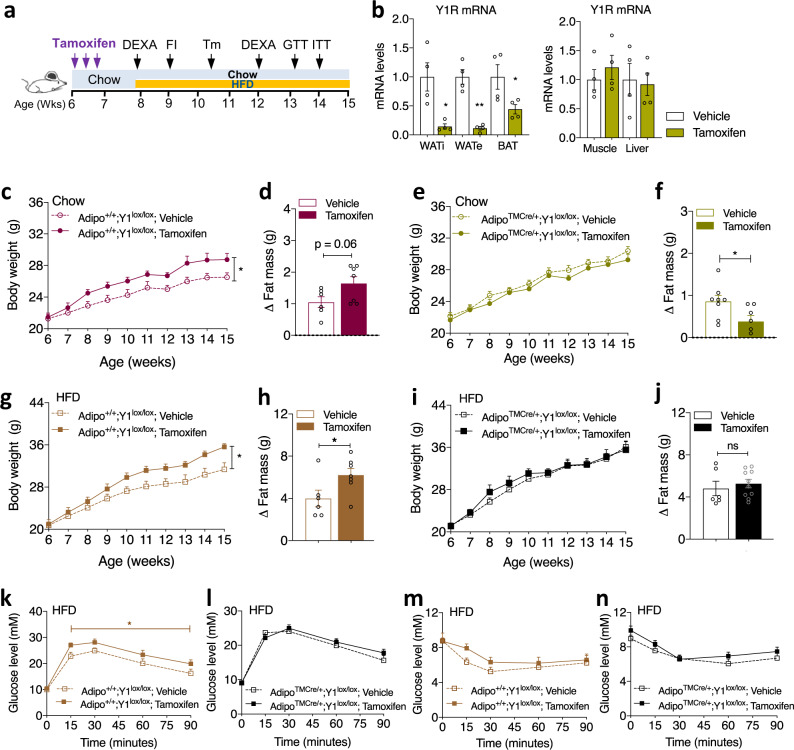
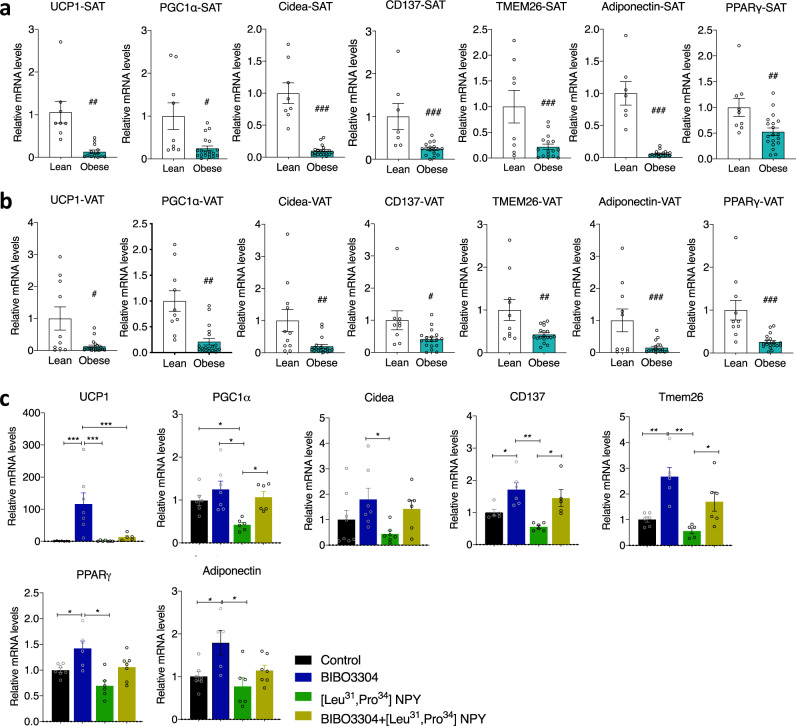
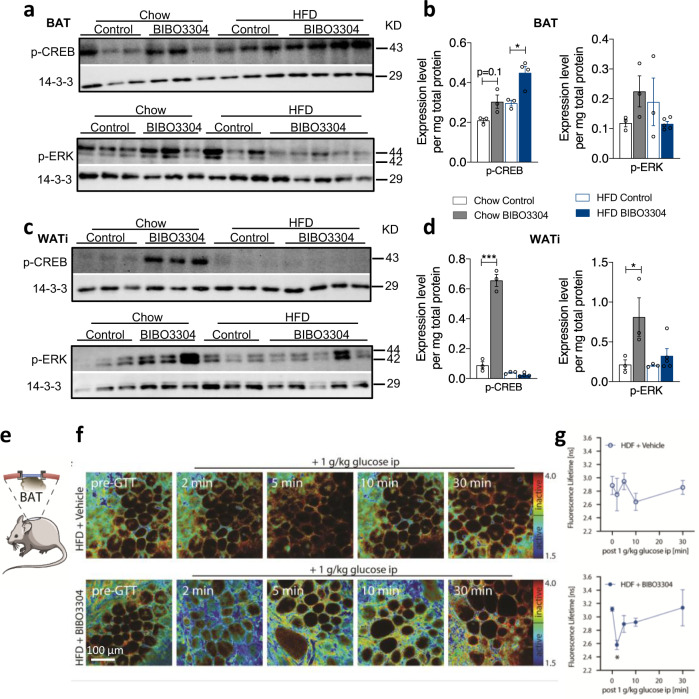
Obesity is caused by an imbalance between food intake and energy expenditure (EE). Here we identify a conserved pathway that links signalling through peripheral Y1 receptors (Y1R) to the control of EE. Selective antagonism of peripheral Y1R, via the non-brain penetrable antagonist BIBO3304, leads to a significant reduction in body weight gain due to enhanced EE thereby reducing fat mass. Specifically thermogenesis in brown adipose tissue (BAT) due to elevated UCP1 is enhanced accompanied by extensive browning of white adipose tissue both in mice and humans. Importantly, selective ablation of Y1R from adipocytes protects against diet-induced obesity. Furthermore, peripheral specific Y1R antagonism also improves glucose homeostasis mainly driven by dynamic changes in Akt activity in BAT. Together, these data suggest that selective peripheral only Y1R antagonism via BIBO3304, or a functional analogue, could be developed as a safer and more effective treatment option to mitigate diet-induced obesity.


Conflict of interest statement

The authors declare no competing interests.

Figures

Fig. 1
Fig. 1. Y1R mRNA expression in mice and human adipose tissue as well as effect of peripheral Y1R antagonism on body weight and body composition in wild-type mice.
a Y1R mRNA expression in brown adipose tissue (BAT, n = 4 per group), inguinal white adipose tissue (WATi, chow n = 3, HFD n = 4) and epidydimal WAT (WATe, chow n = 3, HFD n = 4) in wild-type mice fed with a standard chow (white bar) or 7-week high fat diet (HFD, magenta bar). Data are mean ± s.e.m. *p < 0.05 by two-tailed t test compared to the same adipose depot of chow-fed mice. ns non-significance. b, c Y-receptor mRNA expression profiles in subcutaneous white adipose tissue (SAT) and visceral white adipose tissue (VAT) from lean (n = 9, white bars) and obese (n = 19, cyan bars) non-diabetic human subjects relative to Y4R expression of lean subjects. Data are mean ± s.e.m. **p < 0.01 by two-tailed t test compared to lean subjects. d Correlation between body mass index (BMI, kg/m2) and ∆Ct values of Y1R mRNA expression in SAT of obese (cyan filled square, n = 16) and lean (open square, n = 11) individuals. Data are mean ± s.e.m. p values by two-tailed Pearson Correlation analysis. e Schematic illustration of phenotypic paradigm. WT wild type, DEXA Dual-energy X-ray absorptiometry, FI food intake, FIFI fasting-induced food intake, Tm temperature measurement by thermal camera, IC indirect calorimetry by Promethion (Sable Systems), GTT glucose tolerance test, ITT insulin tolerance test. f, g Absolute body weight and the change of body weight of wild-type mice on a chow or a HFD treated daily with a jelly containing either vehicle or Y1R-specific antagonist BIBO3304 for 7 weeks. Data are mean ± s.e.m. Chow n = 6 (grey, control: open circle; BIBO3304: filled circle), HFD control n = 10 (blue, open square), BIBO3304 n = 11 (filled square). *p < 0.05, two-way repeated measures ANOVA. h Whole-body fat mass of wild-type mice determined by DEXA at baseline, 2, 4 and 6 weeks after daily administration with control jelly or BIBO3304 jelly. Data are mean ± s.e.m. Chow n = 6 (control: open grey bar; BIBO3304: grey bar), HFD n = 8 (control: open blue bar; BIBO3304: blue bar). *p < 0.05: one-way ANOVA with Tukey’s multiple comparisons test. i Dissected weights of individual WAT from inguinal (WATi), epididymal (WATe), mesenteric (WATm), retroperitoneal (WATr) and total weights of these 4 depots (WATsum) at cull. Data are mean ± s.e.m. Chow n = 7–8 (grey), HFD n = 10 (blue). *p < 0.05, **p < 0.01: one-way ANOVA with Tukey’s multiple comparisons test. j Whole-body lean mass determined by DEXA. Data are mean ± s.e.m, Chow n = 6 (control: open grey bar; BIBO3304: grey bar), HFD n = 8 (control: open blue bar; BIBO3304: blue bar), p values by one-way ANOVA with Tukey’s multiple comparisons test. Source data are provided as a Source Data file.
Fig. 2
Fig. 2. Effect of peripheral Y1R antagonism on food intake and energy expenditure in wild-type mice.
a Spontaneous daily food intake over first 3 days of wild-type mice treated daily with a jelly containing either vehicle or BIBO3304 on a chow or a HFD at 8 weeks of age, Data are mean ± s.e.m, Chow n = 5 (control: open grey bar; BIBO3304: grey bar), HFD n = 8 (control: open blue bar; BIBO3304: blue bar). p values by one-way ANOVA. b Cumulative food intake of chow- and HFD-fed wild-type mice treated daily with a jelly containing either vehicle or BIBO3304 from day 6 to day 20 post treatment. Data are mean ± s.e.m, Chow n = 5 (grey, control: open square; BIBO3304: filled square), HFD n = 8 (blue, control: open circle; BIBO3304: filled circle). p values by two-way repeated measures ANOVA. c Food intake during the dark phase, light phase and over 24 h period of chow- and HFD-fed wild-type mice treated daily with a jelly containing either vehicle or BIBO3304 at 8–9 weeks of age. Data are mean ± s.e.m, n = 6 per group. p values by one-way ANOVA. d Energy expenditure (normalized to metabolically active tissues) over a 24-h course, with e showing average energy expenditure during the light phase, dark phase and over a 24-h period from (d). f Respiratory exchange ratio (RER) over a 24-h period, with (g) showing RER during the light phase, dark phase and over a 24-h period from (f). Data (d, e, f, g) are mean ± s.e.m. Chow n = 6, HFD n = 10, *p < 0.05, **p < 0.01 vs control in the same diet, one-way ANOVA with Tukey’s multiple comparisons test. Source data are provided as a Source Data file.
Fig. 3
Fig. 3. Effect of peripheral Y1R antagonism on glucose homeostasis.
a Blood insulin levels under fed condition in chow- or HFD-fed wild-type mice given either a chow or a HFD at 13–14 weeks of age. Data are mean ± s.e.m, n = 6 per group (chow, control: open grey bar; BIBO3304: grey bar. HFD, control: open blue bar; BIBO3304: filled blue bar). *p < 0.05, **p < 0.01, one-way ANOVA with Tukey’s multiple comparisons test. Glucose levels in intraperitoneal glucose tolerance tests (GTT) in chow- or HFD-fed wild type mice after 2 (b) and 6 weeks (d) daily treatment with vehicle or BIBO3304, and corresponding area under the curve (AUC) analysis of glucose over time in these mice. c, e, Insulin levels throughout the GTTs 2 and 6 weeks post treatments in (b, d) and corresponding AUC analysis for these mice. f, g, Glucose levels in an insulin tolerance test (ITT) conducted after 2 and 6 weeks daily treatment with either vehicle or BIBO3304, and corresponding AUC analysis for the mice in (f, g). Data are mean ± s.e.m, chow n = 6 (control: open grey; BIBO3304: grey), HFD n = 8 (control: open blue; BIBO3304: blue), *p < 0.05, two-way repeated measures ANOVA with Sidak’s multiple comparisons test. Source data are provided as a Source Data file.
Fig. 4
Fig. 4. Peripheral Y1R antagonism increases thermogenesis and promotes the activity of brown adipose tissue.
a Representative infra-red thermal image of the brown adipose tissue (BAT), lumbar back and tail regions of a mouse in this study. Tm Temperature. b Temperature measured by a highly sensitive infra-red camera of lumbar back regions of chow- and HFD-fed mice given vehicle or BIBO3304 jelly at 11 weeks of age. c Intrascapular BAT temperature measured by infra-red camera from the same set of mice. Data (b, c) are mean ± s.e.m, chow n = 6 (control: open grey; BIBO3304: grey), HFD n = 12 (control: open blue; BIBO3304: blue), *p < 0.05, **p < 0.01, one-way ANOVA with Tukey’s multiple comparisons test. d Dissected BAT weights of vehicle- and BIBO3304-treated mice on a chow or a HFD for 7 weeks at cull. Data are mean ± s.e.m, chow n = 6, HFD n = 10, p value by one-way ANOVA with Tukey’s multiple comparisons test. e The temperature differences between the interscapular and lumbar regions in mice administrated with a jelly containing either vehicle or BIBO3304. f Tail temperature measured by a thermal camera in the same cohorts of mice. Data (e, f) are mean ± s.e.m, chow n = 6, HFD n = 12, *p < 0.05, **p < 0.01, one-way ANOVA with Tukey’s multiple comparisons test. g mRNA levels of thermogenic and lipogenic markers in intrascapular BAT of chow- and HFD-fed wild-type mice on a daily administration with either control or BIBO3304 jelly. Data are mean ± s.e.m, chow n = 5 (control: open grey; BIBO3304:grey). HFD control n = 4 (open blue), HFD BIBO3304 n = 6 (blue). *p < 0.05, **p < 0.01, two-way ANOVA with Sidak’s multiple comparisons test. h Western blot images of UCP1, PGC1α, CPT1 and p-ACC protein levels in BAT of vehicle- or BIBO3304-treated mice. p phosphorylated. 14-3-3 was used as a loading control. Images are representative of 3 independent experiments. KD kilodalton. i Quantification of the protein levels normalized to total protein content in BAT or WATi. Data are mean ± s.e.m, n = 3 per group (chow, control: open grey; BIBO3304: grey. HFD, control: open blue; BIBO3304: blue), *p < 0.05, **p < 0.01, one-way ANOVA with Tukey’s multiple comparisons test. j Representative western blotting image of protein levels of 5 OXPHOS complexes in mitochondrial respiration in mice on a chow or a HFD treated with vehicle or BIBO3304. n = 3 per group. Source data are provided as a Source Data file.
Fig. 5
Fig. 5. Peripheral Y1R antagonism induces browning of white adipose tissue.
a The mRNA levels of thermogenic and lipogenic markers in inguinal WAT (WATi) of chow- and HFD-fed wild-type mice on a daily administration with a jelly containing a vehicle or BIBO3304. b mRNA levels of beige adipocyte-related genes in WATi. c mRNA expression of PPARγ, adiponectin, and β3R in WATi of chow- and HFD-fed wild-type mice on a daily administration with a jelly containing vehicle or BIBO3304. Data (a, b, c) are mean ± s.e.m, n = 3 in chow control (open grey), and 5 in chow BIBO3304 (grey); n = 4 in HFD control (open blue), and 8 in HFD BIBO3304 (blue). *p < 0.05, **p < 0.01, two-way ANOVA with Sidak’s multiple comparisons test. d Western blot analyses of UCP1, PGC1α and p-ACC protein levels in the WATi of vehicle- or BIBO3304-treated mice. 14-3-3 was used as a loading control. Images are representative of three independent experiments. KD kilodalton. e Quantification of the protein levels normalized to total protein content in BAT or WATi. Data are mean ± s.e.m, n = 3 in chow (control: open grey; BIBO3304: grey) or 4 in HFD (control: open blue; BIBO3304: blue). ***p < 0.001, two-way ANOVA with Sidak’s multiple comparisons test. f Representative immunohistochemical images of UCP1 protein expression in WATi of wild-type mice on either vehicle or BIBO3304 jellies for 7 weeks. n = 3 per group. g The mRNA levels of thermogenic and adipogenic markers in inguinal WAT (WATi) of Y1R−/− mice compared to wild type mice. Data are mean ± s.e.m, n = 4 per group (WT: mustard; Y1R−/−: purple). #p < 0.05, ##p < 0.01, Y1R−/− versus wild type determined by two-tailed t test. h The mRNA levels of thermogenic genes in WATi of chow- and HFD-fed Y1R−/− mice given either vehicle jelly or BIBO3304 jelly daily for 7 weeks. Data are mean ± s.e.m, chow n = 4 (control: open purple; BIBO3304: open green), HFD n = 6 (control: purple; BIBO3304: green). #p < 0.05, ##p < 0.01, two-way ANOVA with Sidak’s multiple comparisons test. Source data are provided as a Source Data file.
Fig. 6
Fig. 6. Effects of peripheral Y1R antagonism on adipocyte size and distribution.
a d H&E staining of WATi and WATe of vehicle- and BIBO3304-treated wild-type mice on either a chow or a HFD. Images are representative of three independent experiments. b, e Average adipocyte size of WATi and WATe in BIBO3304-treated mice relative to that in vehicle-treated mice. Data are mean ± s.e.m, n = 4 per group (chow, control: open grey; BIBO3304: grey. HFD control: open blue; BIBO3304: blue). *p < 0.05, one-way ANOVA with Tukey’s multiple comparisons test. c, f The frequency distribution of adipocyte size in WATi and WATe from vehicle- and BIBO3304-treated mice on a chow or a HFD. Data are mean ± s.e.m, n = 6 per group (chow, grey; HFD, blue. control: open square; BIBO3304: filled square). *p < 0.05, **p < 0.01 BIBO3304 vs control in chow; #p < 0.05 BIBO3304 vs control in HFD, two-way repeated measures ANOVA. g The mRNA levels of adipogenic markers in epididymal WAT (WATe) of chow- or HFD-fed wild-type mice treated with vehicle or BIBO3304 jellies. Data are mean ± s.e.m, chow: control n = 3 (open grey), BIBO3304 n = 6 (grey); HFD: control n = 4 (open blue), BIBO3304 n = 8 (blue). *p < 0.05, two-way ANOVA with Sidak’s multiple comparisons test. Source data are provided as a Source Data file.
Fig. 7
Fig. 7. UCP1 is required for the weight-loss effects of BIBO3304 on a high-fat diet.
a, b Body weight curve and body weight change of UCP1−/− mice on a high-fat diet administered daily with either a jelly containing vehicle (control) or BIBO3304 for 8 weeks. Data are mean ± s.e.m, n = 6 per group (control: open circle; BIBO3304: filled circle). p values by two-way repeated measures ANOVA. c Whole-body fat mass of vehicle- and BIBO3304-treated UCP1−/− mice on a HFD determined by DEXA at baseline and after 2 weeks of treatment. d Dissected weights of individual WAT from inguinal (WATi), epididymal (WATe), mesenteric (WATm), retroperitoneal (WATr) and total weights of these 4 depots (WATsum) at cull. e Whole-body lean mass of vehicle- and BIBO3304-treated UCP1−/− mice on a HFD determined by DEXA at baseline and after 2 weeks of treatment. Data are mean ± s.e.m, n = 6 per group (control: open red; BIBO3304: red). p values by two-sided t test (c, d, e). f, g Energy expenditure, h, i RER of vehicle- and BIBO3304-treated UCP1−/− mice on a HFD over a 24 h course during an indirect calorimetry study at 13 weeks of age. Data are mean ± s.e.m, control n = 6 (open circle), BIBO3304 n = 5 (filled circle). p values by two-way repeated measures ANOVA. j Temperature measured by infra-red camera of BAT and lumbar back regions of HFD-fed UCP1−/− mice given vehicle or BIBO3304 jelly at 11 weeks of age. Data are mean ± s.e.m, control n = 6 (open red), BIBO3304 n = 5 (red). p values by two-sided t test within the same region. k Glucose levels in an intraperitoneal glucose tolerance test (GTT) in vehicle- and BIBO3304-treated UCP1−/− mice on a HFD at 13 weeks of age. Data are mean ± s.e.m. n = 6 per group (control: open circle; BIBO3304: filled circle). p values by two-way repeated measures ANOVA. ns non-significance. Source data are provided as a Source Data file.
Fig. 8
Fig. 8. Y1R signalling in adipose tissue is critical in obesity development.
a Schematic illustration of the paradigm for phenotyping the tamoxifen-induced adipocyte-specific Y1R deletion mouse model. b Relative Y1R mRNA expression in inguinal WATi, epididymal WATe, BAT, skeletal muscle and the liver of AdipoTMCre/+;Y1lox/lox mice receiving either vehicle or tamoxifen determined by RT-PCR using RPL19 as a housekeeping gene. Data are mean ± s.e.m. n = 4 per group (vehicle: white; tamoxifen: mustard). *p < 0.05 vs vehicle in the same fat depot by two-tailed t test. c, g Body weight of vehicle- or tamoxifen-treated Adipo+/+;Y1lox/lox control mice on a standard chow diet or a HFD for 8 weeks. Data are mean ± s.e.m. Chow (c): vehicle n = 7 (open circle), tamoxifen n = 6 (filled circle); HFD (g): vehicle n = 6 (open square), tamoxifen n = 7 (filled square). *p < 0.05, two-way repeated measures ANOVA. d, h, Change of fat mass of vehicle- or tamoxifen-treated Adipo+/+;Y1lox/lox mice on a chow diet or HFD determined by DEXA at 12 weeks of age. Data are mean ± s.e.m. vehicle n = 6 (open bar), tamoxifen n = 7 (filled bar) in both chow (d) and HFD (h); *p < 0.05 by two-tailed t test. e, i Body weight of vehicle- or tamoxifen-treated AdipoTMCre/+;Y1lox/lox on a chow diet or HFD for 8 weeks. Data are mean ± s.e.m. Chow (e): vehicle n = 8 (open circle), tamoxifen n = 10 (filled circle); HFD (i): n = 7 per group (vehicle: open square; tamoxifen: filled square), p values by two-way repeated measures ANOVA. f, j Change of fat mass of vehicle- or tamoxifen-treated AdipoTMCre/+;Y1lox/lox mice on a chow or HFD determined by DEXA at 12 weeks of age. Data are mean ± s.e.m. Chow (f): vehicle n = 7 (open bar), tamoxifen n = 6 (filled bar); HFD (j): vehicle n = 6 (open bar), tamoxifen n = 10 (filled bar). *p < 0.05, two-tailed t test. k, l Glucose levels in an intraperitoneal glucose tolerance test (GTT) in Adipo+/+;Y1lox/lox mice (light brown, vehicle n = 7, open square; tamoxifen n = 8 filled square) or AdipoTMCre/+;Y1lox/lox mice (black, vehicle n = 7, open square; tamoxifen n = 12 filled square) on a HFD at 13 weeks of age. Data are mean ± s.e.m. *p < 0.05, two-way ANOVA. m, n Glucose levels in an insulin tolerance test (ITT) in Adipo+/+;Y1lox/lox (light brown, vehicle n = 7, tamoxifen n = 8) or AdipoTMCre/+;Y1lox/lox mice (black, vehicle n = 7, tamoxifen n = 11) on a HFD at 14 weeks of age. Data are mean ± s.e.m. p values by two-way ANOVA. ns non-significance. Source data are provided as a Source Data file.
Fig. 9
Fig. 9. Peripheral Y1R antagonism activates thermogenesis in human adipocytes.
a mRNA levels of thermogenic and lipogenic markers in subcutaneous white adipose tissue (SAT) of lean and obese subjects. Data are mean ± s.e.m, lean n = 9 (white bar), obese n = 18 (cyan bar), #p < 0.05, ##p < 0.01, ###p < 0.001 by two-tailed t test. b, mRNA levels of thermogenic and lipogenic markers in visceral adipose tissue (VAT) of lean and obese subjects. Data are mean ± s.e.m, lean n = 10 (white bar), obese n = 19 (cyan bar). #p < 0.05, ##p < 0.01, ###p < 0.001 by two-tailed t test. c mRNA levels of thermogenic and lipogenic markers in stromal vascular fraction (SVF) isolated from obese subjects cultured and differentiated ex vivo and treated with Y1R-specific agonist [Leu31,Pro34]NPY and/or antagonist BIBO3304 for 48 h. Data are mean ± s.e.m, n = 5–8 per group (control: black; BIBO3304: blue; [Leu31,Pro34]NPY: green; BIBO3304 + [Leu31,Pro34]NPY: mustard). *p < 0.05, **p < 0.01, ***p < 0.001, one-way ANOVA with Tukey’s multiple comparisons test. Source data are provided as a Source Data file.
Fig. 10
Fig. 10. Peripheral specific Y1R blockade improves metabolic outcomes via multiple signalling pathways.
a, c Representative western blotting images of p-CREB and p-ERK protein levels in intrascapular BAT and inguinal WAT (WATi) of vehicle- or BIBO3304-treated wild-type mice for 8 weeks. p phosphorylated. 14-3-3 was used as a loading control. Images are representative of three independent experiments. b, d Phosphorylated-CREB (p-CREB) and p-ERK protein expression expressed as fold change to housekeeping gene 14-3-3 and relative to chow-fed control in vehicle- or BIBO3304-treated wild type mice for 7 weeks. Data are mean ± s.e.m, chow n = 3 (control: open grey; BIBO3304: grey); HFD control n = 3 (open blue), BIBO3304 n = 4 (p-CREB) or 5 (p-ERK) (blue). *p < 0.05, ***p < 0.001, two-way ANOVA with Sidak’s multiple comparisons test. e Schematic of optical window implanted over intrascapular BAT of Akt-FRET biosensor mice. Illustration was adapted from Servier Medical Art, licensed under the Creative Commons Attribution 3.0 Unported license. f Representative images of dynamic Akt activity changes after acute glucose challenge in BAT of Akt-FRET biosensor mice on a HFD treated with vehicle or BIBO3304 jelly for 4 weeks, and fluorescence lifetime is quantified in (g) unit: nanosecond (ns). Data are mean ± s.e.m, vehicle n = 4, BIBO3304 n = 3. *p < 0.05 compared to 0 time point, Kruskal–Wallis one-way ANOVA. Images are representative of three independent experiments. Source data are provided as a Source Data file.

References

    1. Moreira FA, Crippa JA. The psychiatric side-effects of rimonabant. Braz. J. Psychiatry. 2009;31:145–153. doi: 10.1590/S1516-44462009000200012. - DOI - PubMed
    1. Onakpoya IJ, Heneghan CJ, Aronson JK. Post-marketing withdrawal of anti-obesity medicinal products because of adverse drug reactions: a systematic review. BMC Med. 2016;14:191. doi: 10.1186/s12916-016-0735-y. - DOI - PMC - PubMed
    1. Loh K, Herzog H, Shi YC. Regulation of energy homeostasis by the NPY system. Trends Endocrinol. Metab. 2015;26:125–135. doi: 10.1016/j.tem.2015.01.003. - DOI - PubMed
    1. Shi YC, et al. Arcuate NPY controls sympathetic output and BAT function via a relay of tyrosine hydroxylase neurons in the PVN. Cell Metab. 2013;17:236–248. doi: 10.1016/j.cmet.2013.01.006. - DOI - PubMed
    1. Chao PT, Yang L, Aja S, Moran TH, Bi S. Knockdown of NPY expression in the dorsomedial hypothalamus promotes development of brown adipocytes and prevents diet-induced obesity. Cell Metab. 2011;13:573–583. doi: 10.1016/j.cmet.2011.02.019. - DOI - PMC - PubMed

Publication types

MeSH terms