. 2021 May 11;12(1):2619.
doi: 10.1038/s41467-021-22921-7.

Lying in wait: the resurgence of dengue virus after the Zika epidemic in Brazil

Affiliations

Lying in wait: the resurgence of dengue virus after the Zika epidemic in Brazil

Anderson Fernandes Brito et al. Nat Commun. .

Abstract

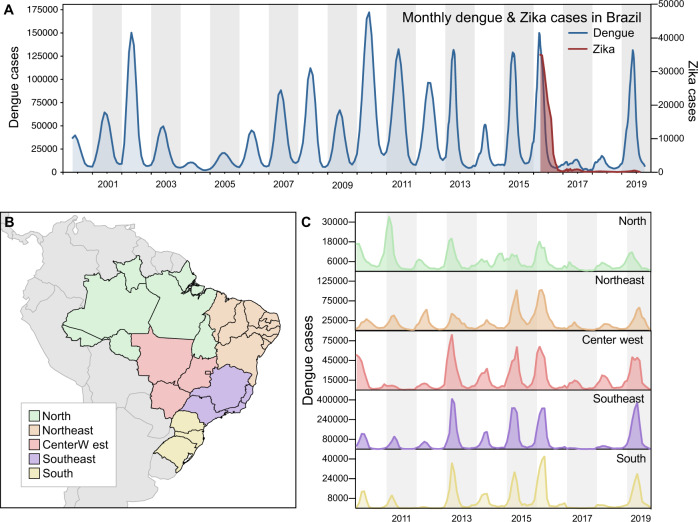
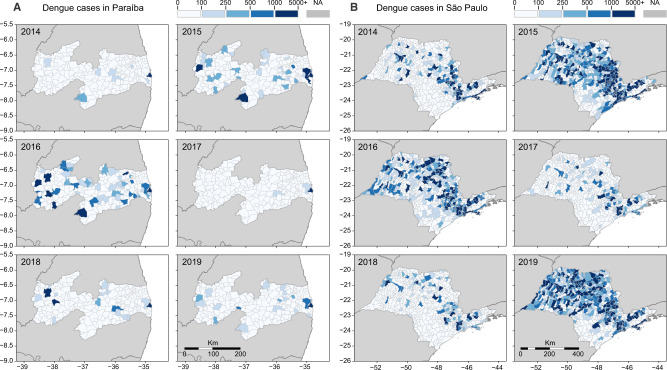
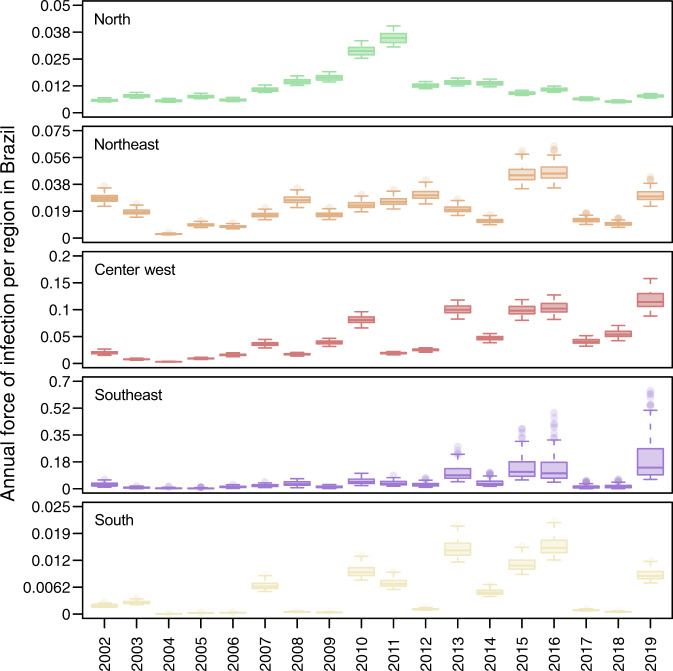
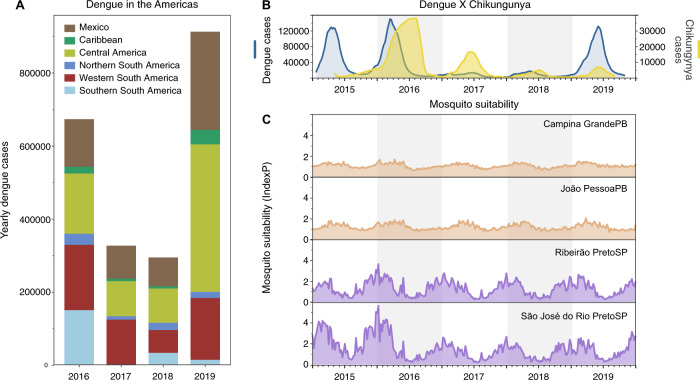
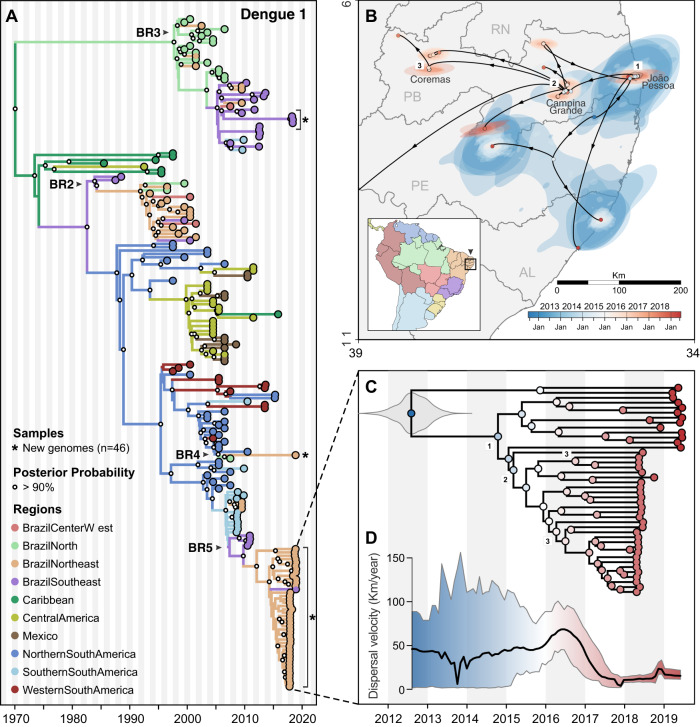
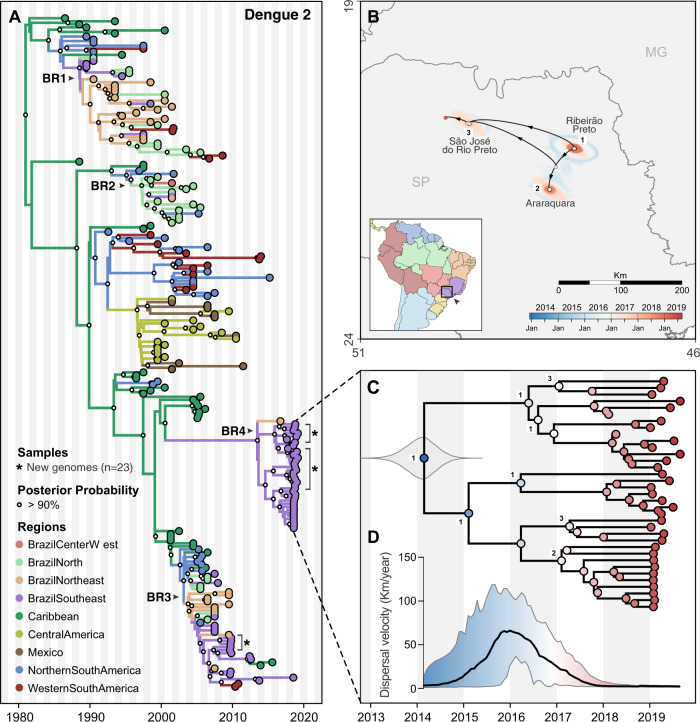
After the Zika virus (ZIKV) epidemic in the Americas in 2016, both Zika and dengue incidence declined to record lows in many countries in 2017-2018, but in 2019 dengue resurged in Brazil, causing ~2.1 million cases. In this study we use epidemiological, climatological and genomic data to investigate dengue dynamics in recent years in Brazil. First, we estimate dengue virus force of infection (FOI) and model mosquito-borne transmission suitability since the early 2000s. Our estimates reveal that DENV transmission was low in 2017-2018, despite conditions being suitable for viral spread. Our study also shows a marked decline in dengue susceptibility between 2002 and 2019, which could explain the synchronous decline of dengue in the country, partially as a result of protective immunity from prior ZIKV and/or DENV infections. Furthermore, we performed phylogeographic analyses using 69 newly sequenced genomes of dengue virus serotype 1 and 2 from Brazil, and found that the outbreaks in 2018-2019 were caused by local DENV lineages that persisted for 5-10 years, circulating cryptically before and after the Zika epidemic. We hypothesize that DENV lineages may circulate at low transmission levels for many years, until local conditions are suitable for higher transmission, when they cause major outbreaks.


Conflict of interest statement

The authors declare no competing interests.

Figures

Fig. 1
Fig. 1. Dengue resurgence in Brazil.
A Monthly dengue and Zika cases in Brazil, from 2000 to 2019 (y-axes not in the same scale). B Map of geographic regions in Brazil, with arrows highlighting two states included in our study: Paraíba, in Northeast Brazil; and São Paulo, in Southeast Brazil. C Dengue cases per geographic region in Brazil, from 2010 to 2019 (y-axes not in the same scale).
Fig. 2
Fig. 2. Reported dengue cases per municipality in Paraíba and São Paulo states, 2014–2019.
The dynamics of dengue in A Paraíba and B São Paulo between 2014 and 2019 followed similar cyclic patterns observed throughout Brazil: a decline in cases in 2014, followed by 2 years of high incidence (2015–2016), succeeded by 2 years of low incidence (2017–2018), with a resurgence of dengue in 2019. As in Figs. 5 and 6, the three main cities included in our study are highlighted in each state. In A Paraíba, we show: (1) João Pessoa; (2) Campina Grande; and (3) Coremas. In B São Paulo, we highlight: 1. Ribeirão Preto; 2. Araraquara; and 3. São José do Rio Preto. Normalized dengue incidence per 100,000 population is shown in Fig. S1.
Fig. 3
Fig. 3. Dengue virus force of infection was low in 2017 and 2018 but consistent with other years in the recent past.
Values displayed here come from the set of 100 final estimates, which reflect the top 10% of 1000 parameter sets. These originally involved sampling γF and γS from assumed uniform priors (specified in Table S1) and then finding maximum-likelihood estimates of other model parameters. Boxes indicate the interquartile ranges and whiskers indicate the 95% quantiles of those 100 points, with dark lines representing median estimates. The regions and colors correspond to the map in Fig. 1B.
Fig. 4
Fig. 4. Low dengue cases in 2017–2018 not primarily due to surveillance or climate.
A Dengue cases from 2016 to 2019 reported to the Pan American Health Organization aggregated by region in the Americas. A sharp decrease in dengue cases was observed in 2017–2018 in distinct subcontinental regions in the Americas: Northern (from Venezuela to French Guyana), Western (from Colombia to Bolivia), and Southern South America (from Paraguay to Argentina), Caribbean, Central America, and Mexico. B In Brazil, the comparative epidemiological curves of dengue and chikungunya cases before and after major Zika outbreaks in 2016. C Measures of Index P, a mosquito-borne viral suitability index (transmission potential), estimated from distinct urban areas in Paraíba (PB, northeast Brazil) and São Paulo (SP, southeast Brazil) states.
Fig. 5
Fig. 5. Regional emergence and cryptic transmission of DENV-1 causing recent outbreaks in Northeast Brazil.
A Time-resolved phylogeny of DENV-1 circulating in the Americas since 1986 (n = 200). Branch colors represent reconstructed ancestral locations using discrete phylogeography. BR2–BR5 represent lineages of DENV-1, numbered in sequential order based on their dates of introduction in Brazil, as previously described. DENV-1 genomes sequenced in this study (n = 46) are highlighted with asterisks (*). B Continuous phylogeography showing the local spread of DENV-1 in the Northeast Brazil states of Paraíba (PB), Alagoas (AL), and likely Pernambuco (PE). Areas numbered as 1 (João Pessoa), 2 (Campina Grande), and 3 (Coremas) correspond to the main location where DENV-1 circulated in 2018–2019 (see Fig. 2A). Shaded areas represent uncertainties, expressed as the 80% highest posterior density (HPD) of the possible locations of origin of viral ancestors. C The main DENV-1 outbreak clade plotted as movement vectors in (B). The violin plot shows the posterior density interval for the TMRCA. Numbers refer to areas shown in (B). D Weighted lineage dispersal velocity through time, reaching its peak around June 2016, with mean velocity of 69.1 km/year (confidence interval, 45.07–90.91 km/year). To better depict the dynamics of spread in Northeast Brazil, the single vector leading to São Paulo was not considered in the calculations of dispersal velocity.
Fig. 6
Fig. 6. Regional emergence and cryptic transmission of dengue 2 viruses causing recent outbreaks in Southeast Brazil.
A Time-resolved phylogeny of DENV-2 circulating in the Americas since 1987 (n = 220). Branch colors represent reconstructed ancestral locations using discrete phylogeography. BR1–BR4 represent lineages of DENV-1, numbered in sequential order based on their dates of introduction in Brazil, as previously described,. DENV-2 genomes sequenced in this study (n = 23) are highlighted with asterisks (*). B Continuous phylogeography showing the local spread of DENV-2 in Southeast Brazil, state of São Paulo (SP). Areas numbered as 1 (Ribeirão Preto), 2 (Araraquara), and 3 (São José do Rio Preto) correspond to some of the main locations where DENV-2 circulated in 2018 (see Fig. 2B). Shaded areas represent uncertainties, expressed as the 80% highest posterior density (HPD) of the possible locations of origin of viral ancestors. C Main DENV-2 outbreak clade in (A), plotted as movement vectors in (B). The violin plot shows the posterior density interval for the TMRCA. Numbers refer to areas shown in (B). D Weighted lineage dispersal velocity through time, reaching its peak around January 2016, with mean velocity of 66.2 km/year (confidence interval, 31.3–103.5 km/year).

References

    1. Brady OJ, et al. Refining the global spatial limits of dengue virus transmission by evidence-based consensus. PLoS Negl. Trop. Dis. 2012;6:e1760. doi: 10.1371/journal.pntd.0001760. - DOI - PMC - PubMed
    1. Bhatt S, et al. The global distribution and burden of dengue. Nature. 2013;496:504–507. doi: 10.1038/nature12060. - DOI - PMC - PubMed
    1. Faria NR, et al. Establishment and cryptic transmission of Zika virus in Brazil and the Americas. Nature. 2017;546:406–410. doi: 10.1038/nature22401. - DOI - PMC - PubMed
    1. Faria NR, et al. Zika virus in the Americas: early epidemiological and genetic findings. Science. 2016;352:345–349. doi: 10.1126/science.aaf5036. - DOI - PMC - PubMed
    1. Zambrana JV, et al. Seroprevalence, risk factor, and spatial analyses of Zika virus infection after the 2016 epidemic in Managua, Nicaragua. Proc. Natl Acad. Sci. USA. 2018;115:9294–9299. doi: 10.1073/pnas.1804672115. - DOI - PMC - PubMed

Publication types

MeSH terms

Substances