. 2021 May 11;12(1):2648.
doi: 10.1038/s41467-021-22914-6.

Posterior subthalamic nucleus (PSTh) mediates innate fear-associated hypothermia in mice

Affiliations

Posterior subthalamic nucleus (PSTh) mediates innate fear-associated hypothermia in mice

Can Liu et al. Nat Commun. .

Erratum in

Abstract

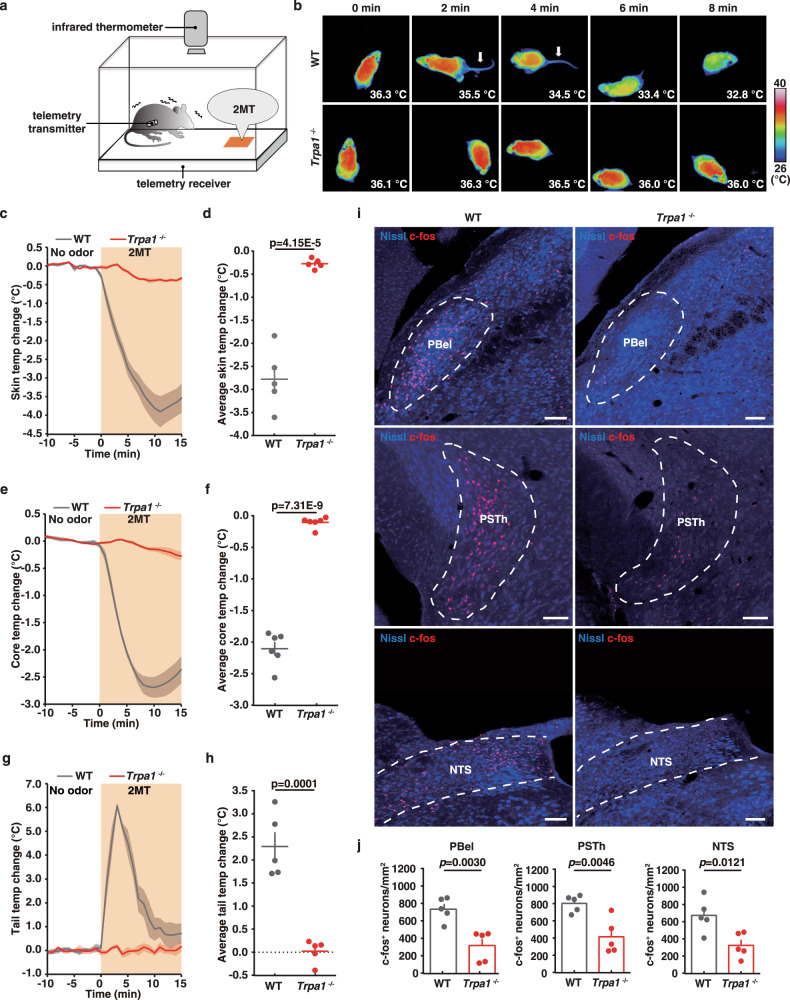
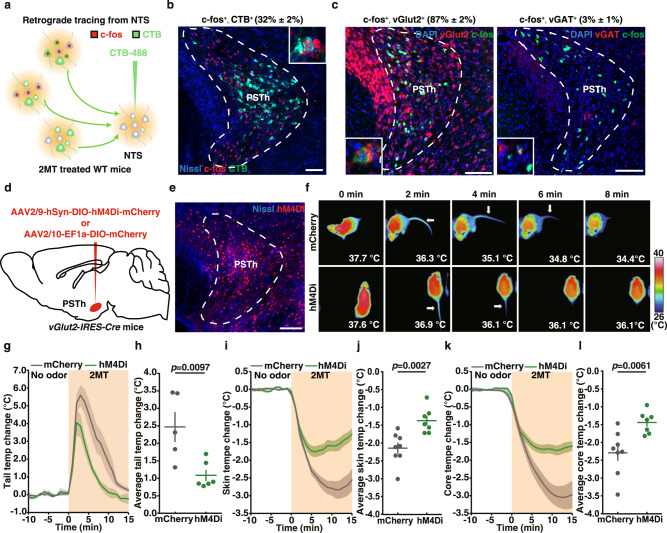
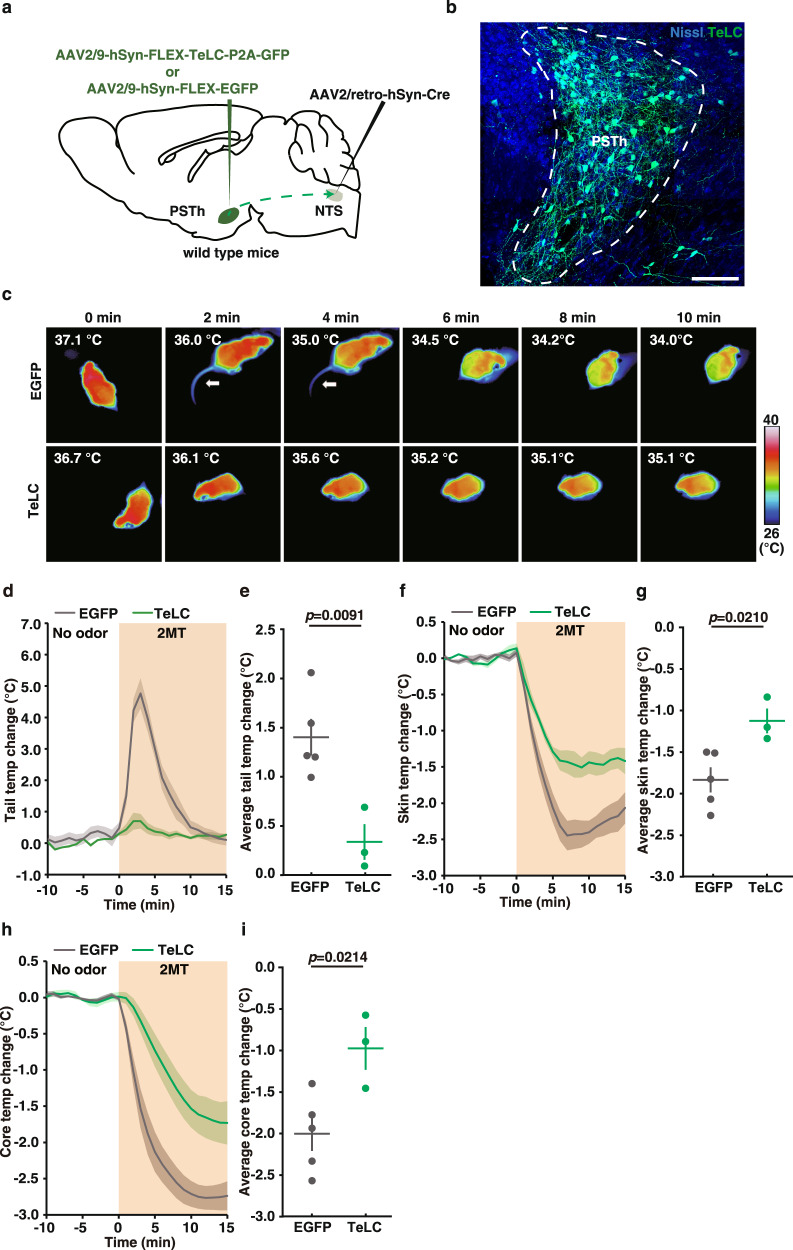
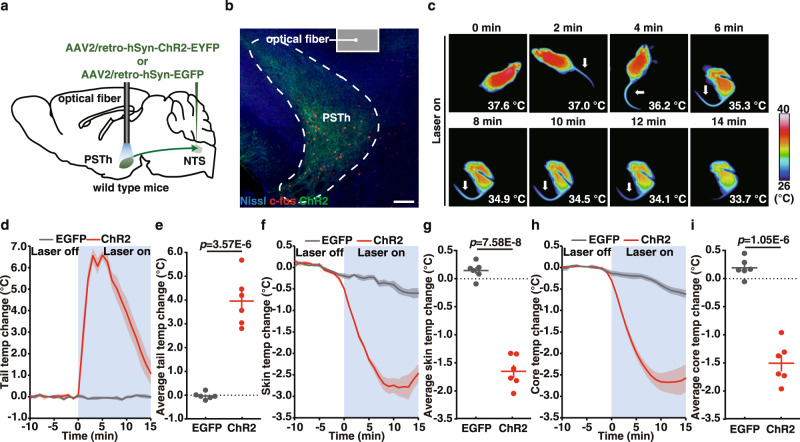
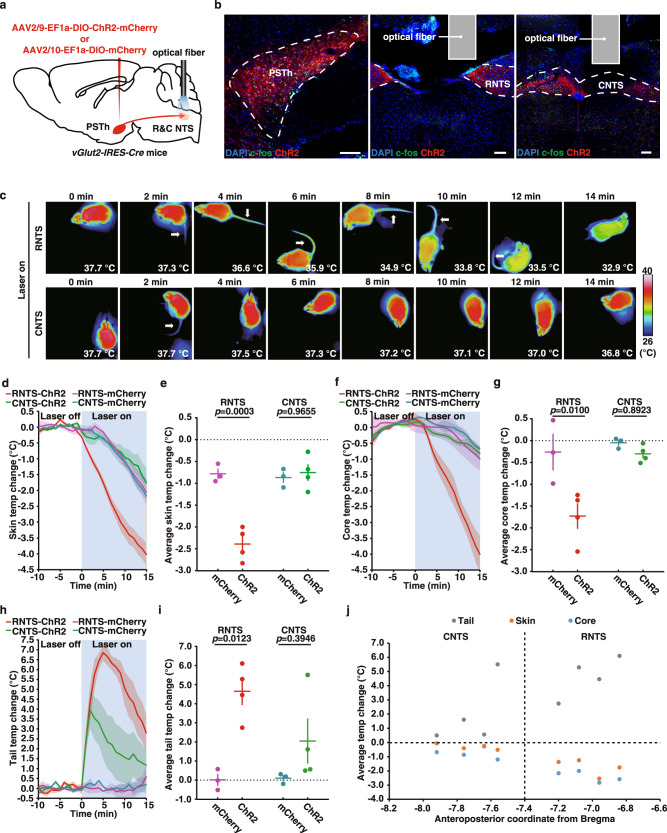
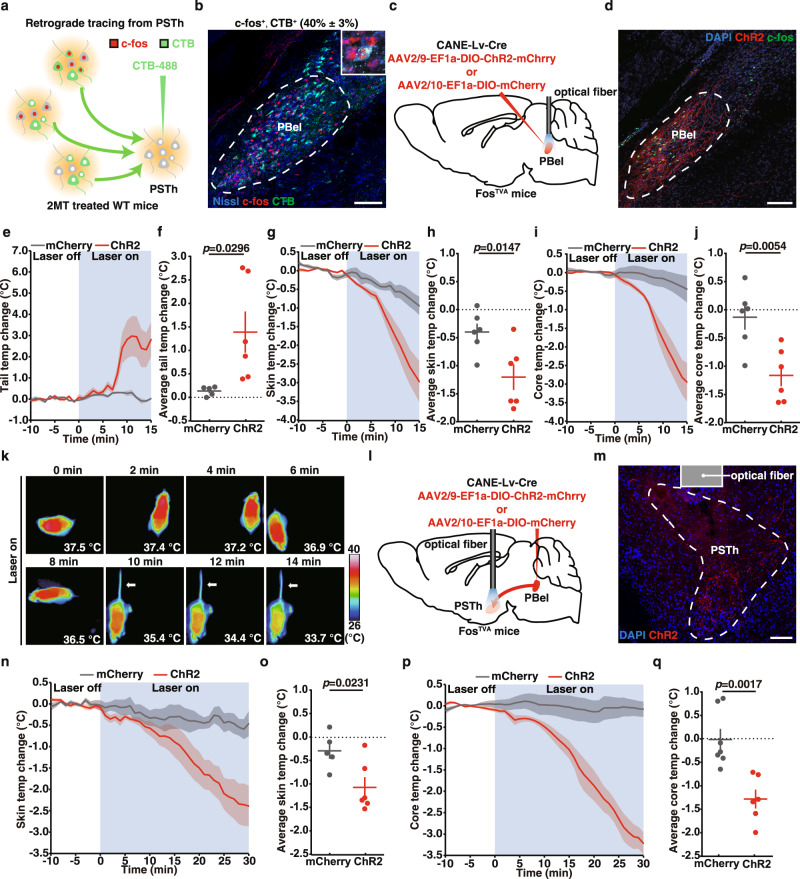
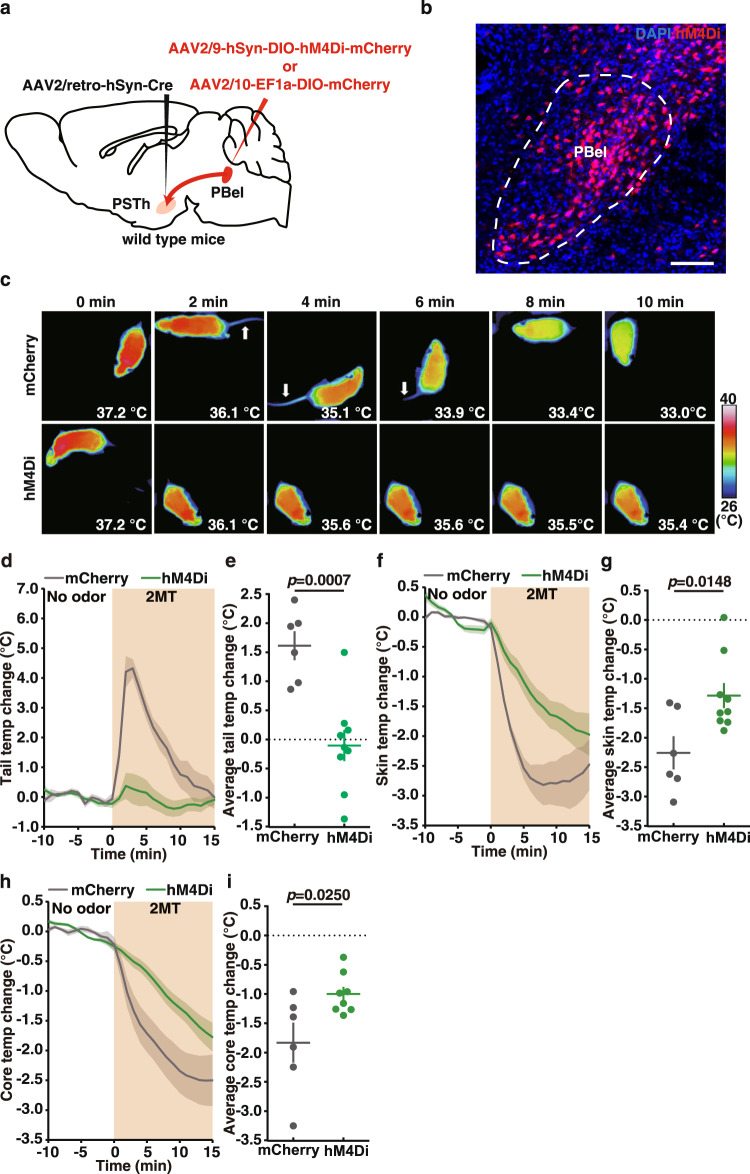
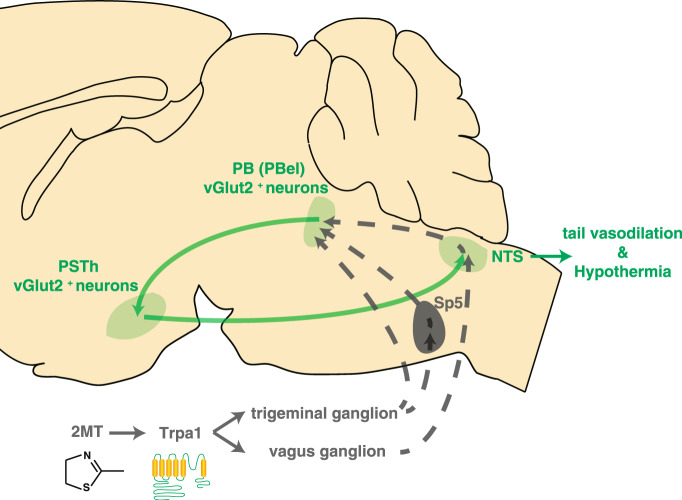
The neural mechanisms of fear-associated thermoregulation remain unclear. Innate fear odor 2-methyl-2-thiazoline (2MT) elicits rapid hypothermia and elevated tail temperature, indicative of vasodilation-induced heat dissipation, in wild-type mice, but not in mice lacking Trpa1-the chemosensor for 2MT. Here we report that Trpa1-/- mice show diminished 2MT-evoked c-fos expression in the posterior subthalamic nucleus (PSTh), external lateral parabrachial subnucleus (PBel) and nucleus of the solitary tract (NTS). Whereas tetanus toxin light chain-mediated inactivation of NTS-projecting PSTh neurons suppress, optogenetic activation of direct PSTh-rostral NTS pathway induces hypothermia and tail vasodilation. Furthermore, selective opto-stimulation of 2MT-activated, PSTh-projecting PBel neurons by capturing activated neuronal ensembles (CANE) causes hypothermia. Conversely, chemogenetic suppression of vGlut2+ neurons in PBel or PSTh, or PSTh-projecting PBel neurons attenuates 2MT-evoked hypothermia and tail vasodilation. These studies identify PSTh as a major thermoregulatory hub that connects PBel to NTS to mediate 2MT-evoked innate fear-associated hypothermia and tail vasodilation.


Conflict of interest statement

The authors declare no competing interests.

Figures

Fig. 1
Fig. 1. Innate fear odor 2MT induces hypothermia and tail temperature increase via Trpa1.
a Schematic of 2MT-induced hypothermia assay in mice. b Time-lapsed thermal images showing tail and skin temperature changes in wild-type (upper) and Trpa1/ (bottom) mice during 2MT treatment. Skin (c), core (e) and tail (g) temperature curves of wild-type and Trpa1/ mice (n = 5 or 6) before and during 2MT treatment. Average skin (d), core (f) and tail (h) temperature changes of wild-type and Trpa1/ mice (n = 5 or 6) during 2MT treatment. i Representative images showing 2MT-induced c-Fos expression in PBel, PSTh, and NTS of wild-type and Trpa1/ mice. j Quantitative analysis of 2MT-evoked c-Fos expression in PBel, PSTh, and NTS in wild-type and Trpa1/ mice (n = 5). ch, j Data are mean ± SEM; two-side Student’s t test. Scale bars, 100 µm.
Fig. 2
Fig. 2. Inhibition of vGlut2+ PSTh neurons attenuates 2MT-evoked hypothermia and tail temperature increase.
a Schematic of retrograde tracing from NTS neurons by CTB injection. b Representative image showing double immunostaining of CTB and c-fos. The percentage of double-positive neurons (CTB+, c-fos+/CTB+%) in PSTh is in parenthesis (n = 3). c Representative images and quantitative analysis showing the percentage of c-fos+, vGlut2+ or c-fos+, vGAT+ double-positive neurons among c-fos+ neurons in PSTh by two-color in situ hybridization (n = 3). d Schematic of chemogenetic inhibition experiment of vGlut2+ PSTh neurons in vGlut2-IRES-Cre mice. e Representative image of hMD4i-labeled vGlut2+ PSTh neurons (n = 7). f Time-lapsed thermal images of mCherry-expressing mice and hM4Di-expressing mice during 2MT treatment following administration of C21. Tail (g), skin (i), and core (k) temperature curves of mice with (hM4Di, n = 7) or without (mCherry, n = 8) inactivation of vGlut2+ PSTh neurons before and during 2MT treatment. Average tail (h), skin (j), and core (l) temperature changes of mice with (hM4Di, n = 7) or without (mCherry, n = 8) inactivation of vGlut2+ PSTh neurons during 2MT treatment. A few mice were not included in the analysis of tail temperature (e) because their tails were frequently obscured in the thermal images. gl Data are mean ± SEM; two-side Student’s t test. Scale bars, 100 µm.
Fig. 3
Fig. 3. TeLC-mediated inactivation of NTS-projecting PSTh neurons diminishes 2MT-evoked hypothermia and abrogates tail temperature increase.
a Schematic of TeLC-mediated inactivation of PSTh neurons in wild-type mice. b Representative image showing TeLC-GFP-labeled NTS-projecting PSTh neurons (n = 5). c Time-lapsed thermal images of wild-type mice without (EGFP, up) or with (TeLC, bottom) inactivation of NTS-projecting PSTh neurons during 2MT treatment. Tail (d), skin (f), and core (h) temperature curves of EYFP-expressing (n = 5) and TeLC-expressing (n = 3) mice before and during 2MT treatment. Average tail (e), skin (g), and core (i) temperature changes of EGFP-expressing (n = 5) and TeLC-expressing (n = 3) mice during 2MT treatment. Two TeLC-expressing mice were not included in the analysis because of low virus transduction rate (Supplementary Fig. 3). di Data are mean ± SEM; two-side Student’s t test. Scale bar, 100 µm.
Fig. 4
Fig. 4. Activation of NTS-projecting PSTh neurons evokes hypothermia and tail temperature increase.
a Schematic of optogenetic activation of the PSTh-NTS pathway in wild-type mice. b Representative image showing c-fos expression in ChR2-labeled PSTh neurons after photoactivation (n = 6). c Time-lapsed thermal images of ChR2-expressing mice during photoactivation of the NTS-projecting PSTh neurons. Tail (d), skin (f), and core (h) temperature curves of EGFP-expressing (n = 6) and ChR2-expressing mice (n = 6) before and during photoactivation of the NTS-projecting PSTh neurons. Average tail (e), skin (g), and core (i) temperature changes of EGFP-expressing (n = 6) and ChR2-expressing mice (n = 6) during photoactivation of NTS-projecting PSTh neurons. di Data are mean ± SEM; two-side Student’s t test. Scale bar, 100 µm.
Fig. 5
Fig. 5. RNTS, but not CNTS, is the main target for hypothermia evoking PSTh neurons.
a Schematic of optogenetic activation of the PSTh-NTS pathway in wild-type mice. b Representative images showing c-fos expression in ChR2-labeled PSTh neurons (left) and their axon terminals in RNTS (middle) and CNTS (right) in vGlut2-IRES-Cre mice after photoactivation. We stained n = 8 ChR2-expressing mice (four for RNTS, four for CNTS) and obtained similar results. c Time-lapsed thermal images of ChR2-expressing mice during photoactivation of axon terminals of RNTS- or CNTS-projecting PSTh neurons. Skin (d), core (f), and tail (h) temperature curves of mCherry-expressing (n = 3) and ChR2-expressing mice (n = 4) before and during photoactivation of axon terminals of RNTS- or CNTS-projecting PSTh neurons. Average skin (e), core (g), and tail (i) temperature changes of mCherry-expressing (n = 3) and ChR2-expressing (n = 4) mice during photoactivation of axon terminals of RNTS- or CNTS-projecting PSTh neurons. j Correlative analysis between the photoactivation-induced average tail, skin, and core temperature changes in ChR2-expressing mice and the anteroposterior coordinates of the optical fiber implant sites. di Data are mean ± SEM; two-way ANOVA analysis followed by Tukey’s multiple comparisons test. Scale bars, 100 µm.
Fig. 6
Fig. 6. Activation of 2MT-activated PBel neurons and their axonal inputs to PSTh evokes hypothermia.
a Schematic of retrograde tracing from PSTh neurons by CTB. b Representative images showing double immunostaining of CTB and c-fos. The percentage of c-fos+, CTB+ neurons among CTB+ neurons in PBel is shown in parenthesis (n = 5). c Schematic of selective opto-stimulation of the cell bodies of 2MT-activated PBel neurons labeled by CANE in FosTVA mice. d Representative images showing c-fos expression in the ChR2-labeled PBel neurons following photoactivation (n = 2). Tail (e), skin (g), and core (i) temperature curves of mCherry-expressing (n = 5 or 7) and ChR2-expressing (n = 6) FosTVA mice before and during blue light stimulation of 2MT-activated PBel neurons. Average tail (f), skin (h), and core (j) temperature changes of mCherry-expressing (n = 5 or 7) and ChR2-expressing (n = 6) FosTVA mice during opto-stimulation of 2MT-activated PBel neurons. k Time-lapsed thermal images of ChR2-expressing FosTVA mice during photoactivation of 2MT-activated PBel neurons. l Schematic of selective opto-stimulation of the axon terminals of 2MT-activated PBel neurons in PSTh in FosTVA mice. m Representative images showing the ChR2-labeled axon terminals from 2MT-activated PBel neurons in PSTh (n = 2). Skin (n) and core (p) temperature curves of mCherry-expressing (n = 5 or 7) and ChR2-expressing (n = 6) FosTVA mice before and during blue light stimulation of axon terminals in PSTh. Average skin (o) and core (q) temperature changes of mCherry-expressing (n = 5 or 7) and ChR2-expressing (n = 6) FosTVA mice during blue light stimulation of axon terminals in PSTh. ej, nq Data are mean ± SEM; two-side Student’s t test. Scale bars, 100 µm.
Fig. 7
Fig. 7. Inhibition of PSTh-projecting PBel neurons diminishes 2MT-evoked hypothermia and tail temperature increase.
a Schematic of chemogenetic inhibition PSTh-projecting PBel neurons. b Representative image of hMD4i-labeled PSTh-projecting PBel neurons (n = 2). c Time-lapsed thermal images of mCherry-expressing mice and hM4Di-expressing mice during 2MT treatment following administration of C21. Tail (d), skin (f), and core (h) temperature curves of mice with (hM4Di, n = 8 or 9) or without (mCherry, n = 6) inactivation of PSTh-projecting PBel neurons before and during 2MT treatment. Average tail (e), skin (g), and core (i) temperature changes of mice with (hM4Di, n = 8 or 9) or without (mCherry, n = 6) inactivation of PSTh-projecting PBel neurons during 2MT treatment. di Data are mean ± SEM; two-side Student’s t test. Scale bar, 100 µm.
Fig. 8
Fig. 8. Neural pathways for 2MT-evoked hypothermia.
2MT is sensed by Trpa1 in trigeminal ganglion (TG) neurons and vagal ganglion (VG) neurons. A subpopulation of vGlut2+ PBel neurons receive the 2MT signal directly from TG neurons or indirectly via Sp5 neurons. These vGlut2+ PBel neurons transmit the 2MT signal to vGlut2+ PSTh neurons, which relay the signal to NTS neurons to trigger hypothermia and tail vasodilation.

References

    1. Morrison, S. F. & Nakamura, K. Central mechanisms for thermoregulation. Annn. Rev. Physiol.81, 285–308 (2019). - PubMed
    1. Madden CJ, Morrison SF. Central nervous system circuits that control body temperature. Neurosci. Lett. 2019;696:225–232. - PMC - PubMed
    1. Tan CL, Knight ZA. Regulation of body temperature by the nervous system. Neuron. 2018 doi: 10.1016/j.neuron.2018.02.022. - DOI - PMC - PubMed
    1. Morrison SF. Central neural control of thermoregulation and brown adipose tissue. Auton. Neurosci. 2016 doi: 10.1016/j.autneu.2016.02.010. - DOI - PMC - PubMed
    1. Huey RB. Temoerature, physiology, and the ecology of reptile. Deep Sea Res. I Oceanogr. Res. Pap. 2008;92:127–140.

Publication types

MeSH terms