. 2021 May 11;12(1):2660.
doi: 10.1038/s41467-021-22916-4.

A high-entropy manganite in an ordered nanocomposite for long-term application in solid oxide cells

Affiliations

A high-entropy manganite in an ordered nanocomposite for long-term application in solid oxide cells

F Baiutti et al. Nat Commun. .

Abstract

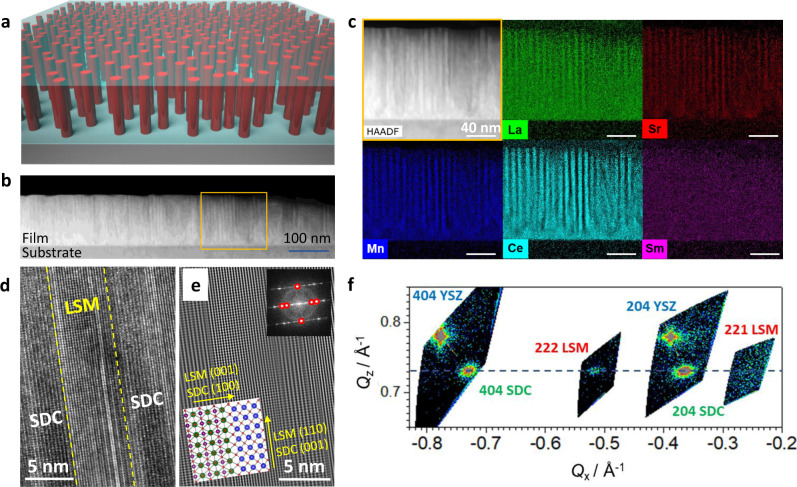
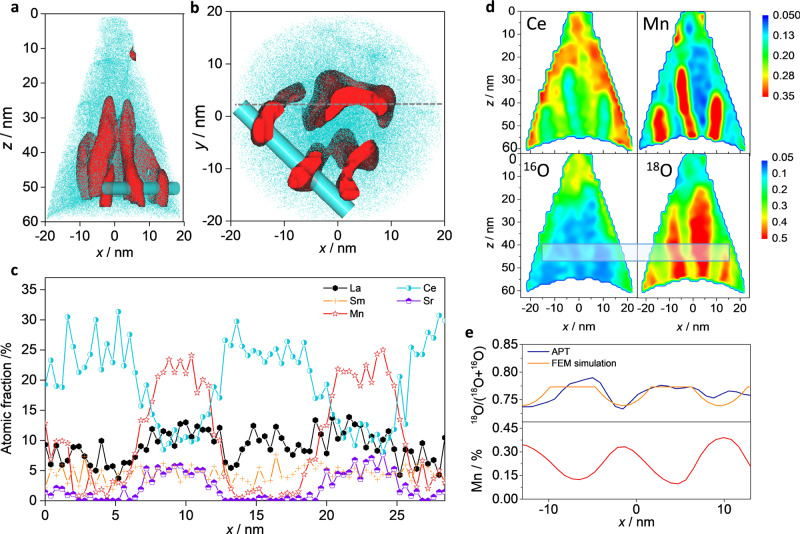
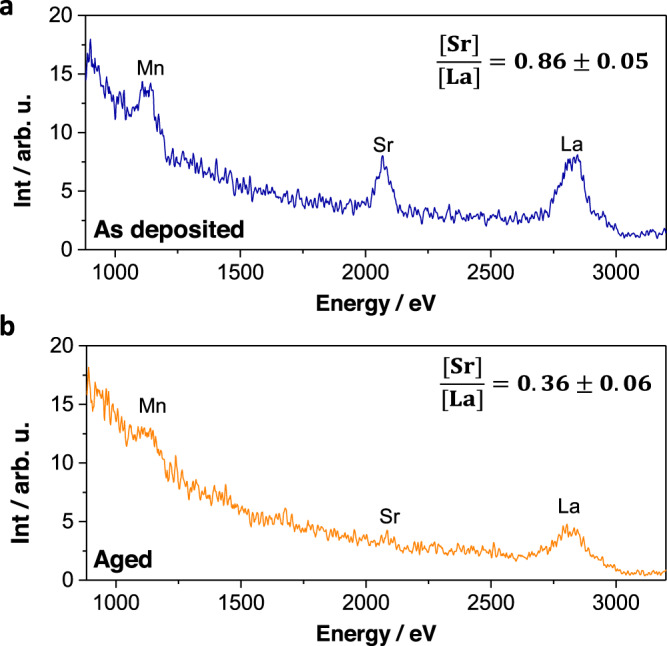
The implementation of nano-engineered composite oxides opens up the way towards the development of a novel class of functional materials with enhanced electrochemical properties. Here we report on the realization of vertically aligned nanocomposites of lanthanum strontium manganite and doped ceria with straight applicability as functional layers in high-temperature energy conversion devices. By a detailed analysis using complementary state-of-the-art techniques, which include atom-probe tomography combined with oxygen isotopic exchange, we assess the local structural and electrochemical functionalities and we allow direct observation of local fast oxygen diffusion pathways. The resulting ordered mesostructure, which is characterized by a coherent, dense array of vertical interfaces, shows high electrochemically activity and suppressed dopant segregation. The latter is ascribed to spontaneous cationic intermixing enabling lattice stabilization, according to density functional theory calculations. This work highlights the relevance of local disorder and long-range arrangements for functional oxides nano-engineering and introduces an advanced method for the local analysis of mass transport phenomena.


Conflict of interest statement

The authors declare no competing interests.

Figures

Fig. 1
Fig. 1. Structural investigation of LSM-SDC.
a Sketch of the LSM-SDC VAN structure. b Low-magnification image of the film, highlighting the long-range order of the pillar structure. The thickness decrease on the right side should be ascribed to TEM lamella preparation. c HAADF image and EDS colour maps for a representative columnar region of the film. d HR-TEM of the alternating SDC and LSM columnar structure. e IFFT of (d). The atomic ordering and the epitaxial relationship between the LSM (out-of-plane [110], zone axis [1-10]) and the SDC (out-of-plane [001], zone axis [100]) regions is clearly visible, as schematically sketched by the bottom inset. In the top inset, the original FFT and the filtered reflections (highlighted by the red circles) are shown. f RSM of the out-of-plane matching (001)-oriented SDC domains (404 and 204 SDC reflections) and (110)-orientedLSM domains (222 and 221 reflections). The 404 and 202 YSZ substrate reflections are also visible. The dotted horizontal line passes through the maxima of the LSM and SDC reflections, highlighting perfect out-of-plane lattice match between the two phases. Please note that the structural investigation was carried out after thermal ageing (700 °C, 100 h).
Fig. 2
Fig. 2. APT on LSM-SDC.
Lateral (a) and bottom view (b) 3D renderings, highlighting the areas of LSM (red surface) and SDC (light blue dots) using a 30 at% La+Sr+Mn isoconcentration surface. c Cationic atomic fraction along the linescan indicated by the blue cylinder in (a) and (b). d Concentration color maps for Ce, Mn, 18O and 16O from the slice indicated by the gray dotted line in (b). e Top: Experimental (blue—obtained upon integration of the area in the rectangle in (d) and simulated (red) 18O fraction profiles. Bottom: Mn concentration profile.
Fig. 3
Fig. 3. Electrochemical performance of LSM (black stars) and LSM-SDC (green bullets) nanocomposites.
a Representative initial EIS Nyquist plots measured at 750 °C (air atmosphere) in an out-of-plane configuration and using a porous Ag layer as a low impedance counter-electrode for LSM and LSM-SDC. The inset shows the LSM-SDC impedance arc on a smaller scale. b Surface exchange coefficient kq as a function of inverse temperature, as compared to stoichiometric LSM (from our labs and from Ref. ), state-of-the-art LSM-YSZ dense composites (from Ref. ) and to state-of-the-art La0.8Sr0.2CoO3 (our lab). The red star represents the value resulting from the FEM simulation of the APT 18O fraction profile. c pO2 dependence for kq. The slopes for LSM and LSM-SDC are indicated. d ASR vs time for LSM and LSM-SDC, measured during ageing treatment. The lines are intended as a guide to the eye.
Fig. 4
Fig. 4. AFM and SEM top-view micrographs for LSM and LSM-SDC.
In (a), a full comparison between the surfaces of the two compounds in the as-grown and aged states is provided. The resulting root mean square roughness are: Rms = 0.8 (7.1) and Rms = 0.7(1.0) nm for LSM-SDC and single phase LSM as grown (after ageing), respectively. In (b –LSM) and (c—VAN), lower magnification SEM for the surfaces after thermal treatment (In-Lens detector – 3 kV acceleration voltage).
Fig. 5
Fig. 5. LEIS spectra for LSM-SDC VAN.
Analysis of surface as deposited (a) and after thermal treatment (100 h, 700 °C—b). The stoichiometric ratio is obtained from integration of the peak areas. Absolute differences in peak intensities should be ascribed to the specific experimental conditions.
Fig. 6
Fig. 6. DFT calculations for high-entropy LSM.
a Example of a 40-atom periodic supercell used in DFT calculations showing relaxed positions of the Mn (gray), Sr (blue), La (green), O (red) and Ce (purple) ion and (b) calculated values of the lattice strain due to chemical doping. c box plot showing the mean and distribution of site volumes around the Sr (blue) and La (green) sites. d bond valence mismatch at the ion positions for the different cation dopants, where for example SrLa-SmLa corresponds to a stoichiometry of La0.75Sr0.125Sm0.125MnO3.

References

    1. Wachsman ED, Lee KT. Lowering the temperature of solid oxide fuel cells. Science. 2011;334:935–939. doi: 10.1126/science.1204090. - DOI - PubMed
    1. Shin, S. S. et al. Multiscale structured low-temperature solid oxide fuel cells with 13 W power at 500 °C. Energy Environ. Sci. 11–16 (2020).
    1. Maier J. Nanoionics: ion transport and electrochemical storage in confined systems. Nat. Mater. 2005;4:805–815. doi: 10.1038/nmat1513. - DOI - PubMed
    1. Steele BCH, Heinzel A. Materials for fuel-cell technologies. Nature. 2001;414:345–352. doi: 10.1038/35104620. - DOI - PubMed
    1. Gao Z, Mogni LV, Miller EC, Railsback JG, Barnett SA. A perspective on low-temperature solid oxide fuel cells. Energy Environ. Sci. 2016;9:1602–1644. doi: 10.1039/C5EE03858H. - DOI

LinkOut - more resources