. 2021 May 11;12(1):2681.
doi: 10.1038/s41467-021-23003-4.

Identification of poly(ADP-ribose) polymerase 9 (PARP9) as a noncanonical sensor for RNA virus in dendritic cells

Affiliations

Identification of poly(ADP-ribose) polymerase 9 (PARP9) as a noncanonical sensor for RNA virus in dendritic cells

Junji Xing et al. Nat Commun. .

Abstract

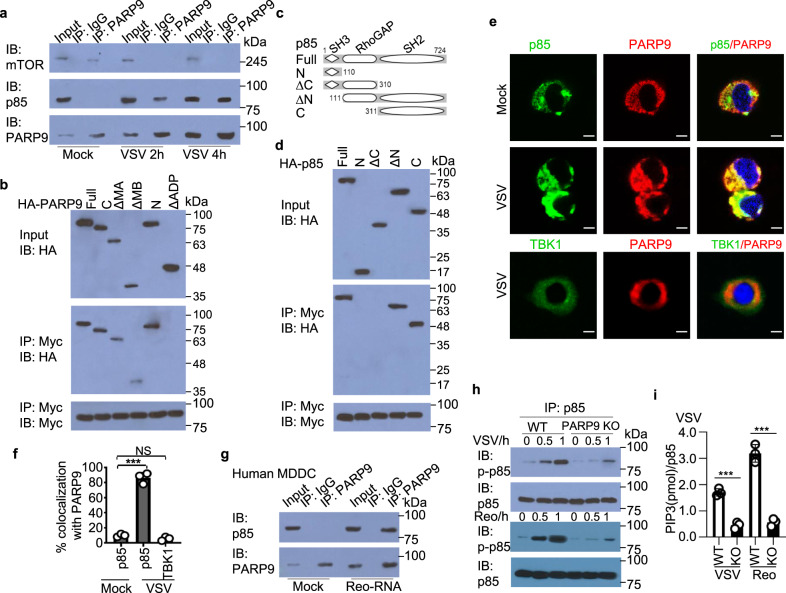
Innate immune cells are critical in protective immunity against viral infections, involved in sensing foreign viral nucleic acids. Here we report that the poly(ADP-ribose) polymerase 9 (PARP9), a member of PARP family, serves as a non-canonical sensor for RNA virus to initiate and amplify type I interferon (IFN) production. We find knockdown or deletion of PARP9 in human or mouse dendritic cells and macrophages inhibits type I IFN production in response to double strand RNA stimulation or RNA virus infection. Furthermore, mice deficient for PARP9 show enhanced susceptibility to infections with RNA viruses because of the impaired type I IFN production. Mechanistically, we show that PARP9 recognizes and binds viral RNA, with resultant recruitment and activation of the phosphoinositide 3-kinase (PI3K) and AKT3 pathway, independent of mitochondrial antiviral-signaling (MAVS). PI3K/AKT3 then activates the IRF3 and IRF7 by phosphorylating IRF3 at Ser385 and IRF7 at Ser437/438 mediating type I IFN production. Together, we reveal a critical role for PARP9 as a non-canonical RNA sensor that depends on the PI3K/AKT3 pathway to produce type I IFN. These findings may have important clinical implications in controlling viral infections and viral-induced diseases by targeting PARP9.


Conflict of interest statement

The authors declare no competing interests.

Figures

Fig. 1
Fig. 1. PARP9 promotes type I IFN production in human innate immune cells in response to poly I:C stimulation or RNA viral infection.
The RT-qPCR (a) and immunoblot (IB, b) analysis of PARP9 or MAVS at mRNA (a, n = 3 per group) and protein (b) levels in THP-1 macrophages treated with shRNA to knockdown expression of PARP9 (sequence P9-a and P9-b) or MAVS. A scrambled shRNA served as a control (sh-Ctrl). The β-actin served as the loading control. ELISA of IFN-α (c) IFN-β (d), and IL-6 (e) production from THP-1 macrophages treated with the indicated shRNA after a 10 h stimulation with 0.5 μg/ml of long poly I:C delivered by Lipofectamine 3000 (n = 3 per group). f Human myeloid cells and lymphoid cells were purified from PBMCs using a cell sorter. Total RNA was isolated from these primary cells induced or not to chip hybridization and microarray. The profile of PARP9 expression in different cells is indicated. The relative expression of PARP9 was compared by plotting the values extracted from the gene expression database. A value <1 indicated the absence of gene expression. g Immunoblot (IB) analysis of PARP9 and β-actin in plasmacytoid dendritic cells (pDCs), myeloid dendritic cells (mDCs), and pDCs and mDCs induced with IFN-α (100 U/ml) for 2 h. The RT-qPCR (h, n = 3 per group) and immunoblot (i) analysis of PARP9 or MAVS at mRNA (h) and protein (i) levels in human monocyte-derived dendritic cells (MDDC) treated with shRNA to knockdown expression of PARP9 (sequence P9-b) or MAVS. A scrambled shRNA served as a control (sh-Ctrl). ELISA of IFN-α (j) and IFN-β (k) production from human MDDC treated with the indicated shRNA after a 10 h stimulation with 0.5 μg/ml of long poly I:C (LPIC), dsDNA from HSV-1 virus (HSV-60, 2.5 μg/ml) or cGAMP (1.0 μg/ml) delivered by Lipofectamine 3000 or 12 h infection with Reovirus (Reo) at an MOI of 5 (n = 3 per group). l Immunoblot analysis of PARP9 expression dynamics in human MDDC treated with IFN-α (500 U/ml) for 0 h, 8 h, 16 h and 24 h. m ELISA of IFN-β production dynamics in human MDDC treated with the indicated shRNA after stimulation with 0.5 μg/ml of LPIC for indicated time (n = 3 per group). Each circle represents an individual independent experiment and small solid black lines indicate the average of triplicates for results in ce, j, k and m. Mock, scrambled shRNA-treated cells without stimulation. Error bars indicate standard error of the mean for results in a, h. NS, not significant (p > 0.05), *p < 0.05, **p < 0.01, ***p < 0.001, and p value was calculated by unpaired two-tailed Student’s t test. Data are from one experiment with duplicate (f) or representative of three independent experiments (ae, jm). Exact p values (a, p = 0.000026, p = 0.378, p < 0.000001, p = 0.276, p = 0.929, p = 0.000028; c p = 0.0019, p = 0.00099, p = 0.00077; d p = 0.0011, p = 0.00057, p = 0.00035; e, p = 0.063, p = 0.00018; h p < 0.000001, p = 0.924, p = 0.346, p < 0.000001; j p = 0.00014, p = 0.000095, p = 0.000053, p = 0.000024, p = 0.826, p = 0.73; k p = 0.00025, p = 0.00013, p = 0.00018, p = 0.00019, p = 0.65, p = 0.65; m p = 0.492, p = 0.0066, p = 0.00033, p = 0.00009).
Fig. 2
Fig. 2. PARP9 plays an essential role in type I IFN production in response to infection by RNA viruses.
ELISA of IFN-α (a, c) and IFN-β (b, d) production by BMDC (a, b) or BMDM (c, d) from wild-type (WT) and Parp9−/− (KO) mice after 10 h of stimulation with long poly I:C (LPIC, 0.5 μg/ml), short poly I:C (SPIC, 0.5 μg/ml) and 5’pppRNA (5’ppp, 0.5 μg/ml) delivered by Lipofectamine 3000 (n = 3 per group). ELISA of IFN-α (e, g) and IFN-β (f, h) production by BMDC from wild-type (WT) and Parp9−/− (KO) mice after 12 h (e, f) or 16 h (g, h) of infection with Reovirus (Reovirus type 3 strain dearing T3D, Reo), VSV (Vesicular stomatitis virus Indiana strain, VSV) or influenza A virus (influenza A virus PR8 strain, Flu) (n = 3 per group). ELISA of IFN-α (i, k) and IFN-β (j, l) production by BMDM from wild-type (WT) and Parp9−/− (KO) mice after 12 h (i, j) or 16 h (k, l) of infection with Reovirus, VSV or Flu virus at an MOI of 5 (n = 3 per group). Each circle represents an individual independent experiment and small solid black lines indicate the average of triplicates for results in al. *p < 0.05, **p < 0.01, ***p < 0.001, and p value was calculated by unpaired two-tailed Student’s t test. Mock, wild-type BMDC or BMDM without stimulation or infection. Data are representative of three independent experiments. Exact p values (a, p = 0.00072, p = 0.00088, p = 0.112; b, p = 0.00069, p = 0.00048, p = 0.0495; c, p = 0.00036, p = 0.00098, p = 0.0495; d, p = 0.00023, p = 0.00044, p = 0.0495; e, p = 0.00008, p = 0.00079, p = 0.0025; f, p = 0.0017, p = 0.0081, p = 0.0136; g, p = 0.00001, p = 0.00098, p = 0.00036; h, p = 0.00089, p = 0.00013, p = 0.0012; i, p = 0.00036, p = 0.00002, p = 0.00004; j, p = 0.0012, p = 0.0015, p = 0.002; k, p = 0.00043, p = 0.00001, p = 0.0019; l, p = 0.00075, p = 0.00052, p = 0.002).
Fig. 3
Fig. 3. PARP9 plays a critical role in host defense against RNA virus infection in vivo.
a Survival of age- and sex-matched PARP9+/+ (WT) and PARP9−/− (KO) mice after intraperitoneal infection with VSV (5 × 108 PFU per mouse) (n = 10 per group). b The qRT-PCR analysis of Ifnb1 mRNA in the liver, lung, spleen, and brain of PARP9+/+ (WT) and PARP9−/− (KO) mice (three per group) infected for 24 h by intraperitoneal injection of phosphate-buffered saline (PBS) or VSV (5 × 107 PFU per mouse); results are presented relative to those of untreated wild-type cells (n = 3 per group). c The qRT-PCR analysis of VSV RNA in the liver, lung, spleen, and brain of mice as in b; results are presented as in b (n = 3 per group). d Plaque assay of VSV titers in the liver, lung, spleen, and brain of mice as in b (n = 3 per group). e ELISA of IFN-β and IFN-α in sera from mice as in b (n = 3 per group). Each circle represents an individual independent experiment and small solid black lines indicate the average of triplicates. f Hematoxylin and eosin (H&E)-staining of lung sections from mice as in b. Scale bars represent 200 μm. g Survival of age- and sex-matched PARP9+/+ (WT) and PARP9−/− (KO) mice after intraperitoneal infection with VSV (5 × 108 PFU per mouse) treated with 500 μg anti-IFNAR antibody or isotype control antibody starting 1 day before infection, followed by 250 μg three times per week for up to 2 weeks (n = 10 per group). h Immunoblot analysis of PARP9 expression in mouse CD11c+ splenic DCs from WT and PARP9 KO mice treated as in g for 1 day. i Survival of age- and sex-matched PARP9+/+ (WT) and PARP9−/− (KO) mice after intravenous infection with HSV-1 (1 × 107 PFU per mouse) (n = 10 per group). Error bars indicate standard error of the mean for results in c, d. NS, not significant (p > 0.05), **p < 0.01, ***p < 0.001, ****p < 0.0001, and p value was calculated by unpaired two-tailed Student’s t test and Gehan–Breslow–Wilcoxon test for survival analysis. Data are representative of three independent experiments. Exact p values (a, p = 0.0004; b, p = 1, p < 0.00001, p = 0.00034, p = 0.00068, p = 0.00082; c p = 1, p = 0.00009, p = 0.00007, p = 0.00028, p = 0.00028; d, p = 0.0082, p = 0.0014, p = 0.00064, p = 0.0013; e upper, p = 0.84, p = 0.00063, lower, p = 0.85, p = 0.00017; g p < 0.0001, p < 0.0001; i, p = 0.1776).
Fig. 4
Fig. 4. PARP9 physically interacts with viral dsRNA.
a Streptavidin pull-down assays of the binding of biotinylated poly(dA:dT) (Bio-poly(dA:dT)), biotinylated long poly(I:C) (Bio-poly(I:C)), or biotinylated reovirus dsRNA (Bio-ReoRNA) to purified HA-tagged PARP9 or PARP13 in HEK 293T cells. b Streptavidin pull-down assays of the binding of Bio-ReoRNA to indicated purified HA-tagged proteins in HEK 293T cells. c Streptavidin pull-down assays of the binding of Bio-ReoRNA to purified HA-tagged PARP9 without (‒) or with competitors poly (A), poly (I:C) or ReoRNA (increasing concentrations of 0.5, 5, and 50 μg/ml), poly(dA:dT), CpG B. d Schematic diagram showing full-length PARP9 (Full) and serial truncations of PARP9 with deletion (Δ) of various domain (left margin); numbers at ends indicate amino acid positions (top). ADP, adenosine diphosphate. e Streptavidin pull-down assays of the binding of Bio-ReoRNA to indicated purified HA-tagged full-length and various truncatants of PARP9 in HEK 293T cells. f Streptavidin pull-down assays of the binding of biotinylated reovirus dsRNA (Bio-Reo1198) to cell-free, recombinant PARP9. g Electrophoretic mobility shift assay (EMSA) of Bio-Reo1198 with cell-free, recombinant full length PARP9 (5 μg or increasing concentrations of 0.5, 1, and 5 μg) or its mutants (5 μg) without or with competitor unlabeled viral dsRNA Reo1198 at 5, 10, and 20 times molar excess. Data are representative of three independent experiments.
Fig. 5
Fig. 5. PARP9 initiates MAVS-independent production of type I IFN.
a IFN-β-Luciferase reporter assays and immunoblot (IB) analysis of HA-tagged PARP9 expression in MAVS knockout (KO) HEK 293 T cells transfected with IFN-β-Luc reporter plasmid, plus HA vector or HA-PARP9 plasmid for 12 h, followed by 10 h of stimulation without (Mock) or with long poly I:C (LPIC, 0.5 μg/ml) and viral dsRNA Reo1198 (Reo1198, 0.5 μg/ml) delivered by Lipofectamine 3000 or infection with reovirus or influenza (Flu) virus at MOI of 5 (n = 3 per group). Results are presented relative to those from unstimulated cells, set as 1. Error bars indicate standard error of the mean. b Immunoblot analysis of PARP9 or MAVS in mouse BDMC from wild-type (WT), PARP9 knockout (P9 KO), MAVS knockout (MS KO), and PARP9/MAVS double knockout (DKO) mice. ELISA of IFN-α (c) and IFN-β (d) production in mouse BDMC from wild-type (WT), PARP9 knockout (P9 KO), MAVS knockout (MS KO), and PARP9/MAVS double knockout (DKO) mice after 10 h of stimulation with long poly I:C (LPIC, 0.5 μg/ml), short poly I:C (SPIC, 0.5 μg/ml) or viral dsRNA Reo1198 (Reo1198, 1 μg/ml) delivered by Lipofectamine 3000 (n = 3 per group). ELISA of IFN-α (e) and IFN-β (f) production in mouse BDMC from WT, P9 KO, MS KO, and DKO mice after 12 h of infection with reovirus at MOI of 5 (n = 3 per group). g Immunoblot analysis of PARP9 expression in PARP9/MAVS double knockout (DKO) BMDC reconstituted with control vector (Ctrl) or wild-type PARP9 (P9). ELISA of IFN-α (h) and IFN-β (i) production by DKO BMDC reconstituted with control vector (Ctrl) or wild-type PARP9 (P9) after 10 h of stimulation with long poly I:C (LPIC, 0.5 μg/ml), short poly I:C (SPIC, 0.5 μg/ml), or viral dsRNA Reo1198 (Reo1198, 1 μg/ml) delivered by Lipofectamine 3000 (n = 3 per group). j ELISA of IFN-α and IFN-β production by DKO BMDC reconstituted with control vector (Ctrl) or wild-type PARP9 (P9) after 12 h of infection with reovirus at MOI of 5 (n = 3 per group). k ELISA of IFN-α and IFN-β production by MAVS KO BMDC after 6 h of first infection with reovirus, VSV at MOI of 5 or rechallenge with reovirus and VSV for another 6 h after first infection (n = 3 per group). Each circle represents an individual independent experiment and small solid black lines indicate the average of triplicates for results in cf and hk. NS, not significant (p > 0.05), **p < 0.01, ***p < 0.001, and p value was calculated by unpaired two-tailed Student’s t test. Mock, BMDC without stimulation or infection. Data are representative of three independent experiments. Exact p values (a, p = 0.057, p = 0.0037, p = 0.00085, p = 0.00029, p = 0.0062; c, p = 0.0003, p = 0.00006, p = 0.00001, p = 0.0071, p = 0.0021, p = 0.00099, p = 0.0004, p = 0.0058, p = 0.00008, p = 0.057, p = 0.00007, p = 0.0004; d, p = 0.0007, p = 0.0003, p = 0.0001, p = 0.0074, p = 0.0008, p = 0.0003, p = 0.0001, p = 0.0017, p = 0.0009, p = 0.052, p = 0.0006, p = 0.0001; e p = 0.00002, p = 0.00001, p < 0.00001, p = 0.0071; f p = 0.0004, p = 0.0002, p = 0.0002, p = 0.0078; h, p = 0.0095, p = 0.0031, p = 0.00063; i p = 0.0011, p = 0.005, p = 0.00054; j, left, p = 0.00087, right, p = 0.0013; k upper, p = 0.00014, p = 0.0023, p = 0.0005, p = 0.0005, lower, p = 0.0008, p = 0.0015, p = 0.0005, p = 0.0009).
Fig. 6
Fig. 6. PARP9 recruits and activates downstream PI3K p85.
a Immunoblot analysis of endogenous proteins PARP9, mammalian target of rapamycin (mTOR) and phosphoinositide 3-kinase (PI3K) regulatory subunit p85 precipitated with anti-PARP9, or immunoglobulin G (IgG) from whole-cell lysates of wild-type BMDC left infected (Mock) or infected with VSV at MOI of 1 for 2 h or 4 h. b Immunoblot analysis of purified Myc-tagged p85 with anti-Myc antibody (bottom blot), and immunoblot analysis of purified HA-tagged full-length PARP9 and serial truncation of PARP9 with deletion (Δ) of various domains alone with anti-HA antibody (top blot) or after incubation with Myc-tagged p85 and immunoprecipitation with anti-Myc antibody (middle blot). c Schematic diagram showing full-length p85 (Full) and serial truncations of p85 with deletion (Δ) of various domain (left margin); numbers at ends indicate amino acid positions (top). SH3, the Src-homology 3 domain; RhoGAP, Rho GTPase activating protein domain; SH2, the Src-homology 2 domain. d Immunoblot analysis of purified Myc-tagged PARP9 with anti-Myc antibody (bottom blot), and immunoblot analysis of purified HA-tagged full-length p85 and serial truncations of p85 with deletion of various domains alone with anti-HA antibody (top blot) or after incubation with Myc-tagged PARP9 and immunoprecipitation with anti-Myc antibody (middle blot). e Confocal microscopy of primary peritoneal macrophages from WT mice left infected (Mock) or infected with VSV at MOI of 1 for 2 h. p85 or TBK1 was stained with mouse anti-PI3 kinase p85 alpha monoclonal antibody (Cat: ab86714, Abcam) or mouse anti-TBK1 monoclonal antibody (Cat: NB100-56705, Novus Biologicals), followed by Alexa Fluor 488 goat anti-mouse secondary antibody (green), while PARP9 was stained with rabbit anti-PARP9 polyclonal antibody (Cat: LS-B9440, LifeSpan BioSciences), followed by Alexa Fluor 594 goat anti-rabbit secondary antibody (red). DAPI (4′,6-diamidino-2-phenylindole) served as the nuclei marker (blue). Scale bars represent 10 µm. f Quantification of colocalization between PARP9 and p85 or TBK1 using ImageJ software (n = 3 per group). g Immunoblot analysis of endogenous proteins PARP9 and PI3K regulatory subunit p85 precipitated with anti-PARP9, or immunoglobulin G (IgG) from whole-cell lysates of human MDDC left transfected (Mock) or transfected with reovirus dsRNA (Reo-RNA) for 6 h. h Immunoblot analysis of endogenous proteins p85 and phosphorylated p85 (p-p85) precipitated with anti-p85 from whole-cell lysates of wild-type (WT) or PARP9 KO BMDC left infected (0 h) or infected with VSV or reovirus (Reo) at MOI of 1 for 0.5 or 1 h. i The relative amounts of PIP3 in the plasma membrane were normalized to the amount of immunoprecipitated p85 in WT and PARP9 KO BMDC after VSV infection (n = 3 per group). Error bars indicate standard error of the mean for results in f, i. NS, not significant (p > 0.05), ***p < 0.001, and p value was calculated by unpaired two-tailed Student’s t test. Data are representative of three independent experiments. Exact p values (f, p = 0.00007, p = 0.08; i, p = 0.0003, p = 0.00024).
Fig. 7
Fig. 7. PI3K p85 activates downstream AKT3 to directly phosphorylate IRF3 and IRF7 to induce type I IFN production.
a Relative mRNA levels of Akt1, Akt2, and Akt3 in wild-type BMDC left infected (Mock) or infected with VSV or reovirus (Reo) at MOI of 1 for 2 h (n = 3 per group). b Immunoblot analysis of AKT1, AKT2, or AKT3 in wild-type BMDC treated with shRNA to knockdown expression of AKT1, AKT2 or AKT3, followed by VSV infection at MOI of 1 for 2 h. A scrambled shRNA served as a control (sh-Ctrl). The β-actin served as the loading control. c Relative Ifnb1 mRNA levels in wild-type BMDC treated with the indicated shRNA, followed by a 2 h infection without (Mock) or with VSV or reovirus (Reo) at MOI of 1 (n = 3 per group). d Immunoblot analysis of endogenous proteins AKT1, AKT2, AKT3, and p85 precipitated with anti-p85, or immunoglobulin G (IgG) from whole-cell lysates of wild-type (WT) or PARP9 KO BMDC infected with VSV at MOI of 1 for 2 h. e Immunoblot analysis of endogenous proteins IRF3, IRF7 and AKT3 precipitated with anti-AKT3 from whole-cell lysates of wild-type (WT) or PARP9 KO BMDC infected with VSV at MOI of 1 for 2 h. f Immunoblot analysis of the PARP9, phosphorylated p65 (p-p65), p65, phosphorylated IRF3 at S396 (p-IRF3 S396), phosphorylated IRF3 at S385 (p-IRF3 S385), total IRF3, phosphorylated IRF7 at S477 (p-IRF7 S477), total IRF7, phosphorylated AKT at S473 (p-AKT S473), total AKT3, and β-actin in wild-type (WT) and PARP9 KO BMDC before (0) or various times (above lanes) after VSV infection at MOI of 1. g Immunoblot analysis of endogenous proteins MAVS and IRF3 precipitated with anti-IRF3, or immunoglobulin G (IgG) from whole-cell lysates of wild-type (WT) or PARP9 KO BMDC infected with reovirus at MOI of 1 for 2 h. h Immunoblot analysis of phosphorylated p65 (p-p65), p65, phosphorylated IRF3 at S396 (p-IRF3 S396), phosphorylated IRF3 at S385 (p-IRF3 S385), total IRF3 in wild-type (WT), PARP9 KO, MAVS KO, and PARP9/MAVS double knockout (DKO) BMDC before (0) or after reovirus (Reo) infection for 6 h at MOI of 1. i Immunoblot analysis of phosphorylated IRF3 (p-IRF3 S385), phosphorylated IRF7 (p-IRF7), Flag-IRF3 and Flag-IRF7 in HEK293T cells overexpressing WT IRF3, IRF3 mutant (S385A), WT IRF7, IRF7 mutant (S483/484 A corresponding to mouse IRF7 S437/438 A) together with Myc-AKT3 and HA-PARP9. Error bars indicate standard error of the mean for results in a, c . NS, not significant (p > 0.05), *p < 0.05, **p < 0.01, ***p < 0.001, and p value was calculated by unpaired two-tailed Student’s t test. Mock, BMDC without infection. Data are representative of three independent experiments. Exact p values (a, p = 0.004, p = 0.02, p = 0.0001; c, p = 0.52, p = 0.0007).

References

    1. Takeuchi O, Akira S. Pattern recognition receptors and inflammation. Cell. 2010;140:805–820. doi: 10.1016/j.cell.2010.01.022. - DOI - PubMed
    1. Paludan SR, Bowie AG. Immune sensing of DNA. Immunity. 2013;38:870–880. doi: 10.1016/j.immuni.2013.05.004. - DOI - PMC - PubMed
    1. Wang D, et al. Clinical characteristics of 138 hospitalized patients with 2019 novel coronavirus-infected pneumonia in Wuhan, China. JAMA. 2020;323:1061–1069. doi: 10.1001/jama.2020.1585. - DOI - PMC - PubMed
    1. Yoneyama M, et al. Shared and unique functions of the DExD/H-box helicases RIG-I, MDA5, and LGP2 in antiviral innate immunity. J. Immunol. 2005;175:2851–2858. doi: 10.4049/jimmunol.175.5.2851. - DOI - PubMed
    1. Kato H, et al. Differential roles of MDA5 and RIG-I helicases in the recognition of RNA viruses. Nature. 2006;441:101–105. doi: 10.1038/nature04734. - DOI - PubMed

Publication types

MeSH terms