. 2021 May 11;12(1):2683.
doi: 10.1038/s41467-021-22993-5.

The histone variant H2A.W and linker histone H1 co-regulate heterochromatin accessibility and DNA methylation

Affiliations

The histone variant H2A.W and linker histone H1 co-regulate heterochromatin accessibility and DNA methylation

Pierre Bourguet et al. Nat Commun. .

Abstract

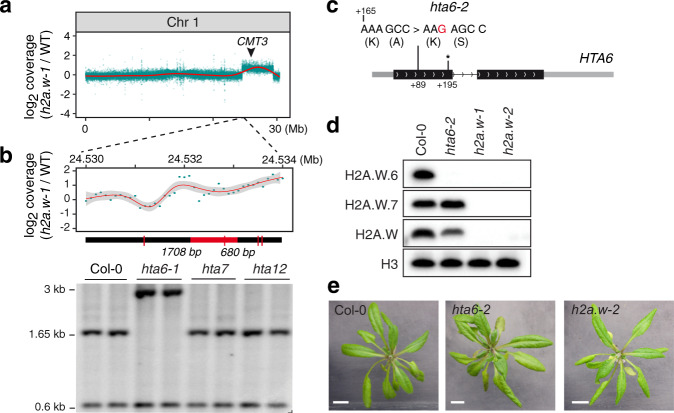
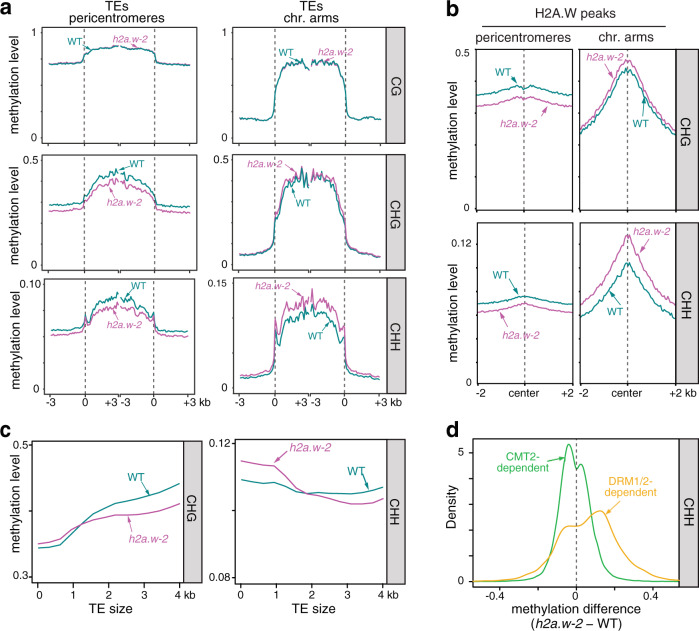
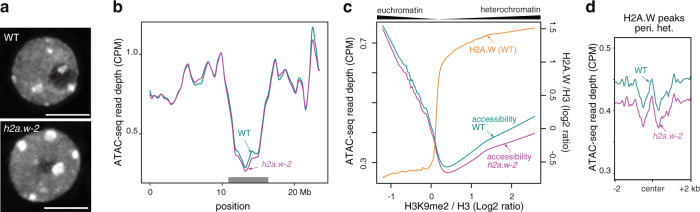
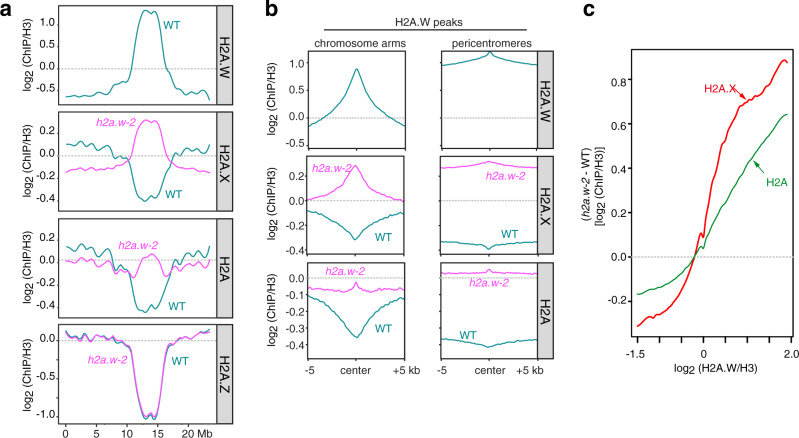
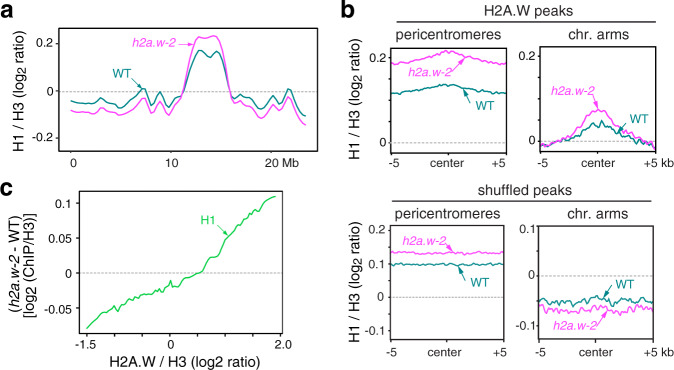
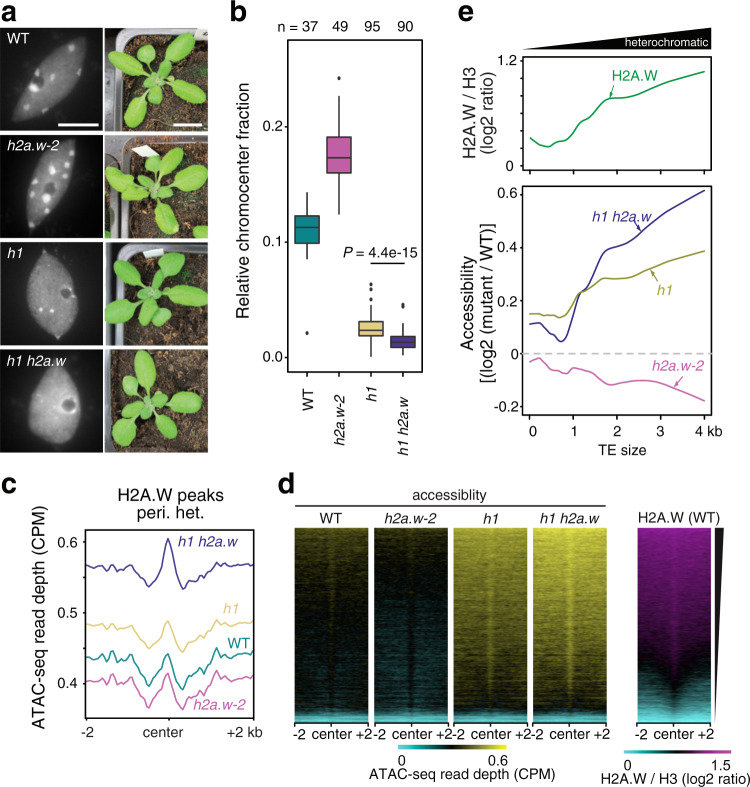
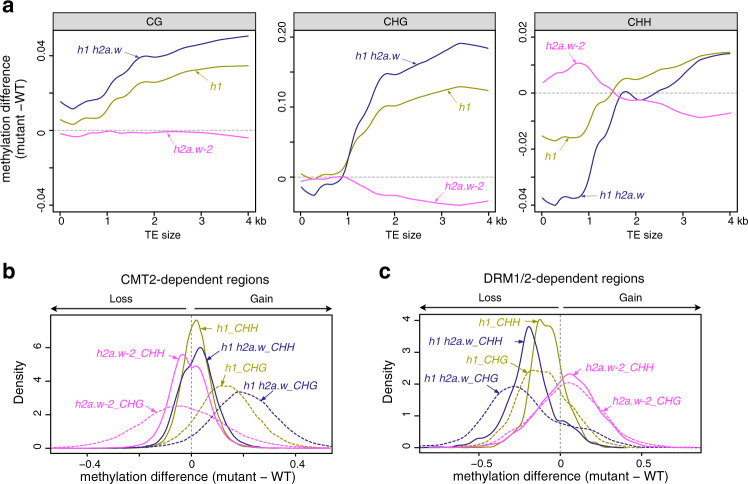
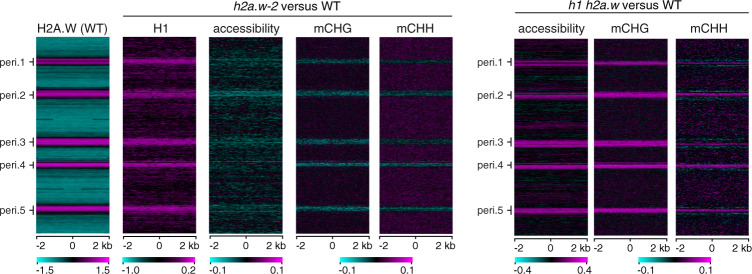
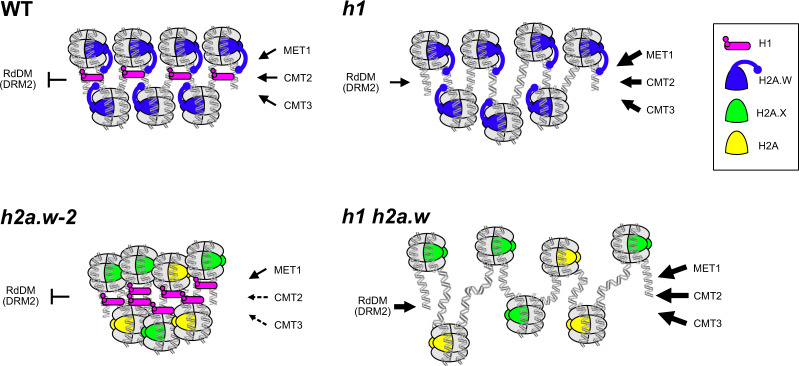
In flowering plants, heterochromatin is demarcated by the histone variant H2A.W, elevated levels of the linker histone H1, and specific epigenetic modifications, such as high levels of DNA methylation at both CG and non-CG sites. How H2A.W regulates heterochromatin organization and interacts with other heterochromatic features is unclear. Here, we create a h2a.w null mutant via CRISPR-Cas9, h2a.w-2, to analyze the in vivo function of H2A.W. We find that H2A.W antagonizes deposition of H1 at heterochromatin and that non-CG methylation and accessibility are moderately decreased in h2a.w-2 heterochromatin. Compared to H1 loss alone, combined loss of H1 and H2A.W greatly increases accessibility and facilitates non-CG DNA methylation in heterochromatin, suggesting co-regulation of heterochromatic features by H2A.W and H1. Our results suggest that H2A.W helps maintain optimal heterochromatin accessibility and DNA methylation by promoting chromatin compaction together with H1, while also inhibiting excessive H1 incorporation.


Conflict of interest statement

The authors declare no competing interests.

Figures

Fig. 1
Fig. 1. H2A.W is not required for Arabidopsis development.
a Sequencing coverage of published h2a.w-1 BS-seq data, averaged in 1 kb bins across chromosome 1. The red line shows the smoothed conditional mean (LOESS). The black arrowhead indicates the genomic location of CMT3. See also Supplementary Fig. 1a. b Zoomed-in view of plot in a across the left border of the chromosome 1 region showing increased coverage in h2a.w-1 (top panel). DNA gel blot analysis of the chromosome 1 region showing abnormal coverage in h2a.w-1 in the indicated T-DNA insertion mutants (lower panel). Genomic DNA of the indicated genotypes was digested with SspI (recognition sites indicated by red ticks on the thick black line) and hybridized with a fragment corresponding to the genomic region indicated in red under the plot. Two independent experiments were performed with identical results. c The hta6-2 CRISPR-Cas9 mutant allele. Diagram of the HTA6 gene showing the insertion of a G (in red) in hta6-2, which creates a frame shift 89 bp downstream from the translation initiation site and an early stop codon (asterisk) 195 bp downstream from the translation initiation site. d Western blot showing total loss of H2A.W in h2a.w-1 and h2a.w-2. Nuclear extracts of the indicated genotypes were analyzed using antibodies directed against H2A.W.6, H2A.W.7, total H2A.W, and H3. Two independent experiments were performed with similar results. e Representative images of wild-type, hta6-2, and h2a.w-2 plants (scale bar = 1 cm). Both hta6-2 and h2a.w-2 mutants develop like wild-type Col-0 plants. Source data underlying Fig. 1b, d are provided as a Source Data file.
Fig. 2
Fig. 2. Loss of H2A.W alters non-CG DNA methylation patterns.
a CG, CHG, and CHH methylation levels over TEs in pericentromeres and chromosome arms in WT and h2a.w-2. TEs were aligned at the 5′ (left dashed line) and 3′ end (right dashed line), and sequences 3 kb upstream or downstream were included, respectively. Average methylation over 100 bp bins is plotted. b CHG and CHH methylation levels over H2A.W peaks in the chromosome arms and pericentromeres. c Locally weighted scatterplot smoothing (LOESS) fit of CHG and CHH methylation levels in WT and h2a.w-2 calculated in 50 bp windows and plotted against TE size. d Kernel density plots of CHH DNA methylation differences between h2a.w-2 and WT at CMT2-dependent and DRM1/2-dependent regions.
Fig. 3
Fig. 3. Loss of H2A.W alters heterochromatin organization and accessibility.
a Representative images of DAPI-stained WT (Col-0) and h2a.w-2 leaf interphase nuclei. Two independent experiments were performed with similar results. Scale bar is 5 µm. b Locally weighted scatterplot smoothing (LOESS) fit of ATAC-seq read depth averaged in 1 kb bins across chromosome 3 in WT and h2a.w-2. Average of two replicates shown. The gray rectangle indicates the location of pericentromeric heterochromatin. c Smoothing spline fit (50 degrees of freedom) of WT H2A.W levels (log2 ChIP-seq H2A.W/H3) and of ATAC-seq read depth (CPM normalized) in WT and h2a.w-2 in 1 kb windows plotted against WT H3K9me2 level. d ATAC-seq read depth over H2A.W peaks in pericentromeric heterochromatin. Average of two replicates shown.
Fig. 4
Fig. 4. Replicative H2A and H2A.X replace H2A.W in h2a.w-2.
a Locally weighted scatterplot smoothing (LOESS) fit of H2A.W, H2A.X, replicative H2A and H2A.Z levels averaged in 1 kb bins across chromosome 3 in WT and h2a.w-2. Average of two replicates shown. b Metaplots of average H2A.W, H2A.X, and replicative H2A levels from two replicates over H2A.W peaks in the chromosome arms and pericentromeres. c Smoothing spline fits (50 degrees of freedom) of changes in H2A.X and replicative H2A levels (h2a.w-2 minus WT; log2 ChIP/H3) in 1 kb windows plotted against WT H2A.W level. Source data underlying Fig. 4a are provided as a Source Data file.
Fig. 5
Fig. 5. H2A.W antagonizes histone H1 deposition in heterochromatin.
a Locally weighted scatterplot smoothing (LOESS) fit of H1 levels averaged in 1 kb bins across chromosome 3 in WT and h2a.w-2. Average of two replicates shown. b Metaplots of average H1 levels from two replicates over H2A.W peaks in pericentromeres and the chromosome arms (top panel). Plots over randomly shuffled peaks within the chromosome arms and pericentromeres are shown for comparison (bottom panel). c Smoothing spline fits (50 degrees of freedom) of change in H1 levels (h2a.w-2 minus WT; log2 ChIP/H3) in 1 kb windows plotted against WT H2A.W level. Source data underlying Fig. 5a are provided as a Source Data file.
Fig. 6
Fig. 6. H2A.W and H1 co-regulate heterochromatin accessibility.
a Representative images of DAPI-stained WT (Col-0), h2a.w-2, h1 and h1 h2a.w leaf interphase nuclei (left; scale bar is 5 µm) and of 3-week-old plants of the same genotypes (right; scale bar is 1 cm). Nuclear preparation and analysis were independently repeated three times with similar results. b Quantification of the relative chromocenter fraction in WT (Col-0), h2a.w-2, h1 and h1 h2a.w nuclei. Number of analyzed nuclei are indicated on the top. Whiskers indicate 1.5X IQR. Outliers are represented by circles. Relative chromocenter fraction in h1 and h1h2a.w show statistically significant difference (P = 4.4e-15, unpaired Mann–Whitney test). c ATAC-seq read depth over H2A.W peaks in pericentromeric heterochromatin. Average of two replicates shown. d Heat maps of average ATAC-seq read depth over H2A.W peaks in pericentromeres ranked based on level H2A.W signal in WT. e Locally weighted scatterplot smoothing (LOESS) fit of WT H2A.W levels (log2 ChIP/H3; top panel) and changes in chromatin accessibility (mutant / WT; ATAC-seq read depth) in 50 bp windows plotted against TE size.
Fig. 7
Fig. 7. Impact of combined loss of H2A.W and H1 on DNA methylation.
a Locally weighted scatterplot smoothing (LOESS) fit of changes in CG, CHG, and CHH DNA methylation in h2a.w-2, h1 and h1 h2a.w mutants (mutant minus WT) in 50 bp windows plotted against TE size. b Kernel density plots of CHG and CHH DNA methylation changes at CMT2-dependent regions in h2a.w-2, h1 and h1 h2a.w mutants. c Kernel density plots of CHG and CHH DNA methylation changes at DRM1/2-dependent regions in h2a.w-2, h1 and h1 h2a.w mutants.
Fig. 8
Fig. 8. h2a.w-2 and h1 h2a.w show opposite changes in accessibility and non-CG methylation.
The genome was divided into consecutive, non-overlapping 4-kb bins, which are stacked according to their genomic position from the top of chromosome 1 to the bottom of chromosome 5. Pericentromeric regions are indicated (peri.1 to peri.5). H2A.W enrichment in the WT (log2 ChIP/H3) is shown as a heat map on the left. Other heat maps show changes in H1 levels (h2a.w-2/WT; log2 ChIP/H3), changes in chromatin accessibility (log2 mutant/WT; ATAC-seq read depth), and changes in CHG and CHH DNA methylation (mutant minus WT) in h2a.w-2 versus WT and in h1 h2a.w versus WT.
Fig. 9
Fig. 9. Model of co-regulation of heterochromatin accessibility by H2A.W and H1.
In WT, H2A.W and H1 both interact with heterochromatin linker DNA to maintain a normal balance of accessibility to chromatin modifiers and DNA methyltransferases in heterochromatin. In the absence of H2A.W, H1 over-accumulates at linker DNA and further reduces accessibility. Loss of H1 alone causes incomplete decompaction, while loss of both H1 and H2A.W causes strong decompaction and increased accessibility. Thus, H2A.W promotes chromatin compaction in the absence of H1, but also promotes heterochromatin ‘breathing’ by opposing excessive H1 incorporation. The thickness of the arrows illustrates the accessibility of MET1, CMT2, CMT3, and DRM2 to DNA. Dashed arrows represent the lowest accessibility, and for solid arrows, the thicker the arrow, the more accessible the heterochromatic DNA.

References

    1. Du J, Johnson LM, Jacobsen SE, Patel DJ. DNA methylation pathways and their crosstalk with histone methylation. Nat. Rev. Mol. Cell Biol. 2015;16:519–532. doi: 10.1038/nrm4043. - DOI - PMC - PubMed
    1. Stroud H, et al. Non-CG methylation patterns shape the epigenetic landscape in Arabidopsis. Nat. Struct. Mol. Biol. 2014;21:64–72. doi: 10.1038/nsmb.2735. - DOI - PMC - PubMed
    1. Zemach A, et al. The Arabidopsis nucleosome remodeler DDM1 allows DNA methyltransferases to access H1-containing heterochromatin. Cell. 2013;153:193–205. doi: 10.1016/j.cell.2013.02.033. - DOI - PMC - PubMed
    1. Du J, et al. Dual binding of chromomethylase domains to H3K9me2-containing nucleosomes directs DNA methylation in plants. Cell. 2012;151:167–180. doi: 10.1016/j.cell.2012.07.034. - DOI - PMC - PubMed
    1. Du J, et al. Mechanism of DNA methylation-directed histone methylation by KRYPTONITE. Mol. Cell. 2014;55:495–504. doi: 10.1016/j.molcel.2014.06.009. - DOI - PMC - PubMed

Publication types

MeSH terms