. 2021 May 11;12(1):2700.
doi: 10.1038/s41467-021-22989-1.

Integration of machine learning and genome-scale metabolic modeling identifies multi-omics biomarkers for radiation resistance

Affiliations

Integration of machine learning and genome-scale metabolic modeling identifies multi-omics biomarkers for radiation resistance

Joshua E Lewis et al. Nat Commun. .

Abstract

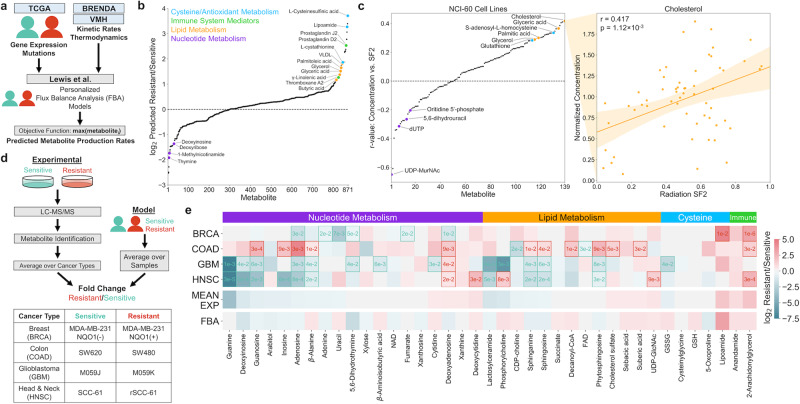
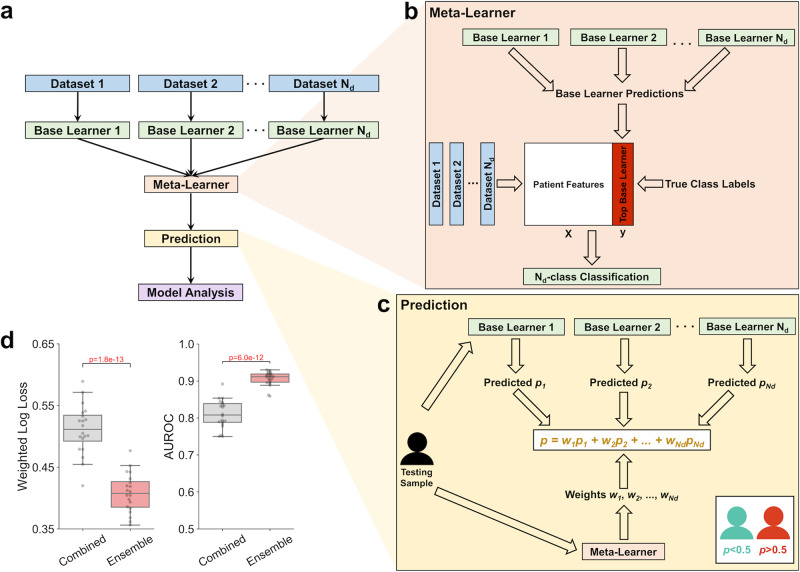
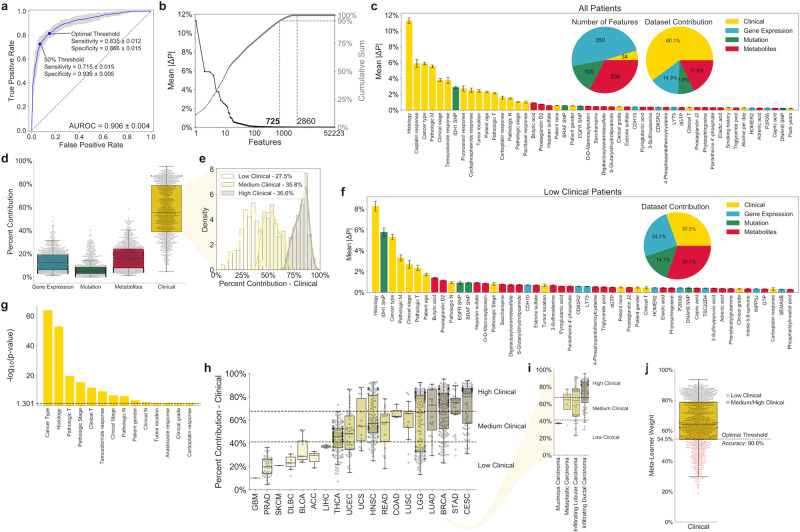
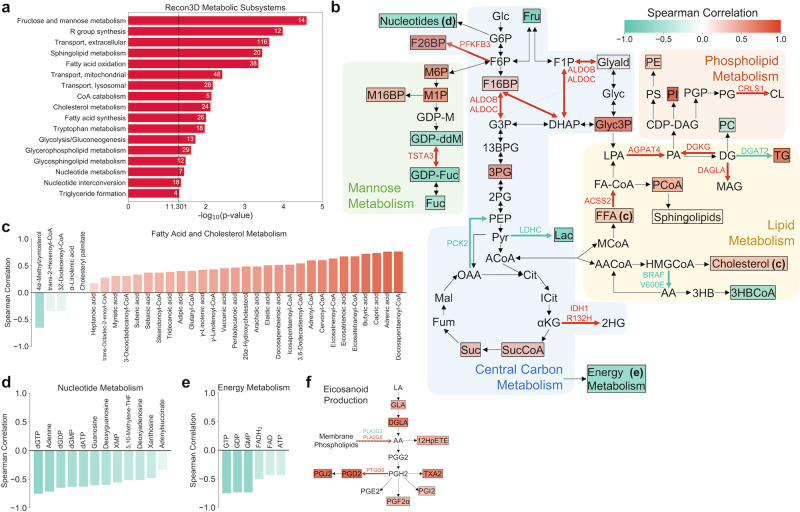
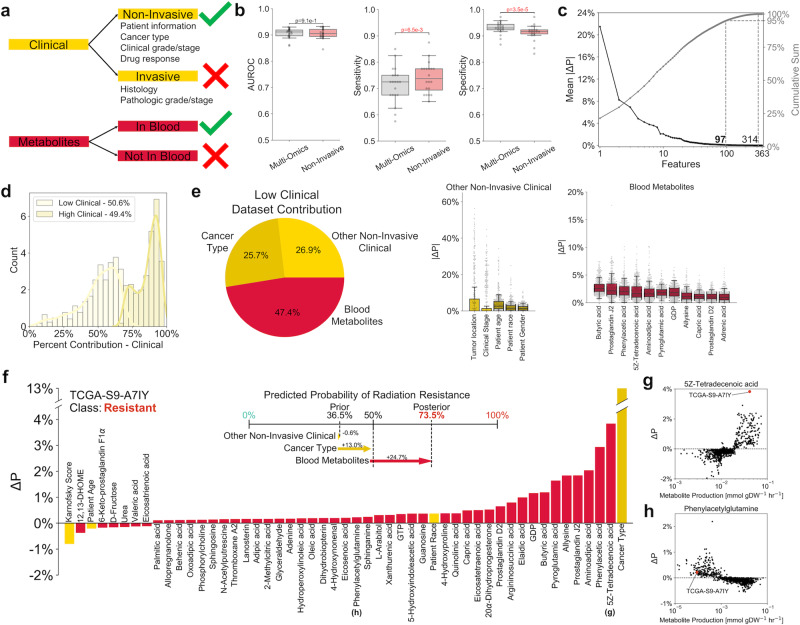
Resistance to ionizing radiation, a first-line therapy for many cancers, is a major clinical challenge. Personalized prediction of tumor radiosensitivity is not currently implemented clinically due to insufficient accuracy of existing machine learning classifiers. Despite the acknowledged role of tumor metabolism in radiation response, metabolomics data is rarely collected in large multi-omics initiatives such as The Cancer Genome Atlas (TCGA) and consequently omitted from algorithm development. In this study, we circumvent the paucity of personalized metabolomics information by characterizing 915 TCGA patient tumors with genome-scale metabolic Flux Balance Analysis models generated from transcriptomic and genomic datasets. Metabolic biomarkers differentiating radiation-sensitive and -resistant tumors are predicted and experimentally validated, enabling integration of metabolic features with other multi-omics datasets into ensemble-based machine learning classifiers for radiation response. These multi-omics classifiers show improved classification accuracy, identify clinical patient subgroups, and demonstrate the utility of personalized blood-based metabolic biomarkers for radiation sensitivity. The integration of machine learning with genome-scale metabolic modeling represents a significant methodological advancement for identifying prognostic metabolite biomarkers and predicting radiosensitivity for individual patients.


Conflict of interest statement

The authors declare no competing interests.

Figures

Fig. 1
Fig. 1. Gene expression classifier for radiation response.
a (Left, black) Mean absolute SHAP values (mean |ΔP|) for individual genes, signifying the absolute change in predicted probability of radiation resistance attributed to each feature averaged across all samples. Those features within the top 50 with previous literature suggesting a role in tumor radiation response are annotated. (Right, gray) Cumulative mean |ΔP| scores. b Performance of the identified set of 782 significant gene expression features from this study (red) versus previously identified gene sets in RadiationGeneSigDB (black), on both the (left) TCGA dataset performing a classification task on patient tumor radiation response and (right) CCLE dataset performing a regression task on cancer cell line radiation response. n = 20 training+validation/testing splits. Error bars: mean ± 1 standard error. AUROC; area under the receiver operating characteristic curve, MAE; mean absolute error, MSE; mean squared error. c Gene set enrichment analysis (GSEA) of significant features from our gene expression classifier among the Hallmarks of Cancer. Statistical test: χ2 test with Yates’ correction. d Hierarchical clustering of Hallmarks of Cancer enrichment ranks from the gene set in this study and those in RadiationGeneSigDB, based on both (row) hallmark, and (column) gene set. e GSEA of significant gene expression features among the cancer expression modules from Segal et al. Modules relevant to cellular metabolism are annotated with their number and descriptions. f GSEA of significant gene expression features among Recon3D metabolic subsystems. Significant genes within each subsystem are annotated above or below p-value value bars based on whether their expression is positively correlated with (above, green) radiation sensitivity, or (below, red) radiation resistance.
Fig. 2
Fig. 2. FBA model predictions of relative metabolite production and experimental validation between radiation-sensitive and radiation-resistant cancers.
a Multi-omics data from TCGA tumors and publicly available repositories are integrated to develop personalized FBA models and predict differences in metabolite production rates between radiation-sensitive and -resistant tumors. b Model-predicted metabolite production rates, expressed as the log2 ratio of average production between radiation-resistant versus -sensitive tumors. Metabolites within major classes with significant upregulation or downregulation in radiation-resistant tumors are color-coded and annotated. c (Left) Correlation between metabolite concentration and surviving fraction at 2 Gy radiation (SF2) among 139 experimentally measured metabolites in the NCI-60 panel of cancer cell lines. Metabolite classes are colored as in (b). (Right) Example regression between metabolite concentration and cell line SF2 for cholesterol. Orange error band: 95% confidence interval. Statistical test: one-sample correlation t-test. d (Top) Schematic showing the comparison of model-predicted metabolite production in radiation-sensitive and -resistant TCGA tumors, with experimentally measured metabolite concentrations in matched radiation-sensitive and -resistant cell lines. (Bottom) Radiation-sensitive and -resistant cell line pairs across four different cancer types used in the experimental metabolomics study (Supplementary Table 2). e Comparison of model-predicted and experimentally measured levels of individual putative metabolites within the four major classes identified in (b). BRCA, COAD, GBM, HNSC: log2 ratio of putative metabolite levels in radiation-resistant versus -sensitive cell lines. Statistically significant differences within each cell line pair are represented by box outlines and p-values. Statistical test: two-sided t-test. MEAN EXP; average experimental log2 ratio across all four cell line pairs, FBA; log2 ratio of model-predicted metabolite production rates in radiation-resistant versus -sensitive TCGA tumors.
Fig. 3
Fig. 3. Machine learning architecture for improved prediction of radiation therapy response.
a Dataset-independent ensemble architecture, with independent base learners for each dataset and one meta-learner for integration of base learner outputs. b Meta-learner performing Nd-class classification of the most accurate base learner/dataset for each sample, where Nd is the number of independent base learners/datasets. c Prediction of radiation response for each testing set sample using predicted probabilities from each base learner and weights from the meta-learner. d Performance of multi-omics classifier trained on clinical, gene expression, mutation, and FBA-predicted metabolite data from TCGA tumors, comparing the dataset-independent ensemble architecture versus combining datasets together before training on a single classifier. Weighted log loss and AUROC performance metrics are shown here, with other metrics shown in Supplementary Fig. 9. n = 20 training+validation/testing splits. Boxplots: box = 25th, 50th, and 75th percentiles, whiskers = 1.5 times the interquartile range. Statistical test: two-sided t-test.
Fig. 4
Fig. 4. Multi-omics classifier integrating clinical, gene expression, mutation, and FBA-predicted metabolite features for prediction of radiation response.
a ROC curve for multi-omics classifier, with points representing 50% threshold value and optimal Youden’s J statistic shown. Blue line: mean across n = 20 training+validation/testing splits. Blue error band: ±1 standard deviation. b (Left, black) Mean absolute SHAP values (mean |ΔP|) for individual features. (Right, gray) Cumulative mean |ΔP| values. c Top 50 features with largest mean |ΔP| values, colored based on original dataset. (Inset, Left) Number of significant features from each dataset. (Inset, Right) Relative contribution of features from each dataset to sum of total absolute SHAP values, averaged across all samples. n = 904 samples. Error bars: mean ± 1 standard error. d Relative contribution of features from each dataset to sum of total absolute SHAP values, for each individual sample. n = 904 samples. e Clustering of samples into “Low/Medium/High” clinical groups based on relative contribution of clinical dataset. Optimal number of clusters calculated based on maximizing gap statistic from k-means clustering (Supplementary Fig. 13a). f Top 50 features with largest mean |ΔP| scores among samples within “Low Clinical” cluster. (Inset) Relative contribution of features from each dataset to sum of total mean |ΔP| scores, averaged across all samples within “Low Clinical” cluster. n = 249 samples. Error bars: mean ± 1 standard error. g Statistical significance of patient clustering into “Low/Medium/High” clinical groups based on clinical factors, calculated by χ2 test with Yates’ correction. Only factors with p ≤ 0.05 are shown. h Clinical cluster and dataset contribution of samples within different cancer types. Numbers of samples in each group are provided in Supplementary Data 1. i Clinical cluster and dataset contribution of BRCA samples with different histological subtypes. Number of samples in each group are provided in Supplementary Data 1. j Prediction of clinical cluster based on meta-learner weight for the clinical dataset. Dotted line: threshold maximizing accuracy in separating “Low Clinical” from “Medium/High Clinical” clusters. n = 904 samples. All boxplots: box = 25th, 50th, and 75th percentiles, whiskers = 1.5 times the interquartile range.
Fig. 5
Fig. 5. Analysis of metabolic biomarkers from the multi-omics classifier for radiation response.
a Metabolite set enrichment analysis (MSEA) of significant metabolic features among Recon3D metabolic subsystems. The numbers of significant metabolites in each subsystem are shown. Only statistically significant (p ≤ 0.05) subsystems are shown. b Overview of significant metabolic features, as well as metabolism-related gene expression and mutation features. Different metabolic pathways are shown with colored backgrounds. Significant metabolic features are denoted by colored boxes, where the color indicates the Spearman correlation coefficient between SHAP value (ΔP) and predicted metabolite production rate across all patients (Supplementary Fig. 19). Significant gene expression and mutation features are denoted by colored reaction arrows, either in green (associated with radiation sensitivity) or in red (associated with radiation resistance). 13BPG 1,3-bisphosphoglycerate, 2HG 2-hydroxyglutarate, 2PG 2-phosphoglycerate, 3HB 3-hydroxybutyrate, 3HBCoA 3-hydroxybutyrl-CoA, 3PG 3-phosphoglycerate, αKG Alpha-ketoglutarate, AA Acetoacetate, AACoA Acetoacetyl-CoA, ACoA Acetyl-CoA, CDP-DAG CDP-diacylglycerol, Cit Citrate, CL Cardiolipin, DG Diacylglycerol, DHAP Dihydroxyacetone phosphate, F16BP Fructose 1,6-bisphosphate, F1P Fructose 1-phosphate, F26BP Fructose 2,6-bisphosphate, F6P Fructose 6-phosphate, FA-CoA Fatty acyl-CoA, FFA Free fatty acid, Fru Fructose, Fuc Fucose, Fum Fumarate, G3P Glyceraldehyde 3-phosphate, G6P Glucose 6-phosphate, GDP-ddM GDP-4-keto-6-deoxymannose, GDP-Fuc GDP-fucose, GDP-M GDP-mannose, Glc Glucose, Glyald Glyceraldehyde, Glyc3P Glycerol 3-phosphate, Gylc Glycerol, HMGCoA 3-hydroxy-3-methylglutaryl-CoA, ICit Isocitrate, Lac Lactate, LPA Lysophosphatidic acid, M16BP Mannose 1,6-bisphosphate, M1P Mannose 1-phosphate, M6P Mannose-6-phosphate, MAG Monoacylglycerol, Mal Malate, MCoA Malonyl-CoA, OAA Oxaloacetate, PA Phosphatidic acid, PC Phosphatidylcholine, PCoA Palmitoyl-CoA, PE Phosphatidylethanolamine, PEP Phosphoenolpyruvate, PG Phosphatidylglycerol, PGP Phosphatidylglycerol-phosphate, PI Phosphatidylinositol, PS Phosphatidylserine, Pyr Pyruvate, Suc Succinate, SucCoA Succinyl-CoA, TG Triglyceride. ce Spearman correlation coefficients of significant metabolic features involved in c fatty acid and cholesterol metabolism, d nucleotide metabolism, and e energy metabolism. f Metabolic pathway of eicosanoid production, highlighting significant metabolite and gene expression features. 12HpETE 12-hydroxyperoxyeicosatetraenoic acid, AA Arachidonic acid, DGLA Dihomo-γ-linolenic acid, GLA γ-linolenic acid, LA linoleic acid.
Fig. 6
Fig. 6. Non-invasive classifier integrating non-invasive clinical and blood-based metabolite features for prediction of radiation response.
a Schematic showing inclusion and exclusion criteria for features in the non-invasive classifier. b Comparison of model performance between multi-omics and non-invasive classifiers. n = 20 training+validation/testing splits. Boxplots: box = 25th, 50th, and 75th percentiles, whiskers = 1.5 times the interquartile range. Statistical test: two-sided t-test. c (Left, black) Mean absolute SHAP values (mean |ΔP|) for individual features. (Right, gray) Cumulative mean |ΔP| scores. d k-means clustering of samples into “Low” and “High” clinical groups based on the relative contribution of the clinical dataset (Supplementary Fig. 13b). e Clinical and metabolic dataset contributions among the “Low Clinical” group. Individual features with mean |ΔP| scores above 1% are shown. n = 457 samples. Boxplots: box = 25th, 50th, and 75th percentiles, whiskers = 1.5 times the interquartile range. f Breakdown of individual feature contributions toward prediction of radiation response in a representative radiation-resistant TCGA patient (TCGA-S9-A7IY). (Upper) Contribution of each dataset toward the progression from prior to posterior probability of radiation resistance. (Lower) SHAP values for this individual patient. g, h Plots of SHAP value versus predicted metabolite production rate for two metabolic features, illustrating g a feature with large individual importance score relative to other patients (significant utility as a personalized blood-based biomarker), and h a feature with small individual importance score relative to other patients (little utility as a personalized blood-based biomarker).

Similar articles

Cited by

References

    1. Therasse P, et al. New guidelines to evaluate the response to treatment in solid tumors. J. Natl Cancer Inst. 2000;92:205–216. doi: 10.1093/jnci/92.3.205. - DOI - PubMed
    1. Weinstein JN, et al. The Cancer Genome Atlas Pan-Cancer analysis project. Nat. Genet. 2013;45:1113–1120. doi: 10.1038/ng.2764. - DOI - PMC - PubMed
    1. Kim BM, et al. Therapeutic implications for overcoming radiation resistance in cancer therapy. Int J. Mol. Sci. 2015;16:26880–26913. doi: 10.3390/ijms161125991. - DOI - PMC - PubMed
    1. Vogin G, Foray N. The law of Bergonie and Tribondeau: a nice formula for a first approximation. Int J. Radiat. Biol. 2013;89:2–8. doi: 10.3109/09553002.2012.717732. - DOI - PubMed
    1. Griffin TW, et al. Predicting the response of head and neck cancers to radiation therapy with a multivariate modelling system: an analysis of the RTOG head and neck registry. Int J. Radiat. Oncol. Biol. Phys. 1984;10:481–487. doi: 10.1016/0360-3016(84)90027-0. - DOI - PubMed

Publication types

MeSH terms

Substances