. 2021 May 11;12(1):2691.
doi: 10.1038/s41467-021-23018-x.

Immune cellular networks underlying recovery from influenza virus infection in acute hospitalized patients

Affiliations

Immune cellular networks underlying recovery from influenza virus infection in acute hospitalized patients

Thi H O Nguyen et al. Nat Commun. .

Abstract

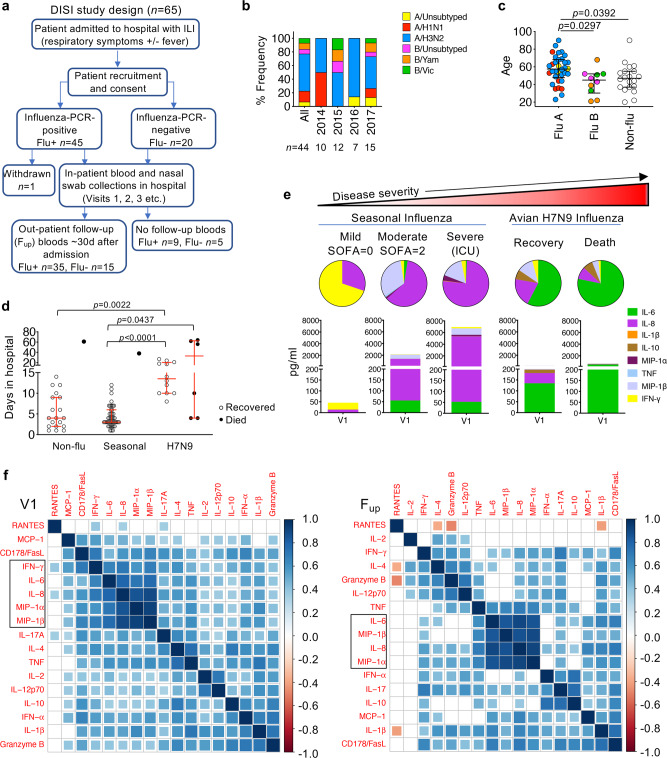
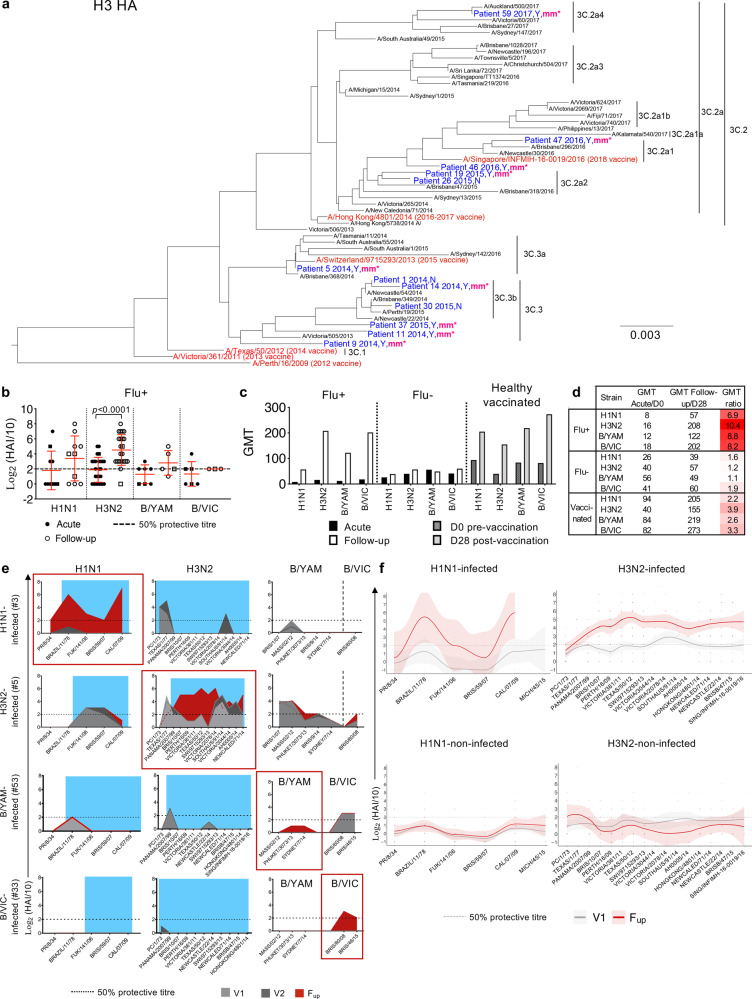
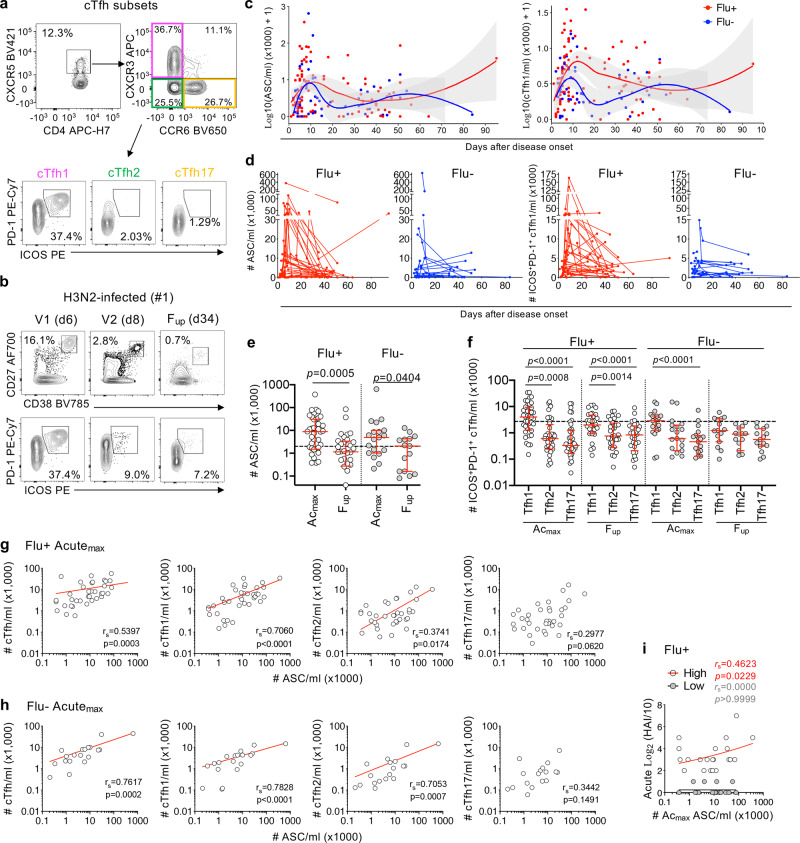
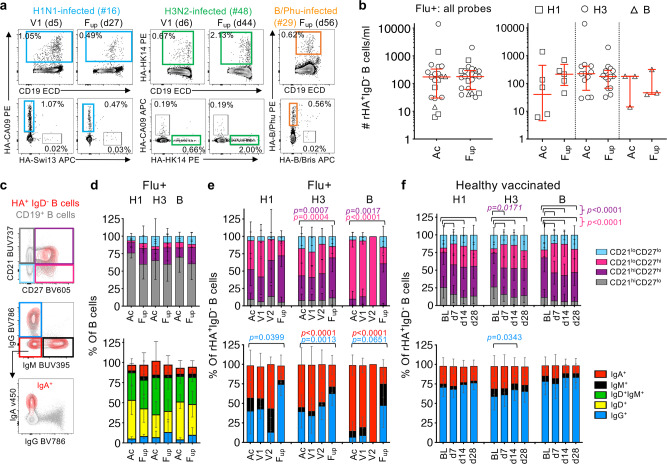
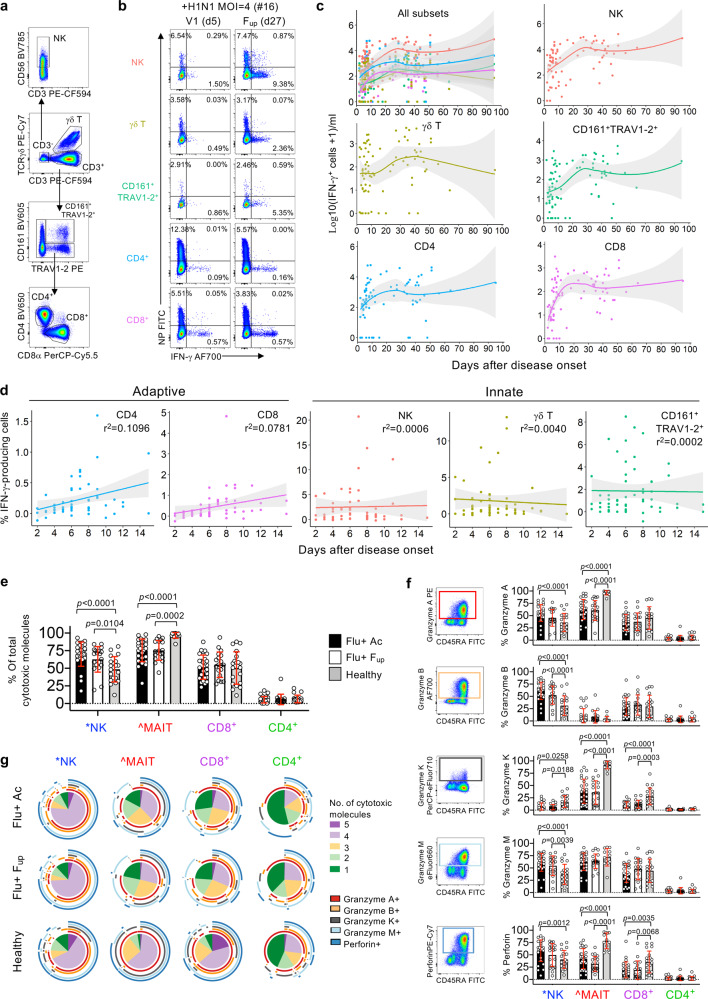
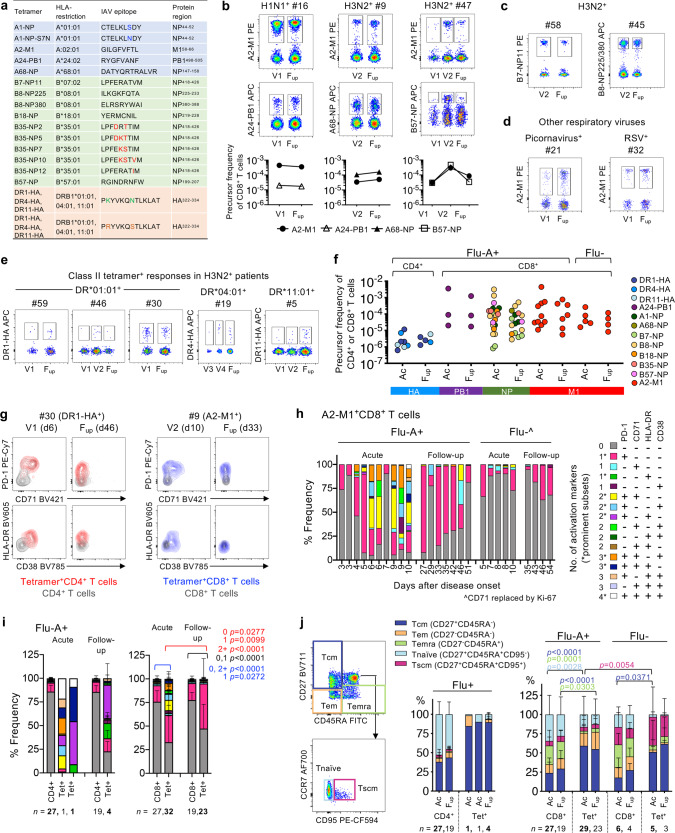
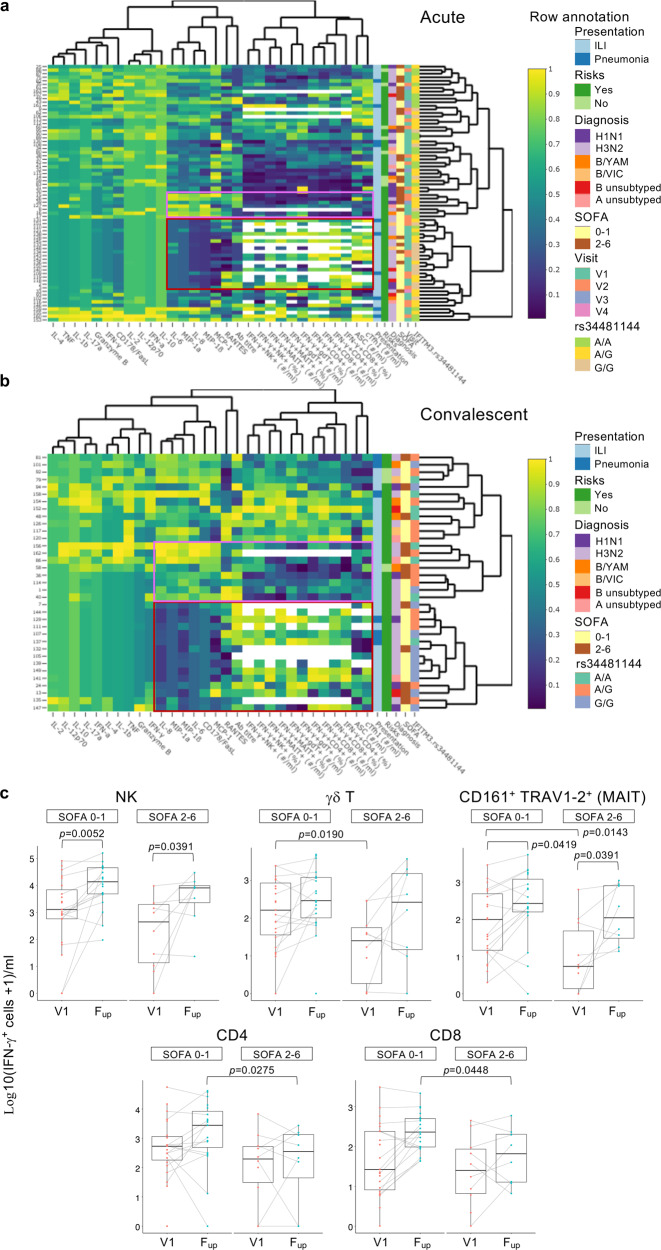
How innate and adaptive immune responses work in concert to resolve influenza disease is yet to be fully investigated in one single study. Here, we utilize longitudinal samples from patients hospitalized with acute influenza to understand these immune responses. We report the dynamics of 18 important immune parameters, related to clinical, genetic and virological factors, in influenza patients across different severity levels. Influenza disease correlates with increases in IL-6/IL-8/MIP-1α/β cytokines and lower antibody responses. Robust activation of circulating T follicular helper cells correlates with peak antibody-secreting cells and influenza heamaglutinin-specific memory B-cell numbers, which phenotypically differs from vaccination-induced B-cell responses. Numbers of influenza-specific CD8+ or CD4+ T cells increase early in disease and retain an activated phenotype during patient recovery. We report the characterisation of immune cellular networks underlying recovery from influenza infection which are highly relevant to other infectious diseases.


Conflict of interest statement

The authors declare no competing interests.

Figures

Fig. 1
Fig. 1. Cluster analysis of patient clinical information, genetic characteristics and inflammatory cytokines.
a Flow chart of study design. b Frequency of patients infected with seasonal influenza virus strains. N values are below for total and for each year. c Age distribution by influenza A (3 unsubtyped, 7 H1N1, 24 H3N2), influenza B (3 unsubtyped, 4 YAM, 3 VIC) and influenza-negative (Non-flu, Flu-) patients (n = 20). Virus strain colors match those in (b). d Days in hospital for DISI cohort and H7N9 cohort. c, d Bars indicate the median and IQR, statistical significance (0.0001 > p < 0.05) was determined using the Kruskal–Wallis test (two-tailed). e Representative serum levels and distribution of pro-inflammatory cytokines in patients, measured within the first 2–3 days of hospital admission (Visit 1, V1), with varying disease severity. f Partial correlation plots showing the degree of correlation between every chemokine/cytokine pair in influenza+ patients at V1 and Fup. The color corresponds to the correlation coefficient and the size of the colored squares correspond to the FDR-adjusted p value. Correlations that are not significant (p > 0.05) result in white boxes.
Fig. 2
Fig. 2. Viral analysis and antibody responses.
a H3N2 phylogenetic tree of HA amino acid sequences from previous WHO reference strains in black, influenza vaccine strains in red and sequences isolated from the nasal swab of 12 H3N2-infected patients in blue. Patient number is followed by the year of recruitment, yes (Y) or no (N) for prior vaccination in the year of infection, and “mm*” indicates whether the vaccine was a clade mismatch in that year. Scale bar represents the number of substitutions per site. b Antibody HAI titers of influenza+ (Flu+) patients at acute (V1 or V2) and follow-up timepoints from the relevant infected strain (H1N1 n = 10, H3N2 n = 26, B/YAM n = 7, B/VIC n = 6) (mean and SD are shown). Statistical significance (0.0001 > p < 0.05) was determined using a two-sided Mann–Whitney test between acute and follow-up per strain. c, d Geometric mean titers (GMT) per strain in influenza+ and influenza- (Flu-) patients at acute and follow-up, and from a healthy vaccinated cohort at days 0 and 28 post-vaccination. bd Both H1N1 and H3N2 titers are shown for three A/unsubtyped patients and both B/YAM/Phuket/3073/2013 and B/VIC/Brisbane/60/2008 titres are shown for three B/unsubtyped patients (square symbols). e Representative antibody landscapes from a patient infected with H1N1, H3N2, B/YAM or B/VIC virus. Blue shading indicate period of potential exposure based on the year born. f Antibody landscapes of H1N1- and H3N2-infected (n = 7 and 23, respectively) and H1N1- and H3N2-non-infected patients (n = 45 and 29, respectively). Lines and shading indicate the GMT and 95% confidence intervals, respectively. Gradient colored dots indicate individual titres.
Fig. 3
Fig. 3. Circulating Tfh cells, ASCs and influenza-specific B cell responses.
a Representative FACS plots of CD4+CXCR5+ cTfh subsets (cTfh1/2/17) and expression of activation markers PD-1 and ICOS. b Representative FACS plots of CD19+CD20-/loCD27++CD38++ ASCs and PD-1+ICOS+ activated CXCR3+CCR6 cTfh1 cells at acute (V1 and V2) and follow-up (Fup) timepoints. Days (d) after disease onset are shown in brackets. c, d Numbers of ASC and cTfh1 cells of influenza+ (Flu+, red, n=44) and influenza- (Flu-, blue, n=20) patients after disease onset. Gray shading in (c) represents 95% confidence intervals. e Numbers of the peak ASC responses during acute ILI (Acmax) versus Fup in influenza+ (open circles, Acmax n = 40, Fup n = 32) and influenza- patients (gray circles, Acmax n = 19, Fup n = 15). f Peak cTfh responses of different Tfh1/2/17 subsets at Acmax (influenza+ n = 40, influenza- n = 19) and Fup (influenza+ n = 32, influenza- n = 15) timepoints. g, h Correlation (two-tailed Spearman correlation coefficient, rs) between Acmax ASC and cTfh responses and (i) Acmax ASC responses with HAI antibody titres of high (HAI ≥ 40) and low responders (HAI < 40) during acute infection. e, f Red bars indicate the median and IQR for cell numbers. Dashed line is the median baseline level for healthy controls. Statistical significance (0.0001 > p < 0.05) was determined using the two-tailed (e) Mann–Whitney test and (f) Friedman test. gi Statistically significant p values are shown (0.0001 > p < 0.05).
Fig. 4
Fig. 4. Contrasting influenza-specific B cell responses between influenza infection and vaccination.
a Representative FACS plots of H1-, H3- and B-specific rHA+ B cells at V1 and Fup timepoints (days after disease onset in brackets). b Numbers of total rHA+ B cells and per H1-, H3- and B-specific rHA+ B cells at acute (Ac) (n = 21) and Fup timepoints (n = 22). Red bars indicate the median and IQR for cell numbers. c Representative overlay FACS plots of live total B cells and rHA+ B cells from IBV-infected patient #29 at Fup for phenotype and isotype characterization. df Phenotype (top panel) and isotype (bottom panel) distributions of (d) total B cells and (e) rHA+ B cells in influenza+ (Flu+) patients at acute (Ac = V1 and V2, V1, V2) and follow-up timepoints in comparison to (f) healthy vaccinated controls (n = 41) pre-vaccination at baseline (BL) and d7, 14 and 28 post-vaccination. df Bars indicate the mean and SD for frequencies. e, f Statistical significance (0.0001 > p < 0.05) was determined using a two-tailed Tukey’s multiple comparison test. Colored p values refer to each group legend within the graph.
Fig. 5
Fig. 5. Innate and adaptive immune responses in seasonal influenza-infected patients.
ad Data following influenza virus infection assay. a Representative FACS plots of innate (NK cells, γδ T cells and CD161+TRAV1-2+ MAIT cells) and adaptive (CD4+ and CD8+ T cells) immune cell subsets gated on live/CD14/CD19 singlet lymphocytes. b Representative FACS plots measuring frequency of infection (intracellular nucleoprotein (NP) staining) and IFN-γ production for each immune cell subset. Infection in PBMCs by intracellular NP-staining showing consistent infectivity rates over time across the donors (Supplementary Fig. 5b). MAIT cells were defined as CD161+TRAV1-2+ and were validated by the MR1-5’OP-RU-tetramer in 51% of samples (Supplementary Fig. 5c,d). c, d Numbers and frequencies (n = 37) of influenza-specific IFN-γ-production in patients’ immune cell subsets as days of disease onset where 95% confidence intervals are shaded in gray. eg Patient data from PBMCs left over from flow-through fraction following TAME. *NK cells were defined by live/CD14/CD19/CD3 cells. ^MAIT cells were defined by the MR1-5-OP-RU-tetramer and anti-TRAV1-2 antibody. e Frequency (mean, SD) of influenza+ (Flu+) patient cells expressing total cytotoxic molecules at acute (includes n = 16 at V1 and n = 11 at subsequent visits i.e., V2, V3, or V4) and follow-up timepoints (n = 19), in comparison to healthy donors (n = 20, except for MAIT subset where n = 12). f Representative FACS plots of CD8+ T cells from influenza+ patient and individual frequencies (mean, SD) of granzymes (A, B, K and M) and perforin staining for each cell subset. Dataset n numbers are the same as in (e). g Pie charts representing the average fractions of cells co-expressing different cytotoxic molecules (slices) and the combinations of granzymes and perforin molecules (arcs). Statistical significance (0.0001 > p < 0.05) was determined using two-tailed (e, f) Tukey’s multiple comparison and (g) Permutation tests.
Fig. 6
Fig. 6. Influenza-specific CD4+ and CD8+ T cell responses.
a List of influenza-specific HLA class I (A, B) and class II (DR) tetramers used in the study. b, c Concatenated FACS plots of TAME-enriched class I-tetramer+ cells gated on CD8+ T cells from influenza+ patients and (d) influenza- patients. Individual tetramer precursor frequencies are shown below for patients in (b). e Concatenated FACS plots of TAME-enriched class II-tetramer+ cells gated on CD4+ T cells from H3N2-infected patients. f Precursor frequencies of tetramer+ cells from influenza+ (Flu+) and influenza- (Flu-) patients at acute (V1, V2, V3 or V4) and follow-up timepoints. g Representative overlay FACS plots of activation markers expressed on TAME-enriched tetramer+ cells compared to their unenriched parent population. h Frequency of A2-M1+CD8+ T cells from individual influenza A+ (Flu-A+) and influenza- patients expressing different combinations of activation markers PD-1, CD38, HLA-DR and CD71, where CD71 was replaced by Ki-67 in the staining panel for influenza- patients. i Overall activation status of TAME-enriched tetramer+ cells compared to their unenriched parent population of CD4+ or CD8+ T cells in influenza+ patients. j T cell differentiation phenotype of TAME-enriched tetramer+ cells in relation to the unenriched parent population of CD4+ or CD8+ T cells. i, j Mean and SD are shown for all acute and follow-up timepoints, except for the acute tetramer+CD4+ group (n = 2), which were plotted individually. Statistical significance (0.0001>p<0.05) was determined using two-tailed Tukey’s multiple comparison test for (i) number of activation markers present (0, 1 or 2+) and (j) T cell differentiation subsets.
Fig. 7
Fig. 7. Analyses of immune responses and clinical and genetic host factors.
a,b Unsupervised heatmaps of immune, clinical and genetic parameters in influenza+ patients at (a), acute and (b), convalescent timepoints. Scale visualizes each variable using the Empirical Percentile Transformation. A value of 1 means that the measure was higher than 100% of the other samples for that measure. Each variable was transformed independently. Interactive heatmaps are shown in Supplementary Data 2–6 for influenza+, influenza- and combined datasets. Regions of low (maroon) and high (pink) cytokine clusters are boxed. c Box plots of IFN-γ-producing cells following influenza virus infection assay (n = 37), at the earliest acute (V1) and convalescent (Fup) timepoints as a function of patients’ disease severity via binned SOFA scores of 0–1 versus 2–6. Box plots represent the median (middle bar), 75% quantile (upper hinge), and 25% quantile (lower hinge), with whiskers extending 1.5 times the inter-quartile range. Nonparametric Wilcoxon rank sum test with continuity correction was used for comparisons between SOFA categories (two-tailed). Wilcoxon signed rank test (a paired test, two-tailed) was used to compare differences between V1 and Fup among the same individuals. Tests were carried out on the actual data, although plots were on a log10+1 scale for ease of visualization. Statistically significant p values are shown (0.0001>p<0.05).

References

    1. G. B. D. Influenza Collaborators. Mortality, morbidity, and hospitalisations due to influenza lower respiratory tract infections, 2017: an analysis for the Global Burden of Disease Study 2017. Lancet Respir. Med. 2019;7:69–89. doi: 10.1016/S2213-2600(18)30496-X. - DOI - PMC - PubMed
    1. Iuliano AD, et al. Estimates of global seasonal influenza-associated respiratory mortality: a modelling study. Lancet. 2018;391:1285–1300. doi: 10.1016/S0140-6736(17)33293-2. - DOI - PMC - PubMed
    1. Krammer F, et al. Influenza. Nat. Rev. Dis. Prim. 2018;4:3. doi: 10.1038/s41572-018-0002-y. - DOI - PMC - PubMed
    1. Koutsakos, M. et al. Circulating TFH cells, serological memory, and tissue compartmentalization shape human influenza-specific B cell immunity. Sci. Transl. Med. 10, eaan8405 (2018). - PubMed
    1. McMichael AJ, Gotch FM, Noble GR, Beare PA. Cytotoxic T-cell immunity to influenza. N. Engl. J. Med. 1983;309:13–17. doi: 10.1056/NEJM198307073090103. - DOI - PubMed

Publication types

MeSH terms