. 2021 May 11;12(1):2666.
doi: 10.1038/s41467-021-23004-3.

ZBP1 not RIPK1 mediates tumor necroptosis in breast cancer

Affiliations

ZBP1 not RIPK1 mediates tumor necroptosis in breast cancer

Jin Young Baik et al. Nat Commun. .

Abstract

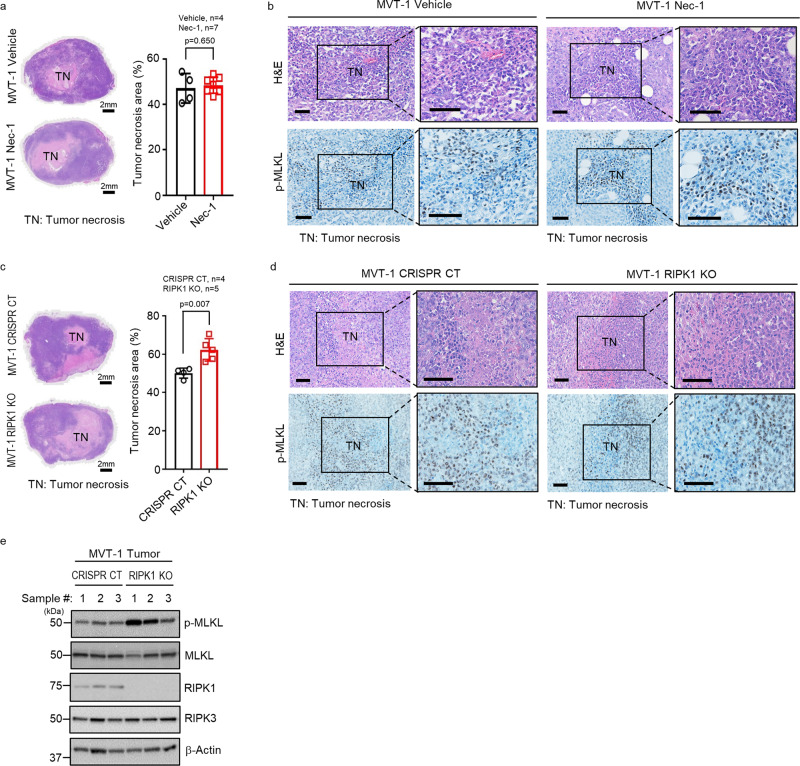
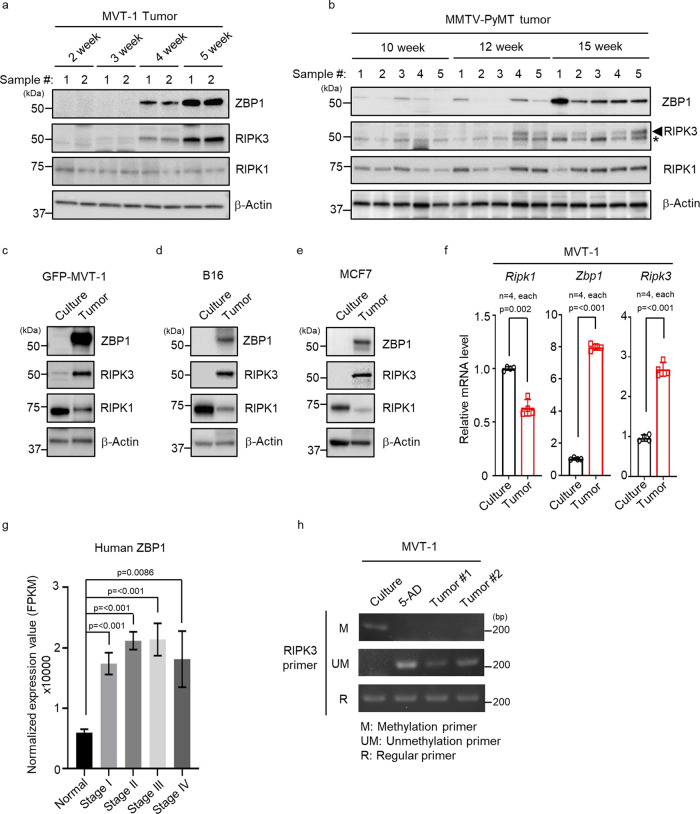
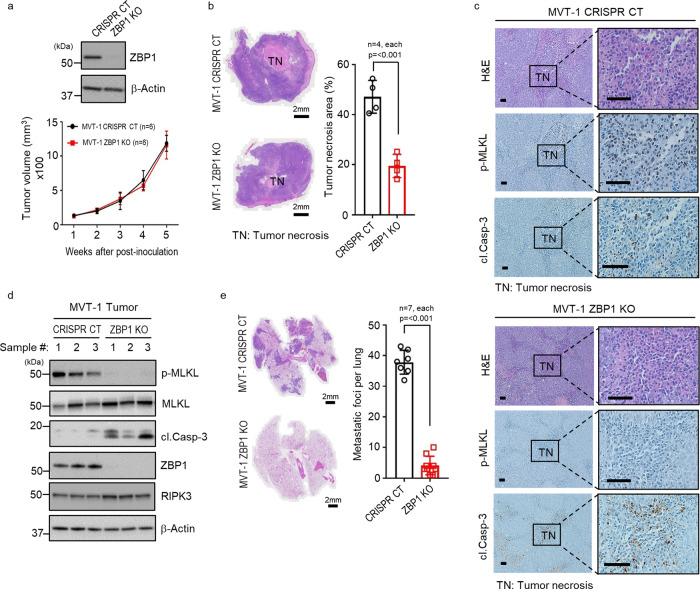
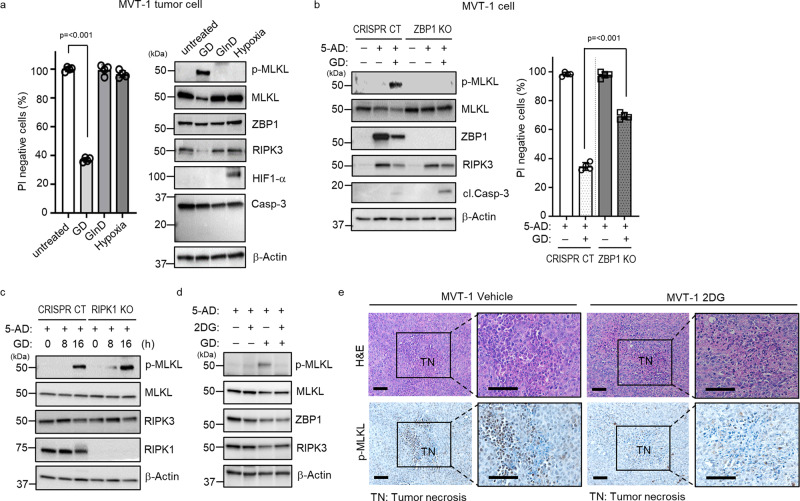
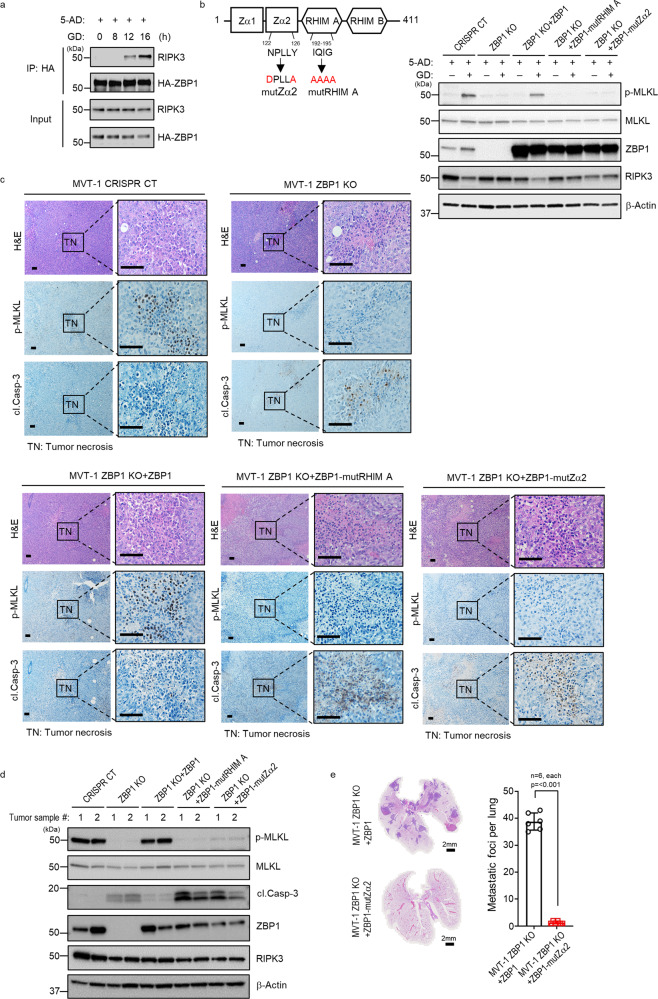
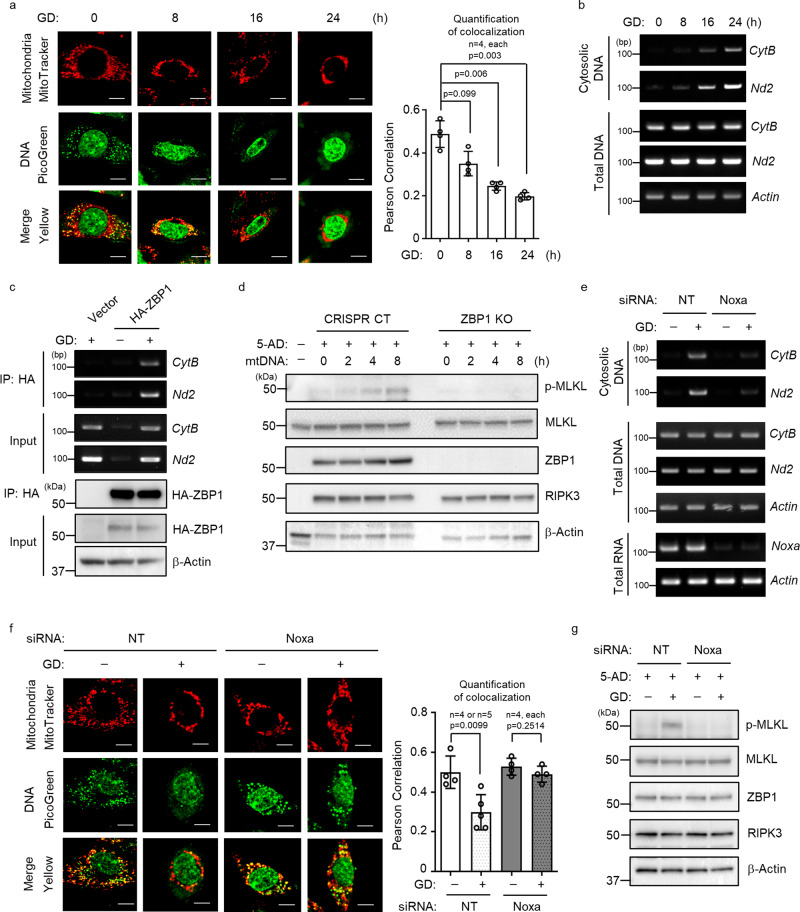
Tumor necrosis happens commonly in advanced solid tumors. We reported that necroptosis plays a major role in tumor necrosis. Although several key necroptosis regulators including receptor interacting protein kinase 1 (RIPK1) have been identified, the regulation of tumor necroptosis during tumor development remains elusive. Here, we report that Z-DNA-binding protein 1 (ZBP1), not RIPK1, mediates tumor necroptosis during tumor development in preclinical cancer models. We found that ZBP1 expression is dramatically elevated in necrotic tumors. Importantly, ZBP1, not RIPK1, deletion blocks tumor necroptosis during tumor development and inhibits metastasis. We showed that glucose deprivation triggers ZBP1-depedent necroptosis in tumor cells. Glucose deprivation causes mitochondrial DNA (mtDNA) release to the cytoplasm and the binding of mtDNA to ZBP1 to activate MLKL in a BCL-2 family protein, NOXA-dependent manner. Therefore, our study reveals ZBP1 as the key regulator of tumor necroptosis and provides a potential drug target for controlling tumor metastasis.


Conflict of interest statement

The authors declare no competing interests.

Figures

Fig. 1
Fig. 1. RIPK1 is not required for MVT-1 mammary tumor necroptosis.
a FVB/NJ mice at three weeks post-implantation with MVT-1 cells were treated weekly with vehicle or Necrostatin-1 (Nec-1; i.v.) until week 5. Left panel shows the representative images of H&E stained 5-week tumors of vehicle or Nec-1 treated mice. Scale bar, 2 mm. Right panel shows the percentage of tumor necrosis area (TN) of the total tumor area from mice at 5-week. Data are presented as mean values ± SEM. b Representative H&E and immunohistological images of phospho-MLKL (p-MLKL) antibody staining of tumor sections from mice implanted and treated as in Fig. a. Scale bar, 50 µm. c MVT-1 CRISPR/Cas9 control (CRISPR CT) or MVT-1 RIPK1 knock out (RIPK1 KO) cells were generated by using the CRISPR/Cas9 system. Left panel shows the representative H&E image of 4-week tumors from FVB/NJ mice implanted with the MVT-1 CRISPR CT or MVT-1 RIPK1 KO cells. Scale bar, 2 mm. Right panel shows the percentage of tumor necrosis area (TN) of the total tumor area after 4-weeks. Data are presented as mean values ± SEM. d Representative H&E and immunohistological images of p-MLKL antibody staining of 4-week tumor sections from mice implanted as in Fig. c. Scale bar, 50 µm. e Western blotting analysis of tumor lysates from mice implanted as in Fig. c using the indicated antibodies. Western blotting analysis representative of three independent experiments. Two-sided student’s t test was used to determine the statistical significance of differences between groups. Differences with P values < 0.05 were considered significant. Source data are provided as a Source Data file.
Fig. 2
Fig. 2. ZBP1 is highly increased in late stage of mouse and human tumors.
ae Western blotting analysis representative of three independent experiments. a MVT-1 tumors were collected at 2–5 weeks post-implantation and tumor cell lysates were analyzed by western blotting with the indicated antibodies. b MMTV-PyMT breast tumors were collected at 10–15 weeks and tumor cell lysates were analyzed by western blotting with the indicated antibodies (*, non-specific band). c GFP-MVT-1 tumor cells were collected at 5-week post implantation and the lysates were analyzed by western blotting with the indicated antibodies. d C57BL/6 J mice implanted with syngeneic B16 mouse melanoma cells and tumor cells were collected at 2-weeks post-implantation. Western blot analysis of cultured B16 cell lysates or B16 tumor cell lysates was done using the indicated antibodies. e BALB/c-nu/nu mice implanted with MCF7 human breast cancer cells and tumor cells were collected at 8-weeks post-implantation. Western blot analysis of cultured MCF7 cell lysates or MCF7 tumor cell lysates was done using the indicated antibodies. To be comparable to the late stage necrotic tumors, the tumors from these models in d and e were collected when they approached 1500–2000 mm3 in volume and had tumor necrosis. f Quantitative real-time PCR analysis of the relative expression of Ripk1 or Zbp1 or Ripk3 mRNA from cultured MVT-1 cells or MVT-1 tumor cells isolated from the mice implanted with MVT-1 cells and collected at 5 weeks (n = 4, each). Data are presented as mean values ± SEM. g Differential expression of human ZBP1 was analyzed for human breast cancer dataset (TCGA-BRCA) and performed for each tumor stage (Normal stage, n = 112; Stage I, n = 182; Stage II, n = 627; Stage III, n = 249; Stage IV, n = 20). Data are presented as mean values ± SD. h Methylation-specific PCR of genomic DNA from MVT-1 or 5-Aza-2′-deoxycytidine (5-AD), treated MVT-1 or 5-week MVT-1 tumor was detected by using methylation primer (M) or unmethylation primer (UM) or regular primer (R) for RIPK3. The PCR result is representative of three independent experiments. Two-sided student’s t test was used to determine the statistical significance of differences between groups. Differences with P values < 0.05 were considered significant. Source data are provided as a Source Data file.
Fig. 3
Fig. 3. ZBP1 is critical for tumor necroptosis and lung metastasis.
a Western blotting analysis representative of three independent experiments. MVT-1 CRISPR/Cas9 control (CRISPR CT) or ZBP1 knock out (ZBP1 KO) tumor lysates were blotted using the indicated antibodies (upper panel). Tumor growth curve by measuring tumor volume of FVB/NJ mice implanted with MVT-1 CRISPR CT or ZBP1 KO cells (lower panel). b Left panel shows the representative images of H&E stained tumors at 5-weeks post-implantation as in Fig. a. Scale bar, 2 mm. Right panel shows the percentage of tumor necrosis area (TN) of the total tumor area from mice at 5-weeks post-implantation. Data are presented as mean values ± SEM. c Representative images of H&E and immunohistological stained sections with phospho-MLKL (p-MLKL) or cleaved caspase-3 (cl.Casp-3) antibodies of 5-week tumor sections from mice implanted as in Fig. a. Scale bar, 50 µm. d Western blotting analysis is representative of three independent experiments. 5-week tumor lysates from mice implanted as in Fig. a was determined by using the indicated antibodies. e Left panel shows the representative images of H&E stained lung sections from mice implanted as in Fig. a showing lung metastasis. Scale bar, 2 mm. Right panel shows the quantification of metastatic foci in lungs from mice at 5-week post-implantation. Data are presented as mean values ± SEM. Two-sided student’s t test was used to determine the statistical significance of differences between groups. Differences with P values < 0.05 were considered significant. Source data are provided as a Source Data file.
Fig. 4
Fig. 4. Glucose deprivation (GD) induces tumor necroptosis in vitro and in vivo.
a Primary MVT-1 tumor cells were isolated at 5 weeks post-implantation and treated for 36 h with 0.5 mM glucose (GD) or 0.1 mM glutamine (GlnD) or 0.1% O2 (hypoxia) and cell death was determined by PI staining using flow cytometry (left panel, n = 4 biologically independent samples, each) or representative of three independent experiments analyzed by western blotting using the indicated antibodies (right panel). Data are presented as mean values ± SEM. b Representative of three independent western blotting analysis. MVT-1 CRISPR CT or MVT-1 ZBP1 KO cells were treated with 5-Aza-2′-deoxycytidine (5-AD), for 3 days, followed by GD condition for 24 h (left panel) and determined by using the indicated antibodies. Cell death analysis of the cells treated with 5-AD for 3 days, followed by GD condition for 30 h, was determined by PI staining using flow cytometry (right panel, n = 4 biologically independent samples, each). Data are presented as mean values ± SEM. c Representative of three independent western blotting analysis. MVT-1 CRISPR CT or MVT-1 RIPK1 KO cells were treated with 5-AD for 3 days, followed by GD condition for the indicated time points and determined by using the indicated antibodies. d Representative of three independent western blotting analysis. MVT-1 cells were treated with 5-AD for 3 days, followed by treatment with 2-Deoxy-D-glucose (2DG) and determined by using the indicated antibodies. e FVB/NJ mice at three weeks post-implantation with MVT-1 cells were treated with vehicle or 2DG (i.p.) daily until week 5. Representative images of H&E and immunohistological stained sections with phospho-MLKL (p-MLKL) antibody. Scale bar, 50 µm. Two-sided student’s t test was used to determine the statistical significance of differences between groups. Differences with P values < 0.05 were considered significant. Source data are provided as a Source Data file.
Fig. 5
Fig. 5. The Z-DNA binding domain 2 (Zα2) of ZBP1 is critical for mediating tumor necroptosis.
a Immunoprecipitation and western blotting analysis representative of three independent experiments. MVT-1 cells stably overexpressing HA-ZBP1 were treated with 5-Aza-2′-deoxycytidine (5-AD), for 3 days followed by glucose deprivation (GD) condition for the indicated time points. Cell lysates were immunoprecipitated with HA antibody and the immunoprecipitated complexes were immunoblotted. b Structure of mouse ZBP1 protein indicating the strategy for RHIM A mutant or Zα2 mutant (left panel). Western blot analysis representative of three independent experiments of MVT-1 ZBP KO cells transfected with reconstituted WT ZBP1 or RHIM A mutant or Zα2 mutant. The transfected cells were then treated with 5-AD for 3 days, followed by GD condition for 24 h, by using the indicated antibodies (right panel). c FVB/NJ mice were implanted with the MVT-1 CRISPR CT or MVT-1 ZBP1 KO or ZBP1 KO reconstituted with WT ZBP1 or RHIM A mutant or Zα2 mutant protein. Representative images of H&E and immunohistological stained sections with phospho-MLKL (p-MLKL) or cleaved caspase 3 (cl.Casp-3) antibody of each tumors. Scale bar, 50 µm. d Western blotting analysis representative of three independent experiments of 5-week tumor lysates from mice implanted as in Fig. c. The tumor lysates were determined by using the indicated antibodies. e FVB/NJ mice were implanted with the MVT-1 ZBP1 KO cells reconstituted with WT ZBP1 or Zα2 mutant protein. Left panel shows the representative images of H&E stained lung sections from mice showing lung metastasis. Scale bar, 2 mm. Right panel shows the quantification of the metastatic foci in lungs from mice at 5-week post-implantation. Data are presented as mean values ± SEM. Two-sided student’s t test was used to determine the statistical significance of differences between groups. Differences with P values < 0.05 were considered significant. Source data are provided as a Source Data file.
Fig. 6
Fig. 6. Glucose deprivation (GD) promotes mitochondrial DNA release and triggers necroptosis.
a Confocal microscopy analysis of MVT-1 cells under GD condition and stained with MitoTracker (red) and PicoGreen (green) for DNA. (Scale bar, 5 µm; left panel). Quantification of colocalization of MitoTracker and PicoGreen staining using Image J software (right panel). Data are presented as mean values ± SEM. b Cytosolic fractions isolated from an equal number of MVT-1 cells under GD condition for the indicated time points were analyzed by PCR for mitochondrial CytB and Nd2. This PCR is representative of three independent experiments. c MVT-1 stably overexpressing HA-tagged ZBP1 were treated with GD. HA-ZBP1 was pulled down by Immunoprecipitation (IP) with anit-HA antibody from the cytosolic fraction, followed by PCR for mitochondrial CytB and Nd2. This PCR and IP are representative of three independent experiments. d MVT-1 cells were treated with 5-Aza-2′-deoxycytidine (5-AD), for 3 days and were then transfected with mitochondrial DNA (mtDNA, isolated from cytosol of cells under GD condition) for the indicated time and analyzed by western blotting using the indicated antibodies. This blot is representative of three independent experiments. e Cytosolic fractions isolated from an equal number of MVT-1 cells transfected with non-targeting siRNA (NT) or siRNA targeting Noxa (siNoxa), followed by GD condition, were analyzed by PCR for mitochondrial CytB and Nd2. This PCR is representative of three independent experiments. f Cells from Fig. e were stained with MitoTracker (red) and PicoGreen (green) as in Fig. a and analyzed by confocal microscopy (Scale bar, 5 µm; left panel). Quantification of colocalization of MitoTracker and PicoGreen staining was performed using Image J software (right panel, n = 4 or 5 biologically independent samples). Data are presented as mean values ± SEM. g MVT-1 cells were transfected with NT or siNoxa as in Fig. e and further treated with 5-AD for 3 days, followed by GD condition for 16 h and the lysates were then analyzed by western blotting using the indicated antibodies. This blot is representative of three independent experiments. Two-sided Student’s t test was used to determine the statistical significance of differences between groups. Differences with P values < 0.05 were considered significant. Source data are provided as a Source Data file.

References

    1. Galluzzi L, et al. Molecular mechanisms of cell death: recommendations of the Nomenclature Committee on Cell Death 2018. Cell Death Differ. 2018;25:486–541. doi: 10.1038/s41418-017-0012-4. - DOI - PMC - PubMed
    1. Green DR. The coming decade of cell death research: five riddles. Cell. 2019;177:1094–1107. doi: 10.1016/j.cell.2019.04.024. - DOI - PMC - PubMed
    1. Galluzzi L, Kroemer G. Necroptosis: a specialized pathway of programmed necrosis. Cell. 2008;135:1161–1163. doi: 10.1016/j.cell.2008.12.004. - DOI - PubMed
    1. Christofferson DE, Yuan J. Necroptosis as an alternative form of programmed cell death. Curr. Opin. Cell Biol. 2010;22:263–268. doi: 10.1016/j.ceb.2009.12.003. - DOI - PMC - PubMed
    1. Wallach D, Kang TB, Dillon CP, Green DR. Programmed necrosis in inflammation: toward identification of the effector molecules. Science. 2016;352:aaf2154. doi: 10.1126/science.aaf2154. - DOI - PubMed

Publication types

MeSH terms

Substances