. 2021 May 11;11(1):9924.
doi: 10.1038/s41598-021-89336-8.

Hypoperfusion of the infrapatellar fat pad and its relationship to MRI T2* relaxation time changes in a 5/6 nephrectomy model

Affiliations

Hypoperfusion of the infrapatellar fat pad and its relationship to MRI T2* relaxation time changes in a 5/6 nephrectomy model

Guo-Shu Huang et al. Sci Rep. .

Abstract

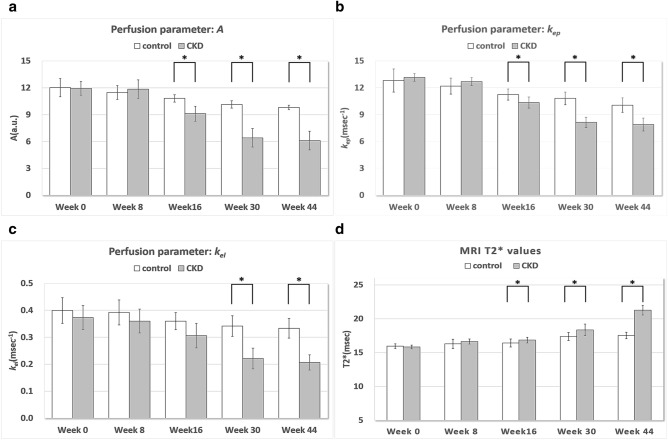
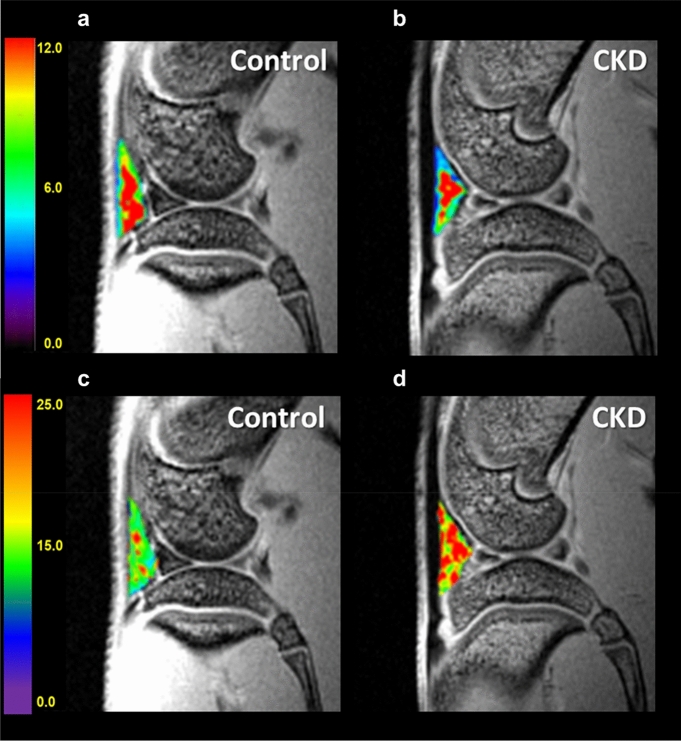
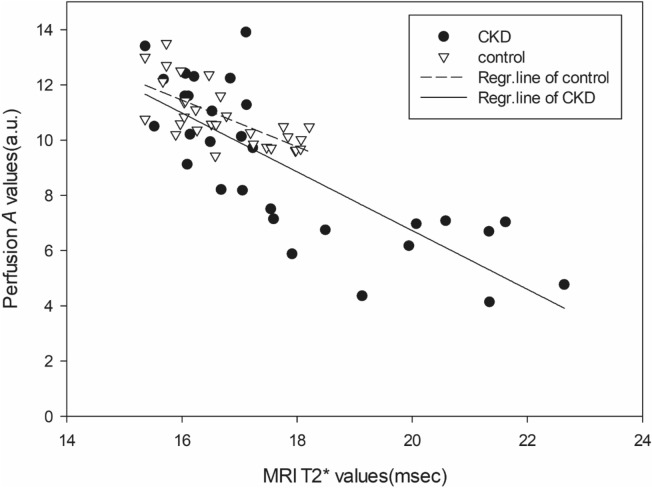
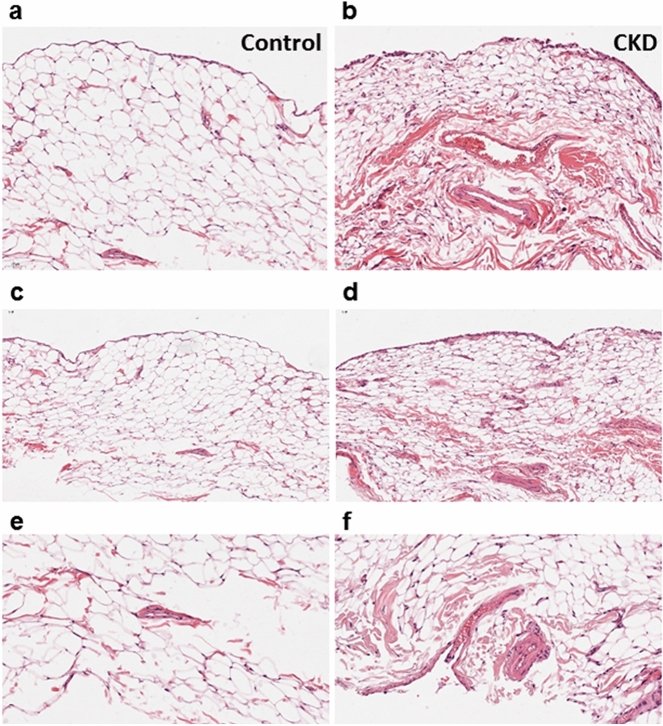
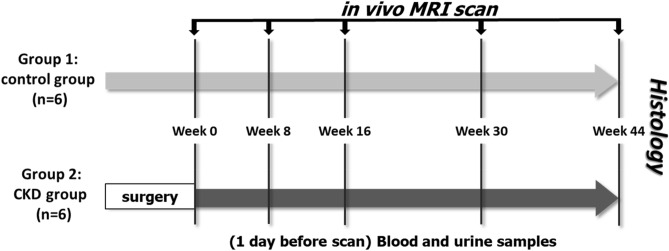
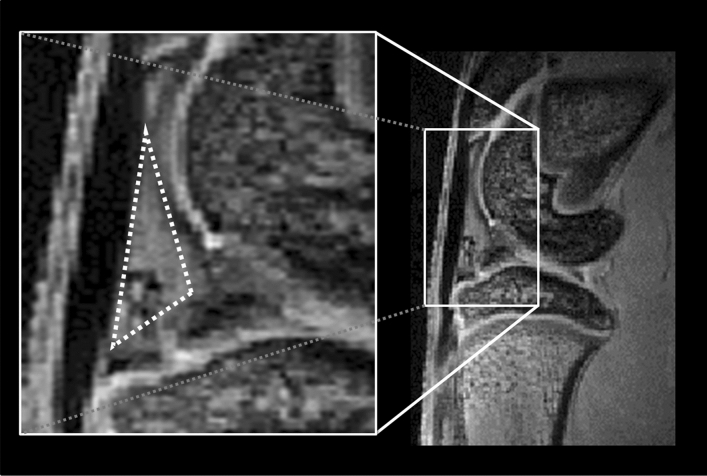
The purpose of present study was to longitudinally investigate the alterations in infrapatellar fat pad (IPFP) vascularity in 5/6 nephrectomized rats by using dynamic contrast enhanced (DCE) MRI and IPFP degeneration by using MRI T2* relaxation time. Twelve male Sprague-Dawley rats were assigned to a control group and a 5/6 nephrectomy CKD group. The right knees of all rats were longitudinally scanned by 4.7 T MRI, and serial changes in the IPFP were assessed at 0, 8, 16, 30, and 44 weeks by DCE-MRI (parameters A, kel and kep) and MRI T2* mapping. After MRI measurements, knee specimens were obtained and evaluated histologically. The CKD group had IPFPs with lower blood volume A and lower permeability kep values from 16 weeks (p < 0.05), lower venous washout kel value from 30 weeks (p < 0.001), and significantly higher T2* values reflecting adipocyte degeneration beginning at 16 weeks (p < 0.05). The histopathological results confirmed the MRI findings. Hypoperfusion and adipocytes degeneration related to CKD were demonstrated in a rodent 5/6 nephrectomy model. DCE parameters and MRI T2* can serve as imaging biomarkers of fat pad degeneration during CKD progression.


Conflict of interest statement

The authors declare no competing interests.

Figures

Figure 1
Figure 1
Bar charts showing the three perfusion parameters and MRI T2* values for IPFP of the control and CKD groups. The perfusion parameters (a) A (unit: a.u.), (b) kep (unit: min−1), and (c) kel (unit: min−1) and the MRI T2* value (d) were measured in all rats at weeks 0, 8, 16, 30, and 44. Asterisks indicate significant differences (p < 0.05). Regarding (a) and (b) respectively perfusion parameters A (blood volume) and kep (permeability), significantly decreasing values can be found from week 16 to 44 in the CKD group. Regarding wash out parameter kel (c), decreasing values were observed at 30 and 44 weeks. (d) MRI T2* values were significantly higher from week 16 to 44 in the CKD group (p < 0.05).
Figure 2
Figure 2
The demonstrated perfusion parameter A and MRI T2* maps of infrapatellar fat pad in control and CKD rats. The DCE-MRI (amplitude A) maps of infrapatellar fat pad in both groups. The color-coded images show significant hypo-perfusion in the CKD group (b) as compared to the control group (a), especially in the outer margin. Compared to the control group (c), the CKD group (d) had significantly higher T2* values (p < 0.05).
Figure 3
Figure 3
The correlation of perfusion parameter A (a.u.) and MRI-T2* value (msec) in control rats (inverted triangles) and CKD rats (black circles). All symbols represent measurements made in the right knee joint. Correlations between perfusion parameter A values and MRI-T2* values in the IPFP were significantly negative in the control and CKD groups (p < 0.001). The CKD group, compared to control group, had a higher negative correlation coefficient (ρ =  − 0.815) between perfusion parameter A and MRI-T2* (p < 0.001).
Figure 4
Figure 4
Histopathological staining of the infrapatellar fat pad in the control and CKD groups. A relatively increased vessel wall thickness of infrapatellar fat pad can be observed in the CKD group (b) as compared to control group (a). While fat pad tissues in the control group (c, e) have a relatively normal appearance, in the CKD group (d, f), they exhibit adipocyte degeneration with myxoid change. [(ad) × 200, (e,f) × 400].
Figure 5
Figure 5
Flow chart of the experimental design. In vivo MRI scan (including DCE-MRI and MRI-T2*) was performed in Groups 1 and 2 at week 0, 8, 16, 30, and 44 after surgery in Group 2, indicated by arrows. At week 44, all rats were sacrificed and underwent histological analyses.
Figure 6
Figure 6
The selection of a ROI in the infrapatellar fat pad. The infrapatellar fat pad ROIs in DCE-MRI and MRI T2* were positioned using the sagittal image with the largest fat pad available. A triangular ROI under the infrapatellar tendon and near the anterior femur and tibial plateau was drawn manually without including the anterior horn of the meniscus of the knee joint.

References

    1. Townsend RR. Arterial stiffness and chronic kidney disease: lessons from the Chronic Renal Insufficiency Cohort study. Curr. Opin. Nephrol. Hypertens. 2015;24:47–53. doi: 10.1097/MNH.0000000000000086. - DOI - PMC - PubMed
    1. Lilitkarntakul P, et al. Blood pressure and not uraemia is the major determinant of arterial stiffness and endothelial dysfunction in patients with chronic kidney disease and minimal co-morbidity. Atherosclerosis. 2011;216:217–225. doi: 10.1016/j.atherosclerosis.2011.01.045. - DOI - PubMed
    1. Bardin T. Musculoskeletal manifestations of chronic renal failure. Curr. Opin. Rheumatol. 2003;15:48–54. doi: 10.1097/00002281-200301000-00009. - DOI - PubMed
    1. García-Ramiro S, et al. Total hip arthroplasty in hemodialysis and renal transplant patients. Hip Int. 2008;18:51–57. doi: 10.1177/112070000801800110. - DOI - PubMed
    1. Duncan IJ, et al. Premature development of erosive osteoarthritis of hands in patients with chronic renal failure. Ann. Rheum. Dis. 1990;49:378–382. doi: 10.1136/ard.49.6.378. - DOI - PMC - PubMed

Publication types