Comparative Study
. 2021 May 11;11(1):9978.
doi: 10.1038/s41598-021-89140-4.

Proteome and transcriptome analyses of wheat near isogenic lines identifies key proteins and genes of wheat bread quality

Affiliations
Comparative Study

Proteome and transcriptome analyses of wheat near isogenic lines identifies key proteins and genes of wheat bread quality

Liangjie Lv et al. Sci Rep. .

Abstract

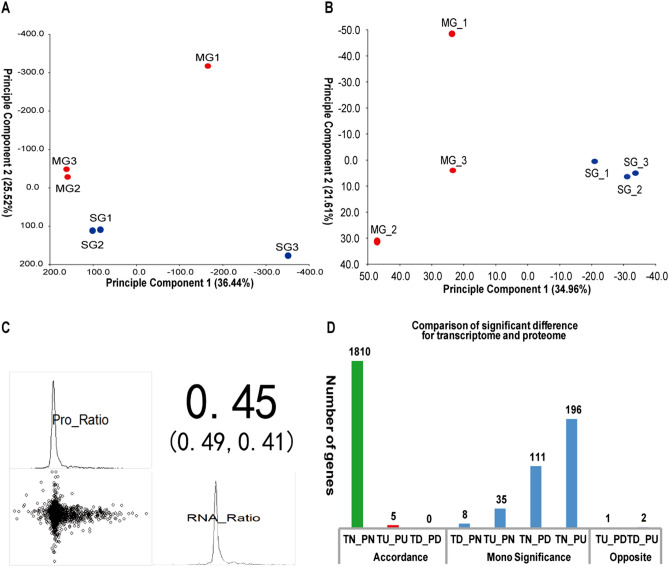
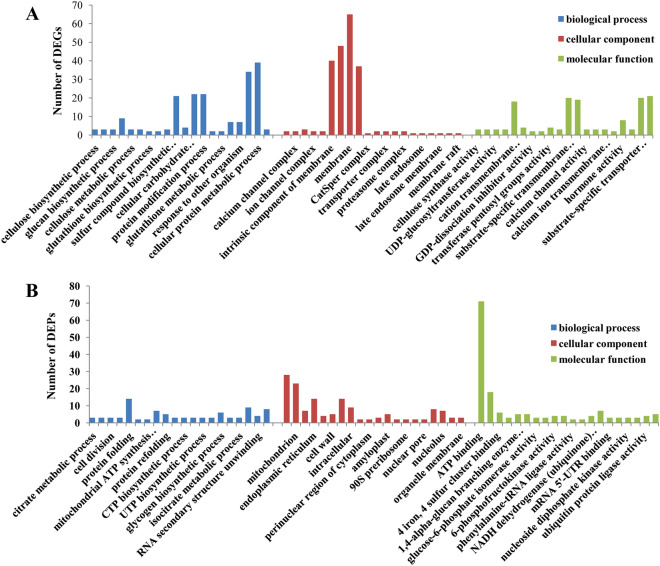
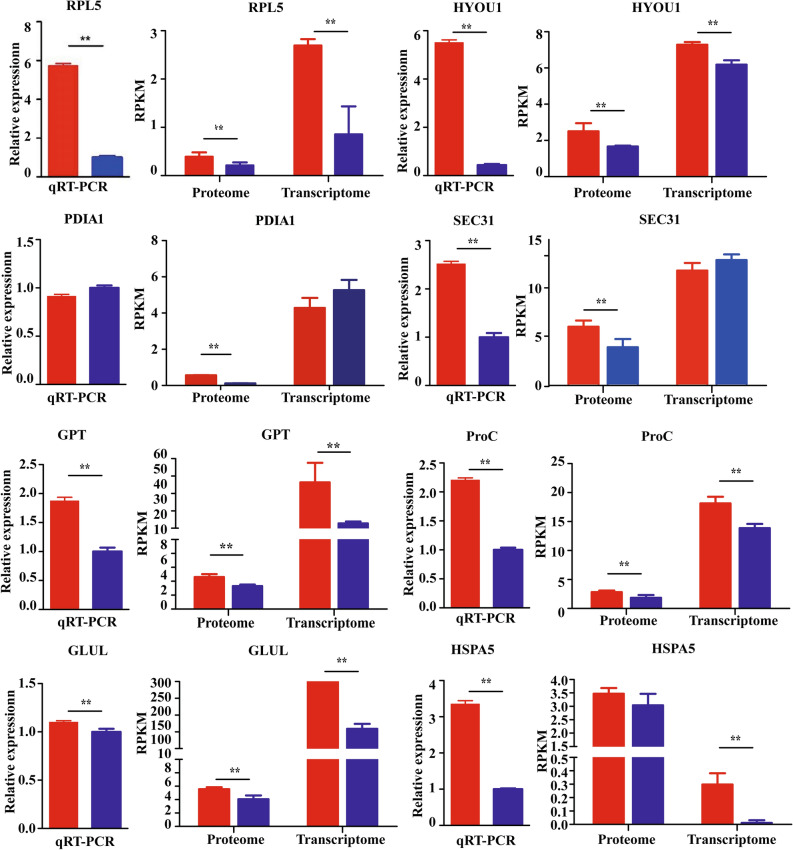
The regulation of wheat protein quality is a highly complex biological process involving multiple metabolic pathways. To reveal new insights into the regulatory pathways of wheat glutenin synthesis, we used the grain-filling period wheat grains of the near-isogenic lines NIL-723 and NIL-1010, which have large differences in quality, to perform a combined transcriptome and proteome analysis. Compared with NIL-1010, NIL-723 had 1287 transcripts and 355 proteins with significantly different abundances. Certain key significantly enriched pathway were identified, and wheat quality was associated with alanine, aspartate and glutamate metabolism, nitrogen metabolism and alpha-linolenic acid metabolism. Differentially expressed proteins (DEPs) or Differentially expressed genes (DEGs) in amino acid synthesis pathways were upregulated primarily in the glycine (Gly), methionine (Met), threonine (Thr), glutamic acid (Glu), proline (proC), cysteine (Cys), and arginine (Arg) synthesis and downregulated in the tryptophan (trpE), leucine (leuC), citrulline (argE), and ornithine (argE) synthesis. Furthermore, to elucidate changes in glutenin in the grain synthesis pathway, we plotted a regulatory pathway map and found that DEGs and DEPs in ribosomes (RPL5) and the ER (HSPA5, HYOU1, PDIA3, PDIA1, Sec24, and Sec31) may play key roles in regulating glutenin synthesis. The transcriptional validation of some of the differentially expressed proteins through real-time quantitative PCR analysis further validated the transcriptome and proteomic results.


Conflict of interest statement

The authors declare no competing interests.

Figures

Figure 1
Figure 1
(A) Principal component analysis at the transcriptome level. SG-gene represents genes of NIL-723, MG-gene represents genes of NIL-1010, SG-protein represents proteins of NIL-723, MG-protein represents proteins of NIL-1010. (B) Principal component analysis at the proteome level. (C) The correlation analysis of abundance changes from transcriptome to proteome. Expression values were normalized by z-scoring, and the Pearson correlation coefficient was calculated for all genes with corresponding proteins identified in 723 and1010. (D) Comparison of significant differences between the transcriptome and proteome. T: transcript; P: protein species; N: no change; U: up-regulation; D: down-regulation. Accordance represents a consistent changing trend between the transcriptome and proteome; Mono significance represents mono-significant differences between the transcriptome and proteome; opposite represents that the transcriptome and proteome have opposite changing trends. plot generated using the ‘ggplot2’ packages in R,.
Figure 2
Figure 2
Venn diagram of transcriptome and proteome between NIL-723 and NIL-1010. The numbers in parentheses showed percentages concerning the total up-regulated and down-regulated. SG-gene represents genes of NIL-723, MG-gene represents genes of NIL-1010, SG-protein represents proteins of NIL-723, MG-protein represents proteins of NIL-1010. Veen diagram was generated usingInteractiVenn (http://www.interactivenn.net).
Figure 3
Figure 3
(A) GO categories for significantly differentially expressed genes in the transcriptome. (B) GO categories for significantly differentially abundant protein species in the proteome. Color panels highlight the three GO terms in this study, and the bar graph represents the unigene and protein number. plot generated using the ‘ggplot2’ packages in R,.
Figure 4
Figure 4
Gene pathway analysis of combined transcriptome and proteome analyses. (A) All genes, (B) Up-regulated genes, (C) Down-regulated genes. The sizes of the dots represent the gene numbers of each row, and p values were calculated from hypergeometric tests. plot generated using the ‘ggplot2’ packages in R,.
Figure 5
Figure 5
Protein–protein interaction network of protein species that are differentially accumulated between NIL-723 and NIL-1010. A green background indicates down-regulation of protein species, a red background indicates up-regulated protein species. The networks between NIL-723 and NIL-1010 were visualized with Cytoscape software (version 2.8.2, https://cytoscape.org/).
Figure 6
Figure 6
Abundance patterns of transcripts and protein species involved in the biosynthesis of amino acids of NIL-723 and NIL-1010. White characters with a green background represent genes, whereas white characters with a blue background represent protein species. For each gene or protein, the blocks represent expression levels in replications 1, 2, 3 of SG and MG from left to right. The expression value was log2 transformed. Red represents up-regulated and green represents down-regulated. The KEGG pathway was obtained from the Kanehisa Laboratory (www.kegg.jp/kegg/kegg1.html).
Figure 7
Figure 7
Abundance patterns of transcripts and protein species involved in protein assembly and processing of NIL-723 and NIL-1010. White characters with a green background represent genes, whereas white characters with a blue background represent protein species. For each gene or protein, the blocks represent expression levels in replications 1, 2, 3 of SG and MG from left to right. The expression value was log2 transformed. Red represents up-regulated and green represents down-regulated. The whole path was drawed by software Adobe illustrator (AI, CC 2019, https://www.adobe.com).
Figure 8
Figure 8
Relative transcript expression of selected differentially expressed proteins and genes identified through combined analysis. Relative expression of each gene was normalized with the actin signal. Red bars represent NIL-723, and blue bars represent NIL-1010. RPL5, ribosomal protein L5; HYOU1, hypoxia up-regulated 1; PDIA1, Protein disulfide-isomerase A1; SEC31, COPII coat complex component secretory31; GPT, glutamic-pyruvic transaminase; ProC, proline C; GLUL, glutamate-ammonia ligase; HSPA5, heat shock 70 kDa protein 5. Bars indicate means ± standard deviations (SDs) of at least three independent biological replicates. Two asterisks indicate a significant difference at p < 0:01. Statistical analysis was performed with SPSS Statistics 26.0 software (https://www.ibm.com/products/spss-statistics).

Similar articles

Cited by

References

    1. Shewry PR, Hey SJ. The contribution of wheat to human diet and health. Food Energy Secur. 2015;4(3):178–202. doi: 10.1002/fes3.64. - DOI - PMC - PubMed
    1. Hu JX, Wang J, Deng X, Yan YM. Cloning and characterization of special HMW glutenin subunit genes from Aegilops longissima L. and their potential for wheat quality improvement. 3 Biotech. 2019;9(7):267. doi: 10.1007/s13205-019-1803-8. - DOI - PMC - PubMed
    1. Jiang PH, et al. Effects of high-molecular-weight glutenin subunit combination in common wheat on the quality of crumb structure. J. Sci. Food Agric. 2019;4(99):1501–1508. doi: 10.1002/jsfa.9323. - DOI - PubMed
    1. Noorfarahzilah M, et al. Applications of composite flour in development of food products. Int. Food Res. J. 2014;21(6):2061–2074.
    1. Wang P, Jin ZY, Xu XM. Physicochemical alterations of wheat gluten proteins upon dough formation and frozen storage- A review from gluten, glutenin and gliadin perspectives. Trends Food Sci. Technol. 2015;46(2):189–198. doi: 10.1016/j.tifs.2015.10.005. - DOI

Publication types

LinkOut - more resources