. 2021 May 11;11(1):10002.
doi: 10.1038/s41598-021-89404-z.

A novel thermostable beetle luciferase based cytotoxicity assay

Affiliations

A novel thermostable beetle luciferase based cytotoxicity assay

Sunju Choi et al. Sci Rep. .

Abstract

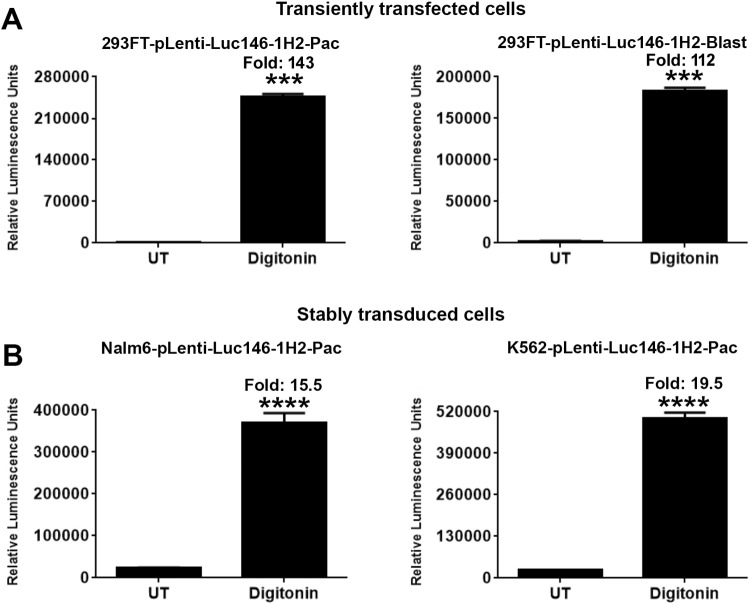
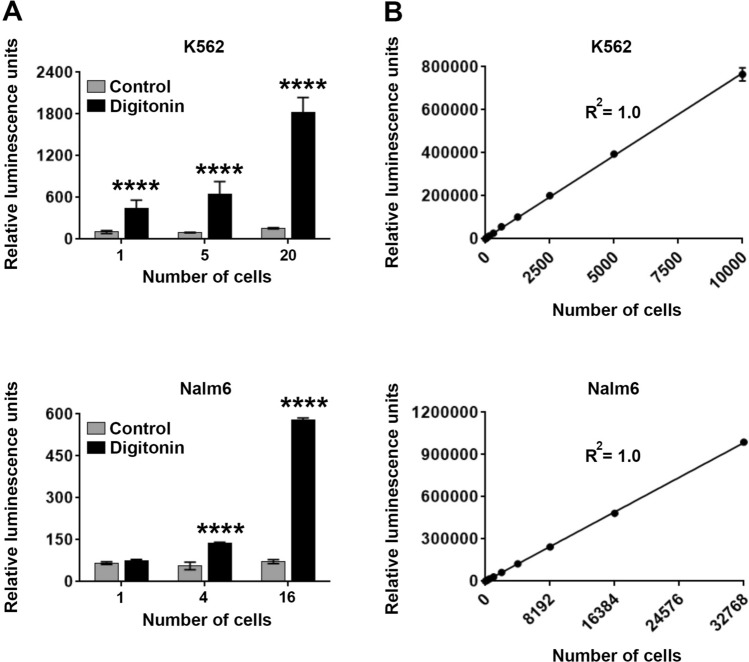
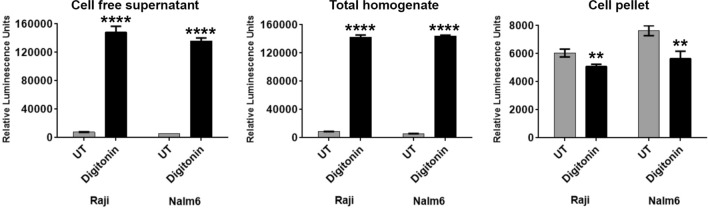
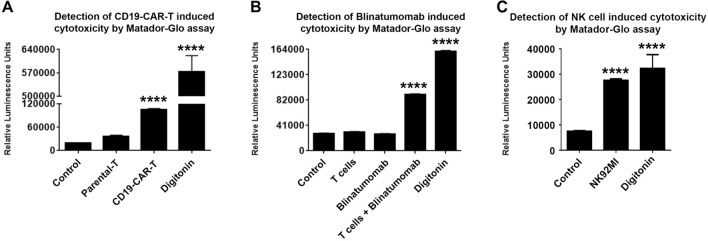
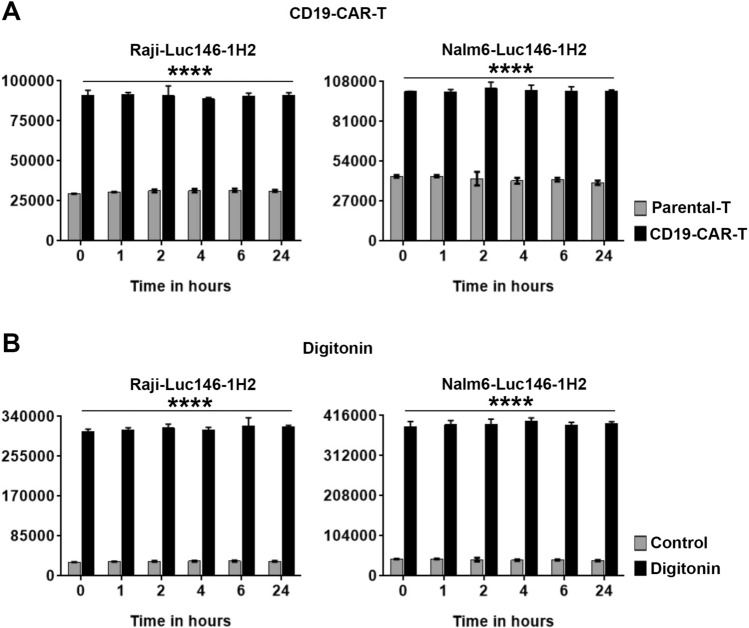
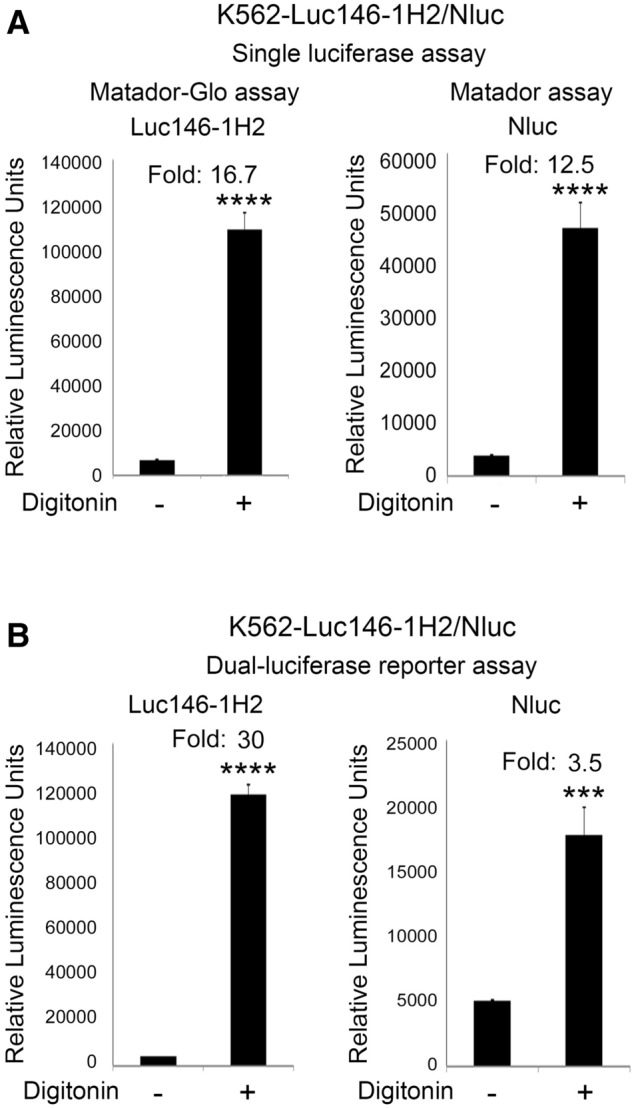
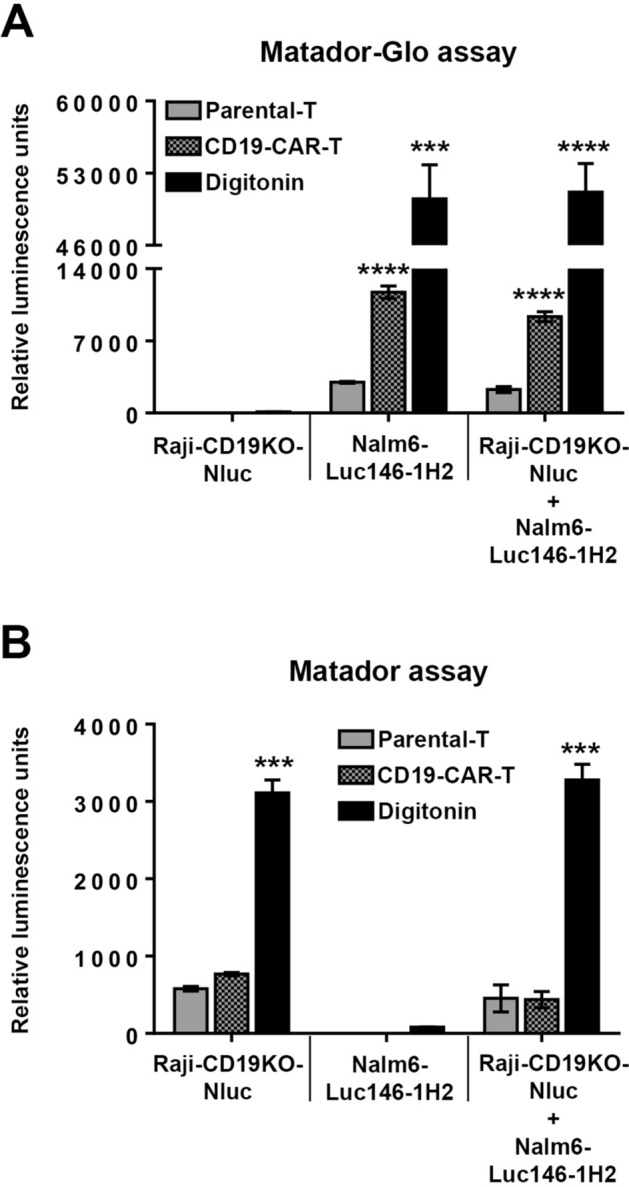
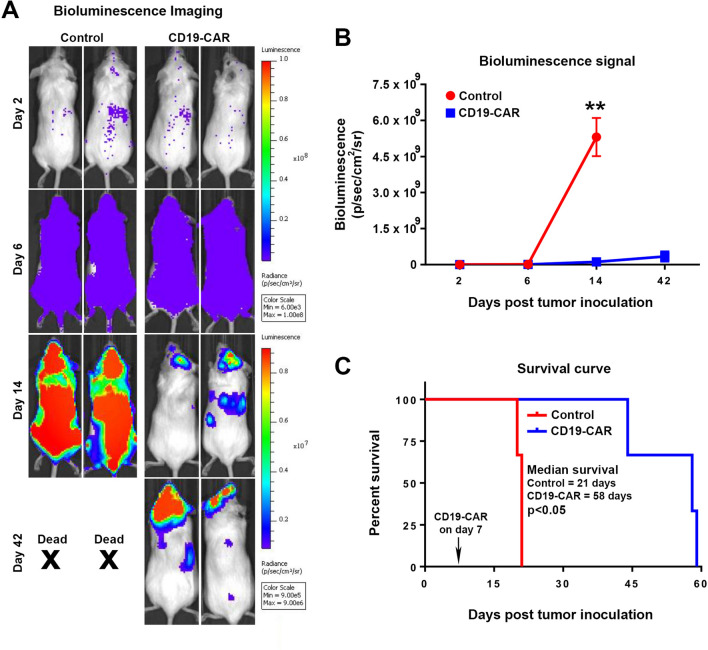
Cytotoxicity assays are essential for the testing and development of novel immunotherapies for the treatment of cancer. We recently described a novel cytotoxicity assay, termed the Matador assay, which was based on marine luciferases and their engineered derivatives. In this study, we describe the development of a new cytotoxicity assay termed 'Matador-Glo assay' which takes advantage of a thermostable variant of Click Beetle Luciferase (Luc146-1H2). Matador-Glo assay utilizes Luc146-1H2 and D-luciferin as the luciferase-substrate pair for luminescence detection. The assay involves ectopic over-expression of Luc146-1H2 in the cytosol of target cells of interest. Upon damage to the membrane integrity, the Luc146-1H2 is either released from the dead and dying cells or its activity is preferentially measured in dead and dying cells. We demonstrate that this assay is simple, fast, specific, sensitive, cost-efficient, and not labor-intensive. We further demonstrate that the Matador-Glo assay can be combined with the marine luciferase-based Matador assay to develop a dual luciferase assay for cell death detection. Finally, we demonstrate that the Luc146-1H2 expressing target cells can also be used for in vivo bioluminescence imaging applications.


Conflict of interest statement

P.M.C. is an inventor on a patent application related to the technology described in this manuscript which has been licensed to Angeles Therapeutics. P.M.C. serves as a consultant for Athelas, Oncotartis and Pancella, and is the founder of Angeles Therapeutics. All the other authors declare no competing financial interests.

Figures

Figure 1
Figure 1
Validation of Matador-Glo assay using transiently transfected and stably transduced cells. (A) The indicated Luc146-1H2 lentiviral vectors were transiently transfected in 293FT cells. Approximately, 24 h post-transfection cells were treated with digitonin (30 µg/ml) for 90 min or left untreated (UT). Cell-free supernatants (25 µl) were assayed for luminescence by adding D-luciferin containing assay buffer (25 µl) directly to each well in a 384-well lumitrac plate. (B) Indicated cell lines stably expressing Luc146-1H2 were plated in a 384-well lumitrac plate and treated with digitonin (30 µg/ml) for 90 min or left untreated (UT). Luminescence was detected as described for (A). The values shown are mean ± SE of a representative experiment performed in duplicate. Statistically significant differences are shown by asterisks (***) at a level of P < 0.001 and (****) at a level of P < 0.0001.
Figure 2
Figure 2
Matador-Glo assay is highly sensitive. (A) Indicated cell lines stably expressing Luc146-1H2 were plated in a 384-well at indicated numbers (by serial dilution) and treated with digitonin (30 µg/ml) for 90 min or PBS (control). Luminescence was detected by the addition of D-luciferin containing assay buffer directly to each well. (B) Linear increase in luminescence over a wide range of cell numbers in the Matador-Glo assay. Both the number of cells plated and luminescence values detected were plotted. R2 = Correlation coefficient. The values shown are mean ± SE of a representative experiment performed in triplicate. Statistically significant differences are shown by asterisks (****) at a level of P < 0.0001.
Figure 3
Figure 3
The Matador-Glo assay is a single-step homogenous assay. Raji/Nalm6 cells stably expressing Luc146-1H2 were either left untreated (UT) or treated with 30 μg/ml digitonin to induce cell death. Post-treatment, the cells were mixed well, collected in a 1.5 ml microfuge tubes and divided into 3 sets. Set 1 (cell-free supernatant), cells were centrifuged, and cell supernatants alone were collected in a new tube and plated in a 384-well plate, followed by measuring the luciferase activity. Set 2 (total homogenate), the cells with supernatant were directly assayed for luciferase activity by plating in a 384-well plate. For set 3 (cell pellet), cells were centrifuged, supernatant was removed, followed by the resuspension of cell pellets in PBS and plated in a 384-well plate to assess luciferase activity. Total reaction volume plated in 384-well plate from three sets was kept constant at 60 µl per well, and 15 µl of D-luciferin assay buffer was added in well mode to measure luciferase activity. The values shown are mean ± SE of a representative experiment performed in triplicate. Statistically significant differences are shown by asterisks (**) at a level of P < 0.01 and (****) at a level of P < 0.0001.
Figure 4
Figure 4
Applications of Matador-Glo assay in testing cytotoxicity induced by Immunotherapies. (A) Nalm6 cells stably expressing Luc146-1H2 were co-cultured in a 24-well plate at an E:T ratio of 1:5 for 48 h with Parental-T cells or T cells expressing the CD19-CAR in 1 ml total volume. Post-incubation, the cell homogenates were collected in 1.5 ml tubes, and 20 μl of cell homogenate was plated along with 40 μl of culture medium in a new 384-well plate in triplicate. Luminescence was detected by the addition of 15 µl of D-luciferin-containing assay buffer directly to each well. For maximum cell death Nalm6-Luc146-1H2 cells were treated with digitonin (30 µg/ml) for 60 min or PBS (control). The values shown are mean ± SE of a representative experiment performed in triplicate. (B) Primary human T cells were treated with Blinatumomab at a concentration of 100 ng/106 cells/ml or vehicle (control) followed by co-incubation with Raji cells stably expressing Luc146-1H2 at an E:T ratio of 10:1 for 4 h. Luminescence was detected by the addition of D-luciferin-containing assay buffer directly to each well. The values shown are mean ± SE of a representative experiment performed in triplicate. (C) K562 cells stably expressing Luc146-1H2 were co-cultured with NK92MI cells in a 384-well plate at an E:T ratio of 1:1 for 4 h. Luminescence was detected as described above in (A). The values shown are mean ± SE of a representative experiment performed in triplicate. Statistically significant differences are shown by asterisks (****) at a level of P < 0.0001.
Figure 5
Figure 5
Luc146-1H2 is highly stable in cell culture medium. (A) Raji/Nalm6 cells stably expressing Luc146-1H2 were plated in a 24-well plate, co-cultured with parental-T cells or T cells expressing the CD19-CAR (CD19-CAR-T) at an Effector:Target (E:T) ratio of 1:1 for 18 h. After incubation, cell free supernatants were transferred into 6 different tubes and frozen immediately at − 80 °C. The tubes were directly transferred to 37 °C (from − 80 °C) and were incubated for indicated time periods (0–24 h). The luminescence was measured by adding D-luciferin containing assay buffer directly to each well. The values shown are mean ± SE of a representative experiment performed in duplicate for at least three times. (B) Raji/Nalm6 cells stably expressing Luc146-1H2 were plated in a 24-well plate, treated with media alone (control) or digitonin (30 μg/ml) for 90 min. After incubation, cell free supernatants were transferred into 6 different tubes and assayed as described above for (A). The values shown are mean ± SE of a representative experiment performed in duplicate for at least three times. Statistically significant differences are shown by asterisks (****) at a level of P < 0.0001.
Figure 6
Figure 6
Matador-Glo assay can be coupled with Matador assay. (A) K562 cells stably expressing both Luc146-1H2 and Nluc (K562-Luc146-1H2/Nluc) were treated with digitonin (30 µg/ml) for 90 min. Post-incubation supernatants was carefully transferred to a 384-well plate to measure Luc146-1H2 activity using D-luciferin as a substrate (Matador-Glo assay) and Nluc activity using native coelenterazine as a substrate (Matador assay), respectively. (B) Dual-Luciferase Reporter assay kit from Promega (E1910) was used to measure samples from the same experiment as (A). Luc146-1H2 activity was measured first by adding Luciferase Assay Reagent II (LAR II). After quantifying the Luc146-1H2 activity, the Nluc activity was measured by adding Stop & Glo reagent to the same wells. The Stop & Glo Reagent both quenches the Luc146-1H2 signal and initiates the Nluc luminescence. The values shown are mean ± SE of a representative experiment performed in triplicate for at least two times. Statistically significant differences are shown by asterisks (***) at a level of P < 0.001 and (****) at a level of P < 0.0001.
Figure 7
Figure 7
Utility of the Matador-Glo assay in a multiplex cytotoxicity assay. (A) Raji cells lacking CD19 expression and stably expressing Nluc (Raji-CD19KO-Nluc) and CD19-positive Nalm6 cells stably expressing Luc146-1H2 (Nalm6-Luc146-1H2) were either plated alone or in combination at 1:1 ratio. The plated cells were co-incubated with parental-T cells or T cells expressing the CD19-CAR (CD19-CAR-T) at an Effector:Target (E:T) ratio of 1:1 for 24 h in a 24-well plate. For maximum cell death, 30 µg/ml digitonin was added an hour prior to luciferase assay. Post-incubation cell homogenates were carefully transferred to a 384-well plate to measure Luc146-1H2 activity (Matador-Glo assay) using D-luciferin containing assay buffer. (B) The same samples mentioned in (A) were used to measure Nluc activity (Matador assay) using coelenterazine containing assay buffer. The values shown are mean ± SE of a representative experiment performed in triplicate for at least two times. Statistically significant differences are shown by asterisks (***) at a level of P < 0.001 and (****) at a level of P < 0.0001.
Figure 8
Figure 8
Utilizing Luc146-1H2 expressing target cells for in vivo experiments. (A) 6-week-old NOD.Scid-Gamma (NSG) mice were injected with one million Nam6-Luc146-1H2 cells via tail vein. Bio-Luminescence Imaging (BLI) was performed on days 2 and 6 post injection to confirm the engraftment of tumor cells (Nam6-Luc146-1H2) in mice. Post confirmation, on day 7 mice were randomly divided into control (parental-T cells) and CD19-CAR (3 × 106 CAR positive cells) treatment groups and were injected with respective cells via tail vein. Representative serial BLI images of mice on days 2, 6, 14 and 42 of indicated groups are shown. (B) Tumor burden, as measured by relative luminescence measurements of serial BLI imaging from control and CD19-CAR-T treated mice. (C) Survival curves (Kaplan–Meier) of mice bearing Nalm6-Luc146-1H2 cells treated with parental-T cells (control) or CD19-CAR-T cells are shown (n = 3 in each group). The survival curve was generated in GraphPad Prism 5 software. Statistically significant differences are shown by asterisks (**) at a level of P < 0.01.

Similar articles

Cited by

References

    1. Brunner KT, Mauel J, Cerottini JC, Chapuis B. Quantitative assay of the lytic action of immune lymphoid cells on 51-Cr-labelled allogeneic target cells in vitro; inhibition by isoantibody and by drugs. Immunology. 1968;14:181–196. - PMC - PubMed
    1. Rabinovich PM, et al. A versatile flow-based assay for immunocyte-mediated cytotoxicity. J. Immunol. Methods. 2019;474:112668. doi: 10.1016/j.jim.2019.112668. - DOI - PMC - PubMed
    1. Decker T, Lohmann-Matthes ML. A quick and simple method for the quantitation of lactate dehydrogenase release in measurements of cellular cytotoxicity and tumor necrosis factor (TNF) activity. J. Immunol. Methods. 1988;115:61–69. doi: 10.1016/0022-1759(88)90310-9. - DOI - PubMed
    1. Corey MJ, Kinders RJ, Brown LG, Vessella RL. A very sensitive coupled luminescent assay for cytotoxicity and complement-mediated lysis. J. Immunol. Methods. 1997;207:43–51. doi: 10.1016/S0022-1759(97)00098-7. - DOI - PubMed
    1. Olsson T, Gulliksson H, Palmeborn M, Bergstrom K, Thore A. Leakage of adenylate kinase from stored blood cells. J. Appl. Biochem. 1983;5:437–445. - PubMed

Publication types