

Identification of a methylomics-associated nomogram for predicting overall survival of stage I-II lung adenocarcinoma
- PMID: 33976305
- PMCID: PMC8113535
- DOI: 10.1038/s41598-021-89429-4
Identification of a methylomics-associated nomogram for predicting overall survival of stage I-II lung adenocarcinoma
Abstract
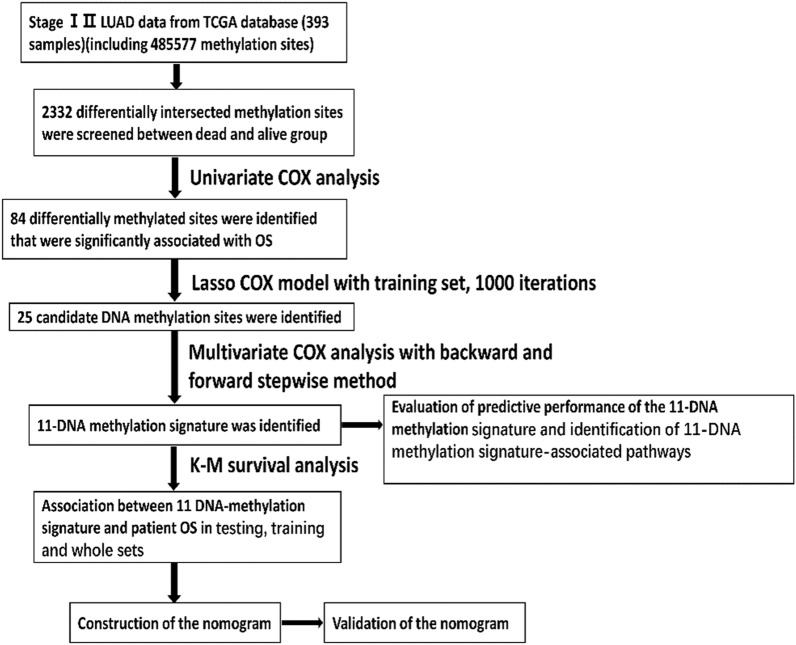
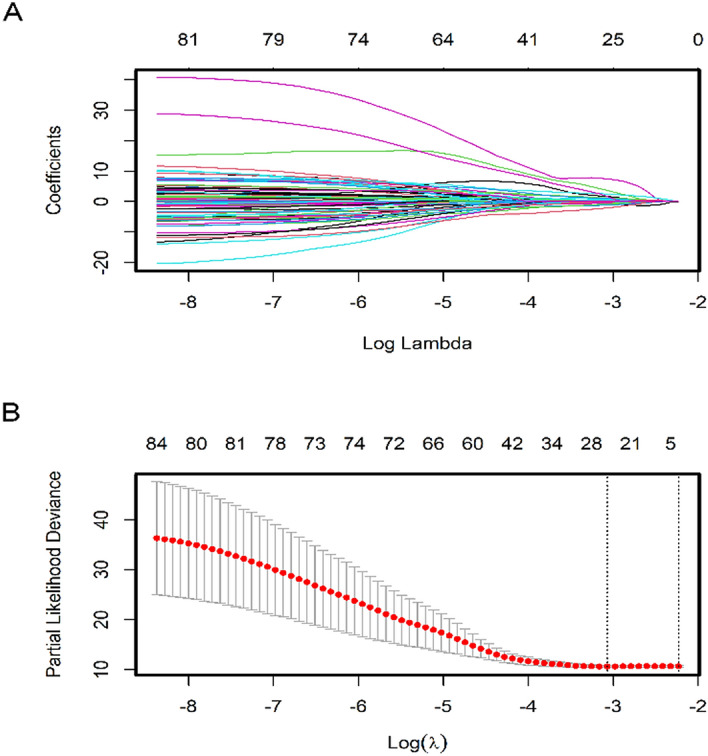
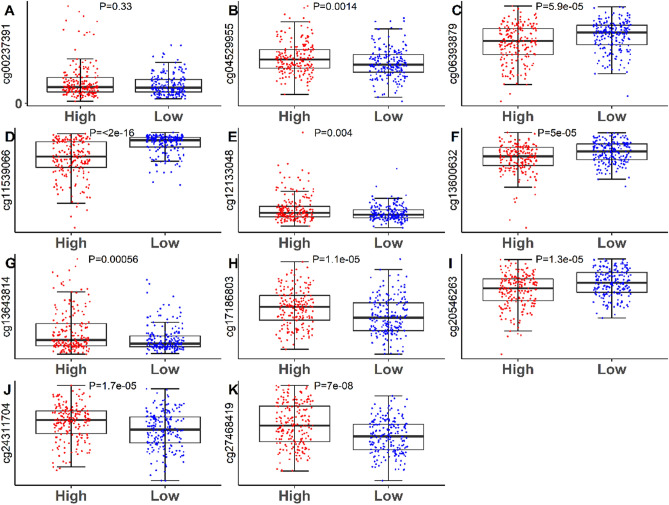
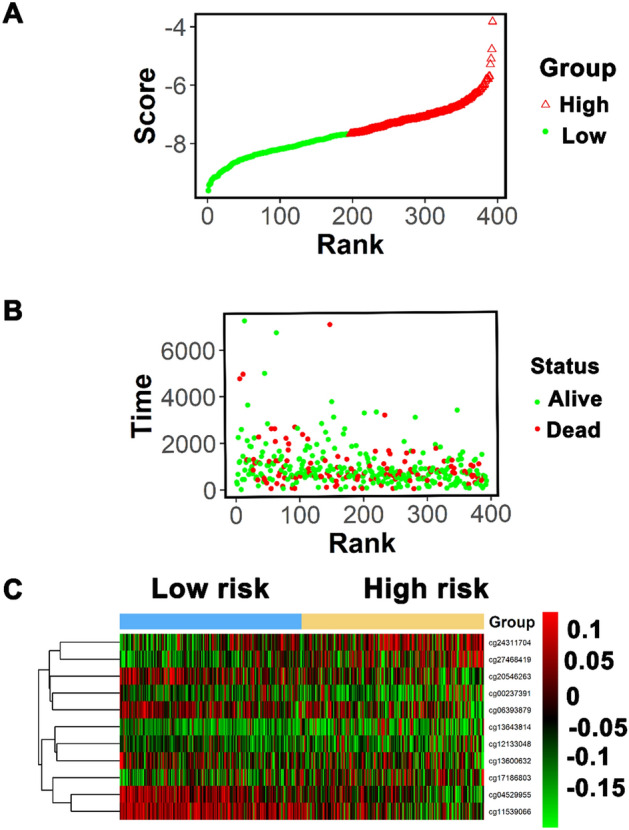
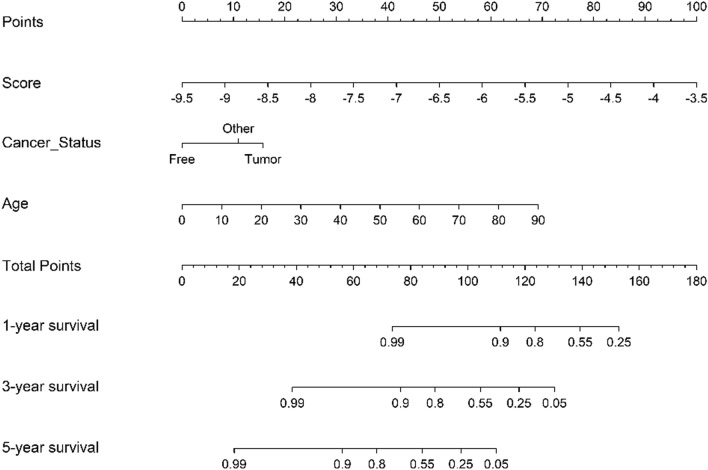
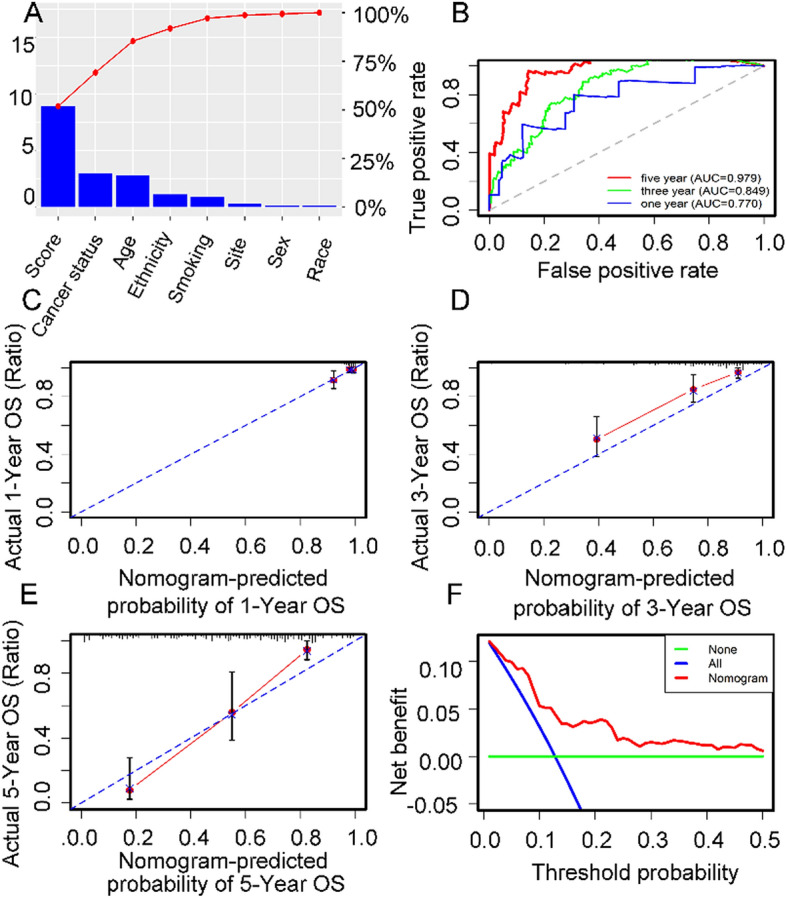
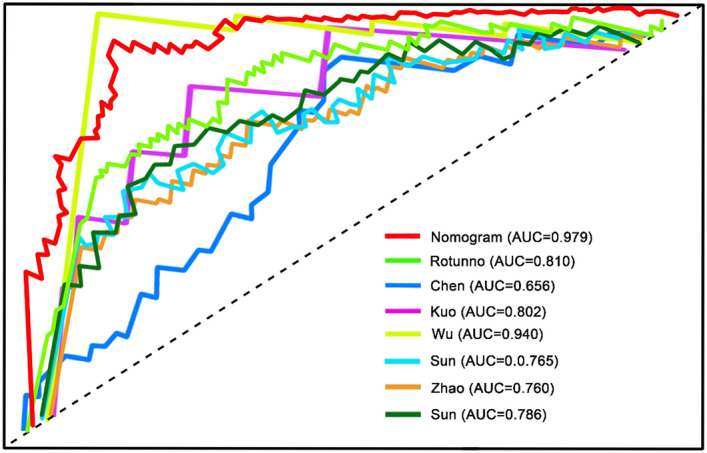
The aim of this paper was to identify DNA methylation based biomarkers for predicting overall survival (OS) of stage I-II lung adenocarcinoma (LUAD) patients. Methylation profile data of patients with stage I-II LUAD from The Cancer Genome Atlas (TCGA) database was used to determine methylation sites-based hallmark for stage I-II LUAD patients' OS. The patients were separated into training and validation datasets by using median risk score as cutoff. Univariate Cox, least absolute shrinkage and selection operator (LASSO) and multivariate Cox analyses were employed to develop a DNA methylation signature for OS of patients with stage I-II LUAD. As a result, an 11-DNA methylation signature was determined to be critically associated with the OS of patients with stage I-II LUAD. Analysis of receiver operating characteristics (ROC) suggested a high prognostic effectiveness of the 11-DNA methylation signature in patients with stage I-II LUAD (AUC at 1, 3, 5 years in training set were (0.849, 0.879, 0.831, respectively), validation set (0.742, 0.807, 0.904, respectively), entire TCGA dataset (0.747, 0.818, 0.870, respectively). Kaplan-Meier survival analyses exhibited that survival was significantly longer in the low-risk cohort compared to the high-risk cohort in the training dataset (P = 7e - 07), in the validation dataset (P = 1e - 08), and in the all-cohort dataset (P = 6e - 14). In addition, a nomogram was developed based on molecular factor (methylation risk score) as well as clinical factors (age and cancer status) (AUC at 1, 3, 5 years entire TCGA dataset were 0.770, 0.849, 0.979, respectively). The result verified that our methylomics-associated nomogram had a strong robustness for predicting stage I-II LUAD patients' OS. Furthermore, the nomogram combined clinical and molecular factors to determine an individualized probability of recurrence for patients with stage I-II LUAD, which stood for a major advance in the field of personalized medicine for pulmonary oncology. Collectively, we successfully identified a DNA methylation biomarker and a DNA methylation-based nomogram to predict the OS of patients with stage I-II LUAD.
Conflict of interest statement
The authors declare no competing interests.
Figures


Similar articles
-
DNA methylation profiling to predict recurrence risk in stage Ι lung adenocarcinoma: Development and validation of a nomogram to clinical management.J Cell Mol Med. 2020 Jul;24(13):7576-7589. doi: 10.1111/jcmm.15393. Epub 2020 Jun 12. J Cell Mol Med. 2020. PMID: 32530136 Free PMC article.
-
A Seven-Gene Signature with Close Immune Correlation Was Identified for Survival Prediction of Lung Adenocarcinoma.Med Sci Monit. 2020 Jul 2;26:e924269. doi: 10.12659/MSM.924269. Med Sci Monit. 2020. PMID: 32613949 Free PMC article.
-
Establishment and validation of an immune-associated signature in lung adenocarcinoma.Int Immunopharmacol. 2020 Nov;88:106867. doi: 10.1016/j.intimp.2020.106867. Epub 2020 Aug 13. Int Immunopharmacol. 2020. PMID: 32799112
-
Identification of prognostic values of the transcription factor-CpG-gene triplets in lung adenocarcinoma: A narrative review.Medicine (Baltimore). 2022 Dec 16;101(50):e32045. doi: 10.1097/MD.0000000000032045. Medicine (Baltimore). 2022. PMID: 36550923 Free PMC article. Review.
-
Based on the Development and Verification of a Risk Stratification Nomogram: Predicting the Risk of Lung Cancer-Specific Mortality in Stage IIIA-N2 Unresectable Large Cell Lung Neuroendocrine Cancer Compared With Lung Squamous Cell Cancer and Lung Adenocarcinoma.Front Oncol. 2022 Jun 30;12:825598. doi: 10.3389/fonc.2022.825598. eCollection 2022. Front Oncol. 2022. PMID: 35847910 Free PMC article. Review.
Cited by
-
Autoencoder-based multimodal prediction of non-small cell lung cancer survival.Sci Rep. 2023 Sep 22;13(1):15761. doi: 10.1038/s41598-023-42365-x. Sci Rep. 2023. PMID: 37737469 Free PMC article.
-
A Novel Methylation-based Model for Prognostic Prediction in Lung Adenocarcinoma.Curr Genomics. 2024 Feb 23;25(1):26-40. doi: 10.2174/0113892029277397231228062412. Curr Genomics. 2024. PMID: 38544827 Free PMC article.
-
Methods in DNA methylation array dataset analysis: A review.Comput Struct Biotechnol J. 2024 May 17;23:2304-2325. doi: 10.1016/j.csbj.2024.05.015. eCollection 2024 Dec. Comput Struct Biotechnol J. 2024. PMID: 38845821 Free PMC article. Review.
References
Publication types
MeSH terms
Substances
LinkOut - more resources
Full Text Sources
Other Literature Sources
Research Materials
