. 2021 May 11;4(1):558.
doi: 10.1038/s42003-021-02081-6.

Engineered MATE multidrug transporters reveal two functionally distinct ion-coupling pathways in NorM from Vibrio cholerae

Affiliations

Engineered MATE multidrug transporters reveal two functionally distinct ion-coupling pathways in NorM from Vibrio cholerae

Sagar Raturi et al. Commun Biol. .

Abstract

Multidrug and toxic compound extrusion (MATE) transport proteins confer multidrug resistance on pathogenic microorganisms and affect pharmacokinetics in mammals. Our understanding of how MATE transporters work, has mostly relied on protein structures and MD simulations. However, the energetics of drug transport has not been studied in detail. Many MATE transporters utilise the electrochemical H+ or Na+ gradient to drive substrate efflux, but NorM-VC from Vibrio cholerae can utilise both forms of metabolic energy. To dissect the localisation and organisation of H+ and Na+ translocation pathways in NorM-VC we engineered chimaeric proteins in which the N-lobe of H+-coupled NorM-PS from Pseudomonas stutzeri is fused to the C-lobe of NorM-VC, and vice versa. Our findings in drug binding and transport experiments with chimaeric, mutant and wildtype transporters highlight the versatile nature of energy coupling in NorM-VC, which enables adaptation to fluctuating salinity levels in the natural habitat of V. cholerae.


Conflict of interest statement

The authors declare no competing interests.

Figures
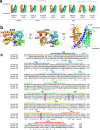
Fig. 1
Fig. 1. Structural features of MATE transporters.
a Overview of MATE subfamilies showing the V-shaped outward-facing structures of plant eMATE transporters from Camelina sativa (CasMATE, PDB-ID: 5XJJ) and Arabidopsis thaliana (AtDTX14, PDB-ID: 5Y50), NorM transporters from Vibrio cholerae (NorM-VC, PDB-ID: 3MKT) and Neisseria gonorrhoeae (NorM-NG, PDB-ID: 4HUK), and DinF transporters from Escherichia coli (ClbM, PDB-ID: 4Z3N), V. cholerae (VcmN, PDB-ID: 6IDP) and Pyrococcus furiosus (PfMATE, PDB-ID: 3VVN). In these structures the N- and C-terminal halves, referred to N- and C-lobes, contact each other at the intracellular side. Also shown are the inward-facing conformation of PfMATE (PDB-ID: 6FHZ) and closed-outward conformation of DinF-BH from Bacillus halodurans (PDB-ID: 4LZ6). Transmembrane helices (TMHs) are shown in rainbow colours with TMH1-6 in blue–green and TMH7-12 in yellow–orange–red. Dotted lines depict the approximate membrane boundaries. b Structure of NorM-VC (PDB-ID: 3MKT) in three different orientations, showing the locations of catalytic carboxylates D36 in the N-lobe and E255 and D371 in the C-lobe as spheres. c Alignment of amino acid sequences for NorM-VC (AAF94694.1) from Vibrio cholerae serotype O1 (ATCC 39315), NorM-PS (EHY79494.1) from Pseudomonas stutzeri strain ZoBell (ATCC 14405) and NorM-NG (WP_003687823.1) from Neisseria gonorrhoeae. The alignment indicates the location of the transmembrane helices and shows that D36, E255 and D371 in NorM-VC are conserved as D38, E257 and D373 in NorM-PS, and D41, E261 and D377 in NorM-NG. The conservation of residues Q278 and N282 in NorM-VC (see Fig. 9) is indicated in the open blue boxes. The protein structures were prepared in Pymol v2.4.0; the sequence alignment was generated in Clustal Omega v1.2.4.
Fig. 2
Fig. 2. Comparison of Na+ dependency of NorM-VC and NorM-PS.
a Upon the addition of 20 mM glucose (+G), cells expressing NorM-VC (red traces) or NorM-PS (cyan traces) show significant ethidium efflux over time compared to non-expressing control cells (grey traces). The presence of 1 mM Na+ in buffer pH 7.0 (dotted traces) stimulates efflux activity by NorM-VC but not by NorM-PS. The histogram on the right shows mean levels of ethidium fluorescence at 400 s in repeat experiments. Open bars, -Na+. Horizontally-striped bars, +Na+. b In a K+-free Tris buffer, ethidium efflux by NorM-VC in glucose-metabolising cells (yellow trace) is stimulated by the addition of 10 mM Na+ (black trace) or K+ (pink trace), indicating that the ΔpNa and ΔpH can each be a driving force for transport. In contrast, ethidium efflux by NorM-PS is only stimulated by K+ but not by Na+. Histograms show mean levels of ethidium fluorescence at 600 s in repeat experiments. Open yellow bars, MATE transporter-expressing cells in Tris buffer. Black or pink horizontally-striped bars, +Na+ or +K+, respectively. c Active ethidium efflux by NorM-VC as a function of the Na+ concentration (rainbow coloured) in buffer pH 7.0. A plot of the efflux rates versus Na+ concentrations was fitted to a hyperbola. Data represent observations in three experiments with independently prepared batches of cells. Values are expressed as mean ± s.e.m. (two-way analysis of variance; **P < 0.01; ****P < 0.0001). Asterisks above square brackets refer to comparisons with the no-Na+ condition (a), whereas asterisks directly above bars refer to comparisons with Tris buffer only (b); ns indicates ‘not significant’.
Fig. 3
Fig. 3. Energetics of H+- and Na+-coupled ethidium efflux in NorM-VC.
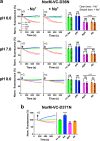
a The composition of the ∆p in cells suspended in buffer pH 6.0, 7.0, and 8.0 was assessed using the fluorescent membrane potential probe DiOC2(3). When added to control cells, the probe reported three plateau levels in fluorescence emission (see top panel). Level (i) reflects probe accumulation in the absence of ionophores due to the ∆ψ (interior negative) in glucose-energised cells in which ∆p = ∆ψ − Z∆pH. Level (ii) reports further probe accumulation following the addition of 0.5 µM nigericin (+N), which causes the interconversion of the ∆pH into extra ∆ψ and provides a measure for the ∆p (=∆ψ + extra ∆ψ). Level (iii) follows the addition of 0.1 µM valinomycin (+V), which causes the dissipation of the ∆ψ and decrease of the DiOC2(3) fluorescence to baseline level. The histograms on the right represent ∆ψ = level (i) – level (iii) (blue bars), ∆pH = level (ii) − level (i) (pink bars) and ∆p = level (ii) – level (iii) (orange bars). The additions of the probe (+DiOC2(3)), nigericin (+N) and valinomycin (+V) are labelled in the top panel. b Magnitudes and compositions of the ∆p in (a) as a function of buffer pH. c Effect of the buffer pH 6.0, 7.0 and 8.0 on ethidium efflux in NorM-VC expressing cells or non-expressing control cells in absence of ionophores (∆p) (orange traces) or presence of nigericin (∆ψ only) (blue traces), valinomycin (∆pH only) (pink traces), or both ionophores (no ∆p) (green traces). The ionophores were added 3 min prior to the addition of the glucose (+G). Measurements were performed in the absence or presence of 1 mM Na+ as indicated on the left. Histograms on the right show levels of ethidium fluorescence at 300 s in repeat experiments. Open bars, non-expressing control cells. Diagonally-striped bars, NorM-VC-expressing cells. d Ethidium efflux activity as a function of buffer pH and driving force, in absence of Na+ (open bars) or presence of Na+ (horizontally-striped bars). For calculation of bar heights, ethidium fluorescence levels at 300 s in (c) for cells without NorM-VC expression were subtracted from corresponding levels for cells with NorM-VC expression. Data represent observations in three experiments (n = 3) with independently prepared batches of cells. Values are expressed as mean ± s.e.m. (two-way analysis of variance; *P < 0.05; ***P < 0.001; ****P < 0.0001). The asterisks above or below square brackets refer to comparisons with the non-expressing control in (c) or no-Na+ condition in (d); ns indicates ‘not significant’.
Fig. 4
Fig. 4. Equilibrium ethidium binding to NorM proteins.
a Purified NorM proteins in detergent solution were added stepwise to buffer pH 7.0 containing 2 μM ethidium in the absence of Na+ (red symbols) or presence of 1 mM Na+ (blue symbols) or Li+, Cs+, or Rb+ (purple, green and orange symbols, respectively), after which the fluorescence anisotropy was measured. Na+ stimulates high-affinity binding of ethidium to wildtype NorM-VC but not to the NorM-VC mutants D36N, D371N and E255Q, or NorM-PS or chimaeric proteins. b Ethidium binding to NorM-VC proteins was measured as a function of buffer pH at 0.2 µM purified NorM-VC and 2 µM ethidium. Ethidium binding to wildtype protein exhibits a double sigmoidal increase as the pH is raised, from which two midpoint pKa values of 6.9 and 8.0 were derived by non-linear curve fitting. Data represent observations in three experiments with independently prepared batches of purified proteins. Values are expressed as mean ± s.e.m. Some error bars are hidden behind the data point symbols.
Fig. 5
Fig. 5. Role of catalytic carboxylates D36 and D371 in ethidium efflux by NorM-VC.
a Effect of the buffer pH 6.0, 7.0 and 8.0 on ethidium transport by the D36N mutant in the absence of the ∆p (no ∆p) (green traces) or the presence of ∆ψ (blue traces), ∆pH (pink traces) or ∆p (orange traces). Glucose (+G) and ionophores were added to the cells as described in Fig. 3c. The histograms show levels of ethidium fluorescence at 900 s in repeat experiments in the absence of Na+ (open bars) or in the presence of 1 mM Na+ (horizontally-striped bars). The data show that ∆ψ is not a driving force for efflux by the D36N mutant, pointing to electroneutral ethidium+/H+ antiport. b Measurements of ethidium efflux by the D371N mutant also indicate electroneutral ethidium+/H+ antiport. Data represent observations in three experiments (n = 3) with independently prepared batches of cells. Values indicate mean ± s.e.m. (two-way analysis of variance; **P < 0.01; ***P < 0.001; ****P < 0.0001). Asterisks above square brackets refer to comparisons with the no-Na+ condition, whereas asterisks directly above bars or groups of bars (indicated by horizontal line) refer to comparisons with the no-∆p control; ns indicates ‘not significant’.
Fig. 6
Fig. 6. Transport studies on NorM-PS proteins.
a Effect of buffer pH 6.0, 7.0 or 8.0 on ethidium efflux by wildtype NorM-PS-expressing cells in the absence of the ∆p (no ∆p) (green traces) or the presence of ∆ψ (blue traces), ∆pH (pink traces), or ∆p (orange traces). Glucose (+G) and ionophores were added to the cells as described in Fig. 3c. Histograms show levels of ethidium fluorescence at 350 s in repeat experiments. b Ethidium efflux in glucose-metabolising cells expressing NorM-PS mutants containing carboxyl-to-amide replacements (purple traces and bars). The activity is compared with non-expressing control cells (grey trace and bar) and cells expressing wildtype NorM-PS (red trace and bar). Histograms show levels of ethidium fluorescence at 450 s in repeat experiments. Data represent observations in three experiments (n = 3) with independently prepared batches of cells. Values are expressed as mean ± s.e.m. (one-way analysis of variance; ****P < 0.0001). Asterisks directly above groups of bars (indicated by horizontal line) refer to comparisons with the no-∆p control (a) or non-expressing control (b). The square bracket with asterisks in b refers to the comparison with wildtype NorM-PS.
Fig. 7
Fig. 7. MD simulations of the dissociation of pre-bound Na+ from the D36/D38 pockets in outward-facing NorM-VC/NorM-PS.
a Interaction energies between bound Na+ and residues in the D36 pocket within 0.8 nm distance of the Na+ were averaged over four MD simulations from 90 to 100 ns. b Close-up view of the D36 pocket at 100 ns for each of the four runs. The interacting residues are indicated in stick representation. c Na+ dissociation from the D36 pocket is enhanced by protonation of D36. These simulations show that the pre-bound Na+ ion (blue sphere) was retained in all four simulations for NorM-VC and was released from the pocket when the anionic charge in the D36 side chain was neutralised by protonation of the carboxylate. d, e MD simulations similar to those in (a, b) for the D38 pocket in NorM-PS. In two out of four simulations with NorM-PS, Na+ was not retained but diffused away from the D38 pocket within 100 ns. These simulations suggest that the D36 pocket binds Na+ more easily than the D38 pocket. Values are expressed as mean ± s.e.m.
Fig. 8
Fig. 8. Ethidium transport by chimaeric NorM-VC/NorM-PS proteins.
a Construction of chimaeric proteins nVC-cPS and nPS-cVC from NorM-VC and NorM-PS (see also main text). b Immunoblot probed with anti-His-tag antibody shows comparable expression of NorM-VC, NorM-PS and chimaeric proteins in plasma membrane vesicles (2 µg total membrane protein/lane). The uncropped blot is shown in Fig. S3. c Ethidium efflux by nVC-cPS (open bars) and nPS-cVC (hatched bars) at pH 7.0 in the absence of the ∆p (no ∆p) (green traces) or the presence of ∆ψ (blue traces), ∆pH (pink traces), or ∆p (orange traces). Glucose (+G) and ionophores were added to cells as described in Fig. 3c. Activity of D36N and D38N mutants is indicated in purple. The histograms on the right show levels of ethidium fluorescence at 500 s in repeat experiments for nVC-cPS (open bars) or nPS-cVC (hatched bars). The data show that both chimaeric proteins mediate electroneutral H+/ethidium+ antiport. d Ethidium efflux by the chimaeric proteins is not significantly stimulated by 1 mM Na+ in buffer pH 7.4 (black traces and horizontally-striped bars), where Na+ has 25,000-fold excess over H+. Data represent observations in three experiments (n = 3) with independently prepared batches of cells. Bar heights indicate mean ± s.e.m. (two-way analysis of variance; **P < 0.01; ****P < 0.0001). Asterisks directly above bars or groups of bars (indicated by horizontal line) refer to comparisons with the no-∆p control. In panel d, the square brackets refer to comparisons with the no-Na+ condition; ns indicates ‘not significant’.
Fig. 9
Fig. 9. Na+ dependency of NorM-VC-mediated ethidium efflux requires a specific domain interface.
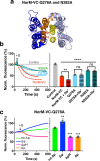
a Mutations Q278A and N282A (TM8) (in red stick representation) are located at the interface between the N-lobe and C-lobe, formed by TM1-TM2 (yellow) and TM7-TM8 (orange), in inward-facing NorM-VC. b The mutations disable the stimulation by Na+ (dotted traces) of the ∆p-dependent ethidium efflux by wildtype NorM-VC in cells in buffer pH 7.0. The histograms show levels of ethidium fluorescence at 400 s in repeat experiments in the absence of Na+ (open bars) or presence of 1 mM Na+ (horizontally-striped bars). c Ethidium efflux in NorM-VC-Q278A-expressing cells in the absence of the ∆p (no ∆p, green trace) or the presence of ∆ψ (blue trace), ∆pH (pink trace), or ∆p (orange trace). Glucose (+G) and ionophores were added to the cells as described in Fig. 3c. These data demonstrate electroneutral ethidium+/H+ antiport for the Q278A mutant. Data represent observations in three experiments (n = 3) with independently prepared batches of cells. Values are expressed as mean ± s.e.m. (two-way analysis of variance; ****P < 0.0001, ***P < 0.001, **P < 0.01). Asterisks directly above bars or groups of bars (indicated by horizontal line) refer to comparisons with the non-expressing control (b) or no-∆p control (c). In b, the square brackets refer comparisons with the no-Na+ condition; ns indicates ‘not significant’.
Fig. 10
Fig. 10. Organisation of the two ion translocation pathways in NorM-VC and the transport properties of mutants.
H+ translocation in Pathway 1 involves E255 and D371 in the C-lobe. Promiscuous Na+ and H+ translocation in Pathway 2 requires D36 in the N-lobe and E255 in the C-lobe. Black crosses and text refer to inhibition (see ‘Discussion’).

Similar articles

Cited by

References

    1. Kuroda T, Tsuchiya T. Multidrug efflux transporters in the MATE family. Biochim. Biophys. Acta. 2009;1794:763–768. doi: 10.1016/j.bbapap.2008.11.012. - DOI - PubMed
    1. Brown MH, Paulsen IT, Skurray RA. The multidrug efflux protein NorM is a prototype of a new family of transporters. Mol. Microbiol. 1999;31:394–395. doi: 10.1046/j.1365-2958.1999.01162.x. - DOI - PubMed
    1. Omote H, Hiasa M, Matsumoto T, Otsuka M, Moriyama Y. The MATE proteins as fundamental transporters of metabolic and xenobiotic organic cations. Trends Pharmacol. Sci. 2006;27:587–593. doi: 10.1016/j.tips.2006.09.001. - DOI - PubMed
    1. Remy E, Duque P. Beyond cellular detoxification: a plethora of physiological roles for MDR transporter homologs in plants. Front. Physiol. 2014;5:201. doi: 10.3389/fphys.2014.00201. - DOI - PMC - PubMed
    1. Terada T, Inui K. Physiological and pharmacokinetic roles of H+/organic cation antiporters (MATE/SLC47A) Biochem. Pharmacol. 2008;75:1689–1696. doi: 10.1016/j.bcp.2007.12.008. - DOI - PubMed

Publication types

MeSH terms

LinkOut - more resources