. 2021 May 11;4(1):552.
doi: 10.1038/s42003-021-02075-4.

Depletion of kinesin motor KIF20A to target cell fate control suppresses medulloblastoma tumour growth

Affiliations

Depletion of kinesin motor KIF20A to target cell fate control suppresses medulloblastoma tumour growth

Runxiang Qiu et al. Commun Biol. .

Abstract

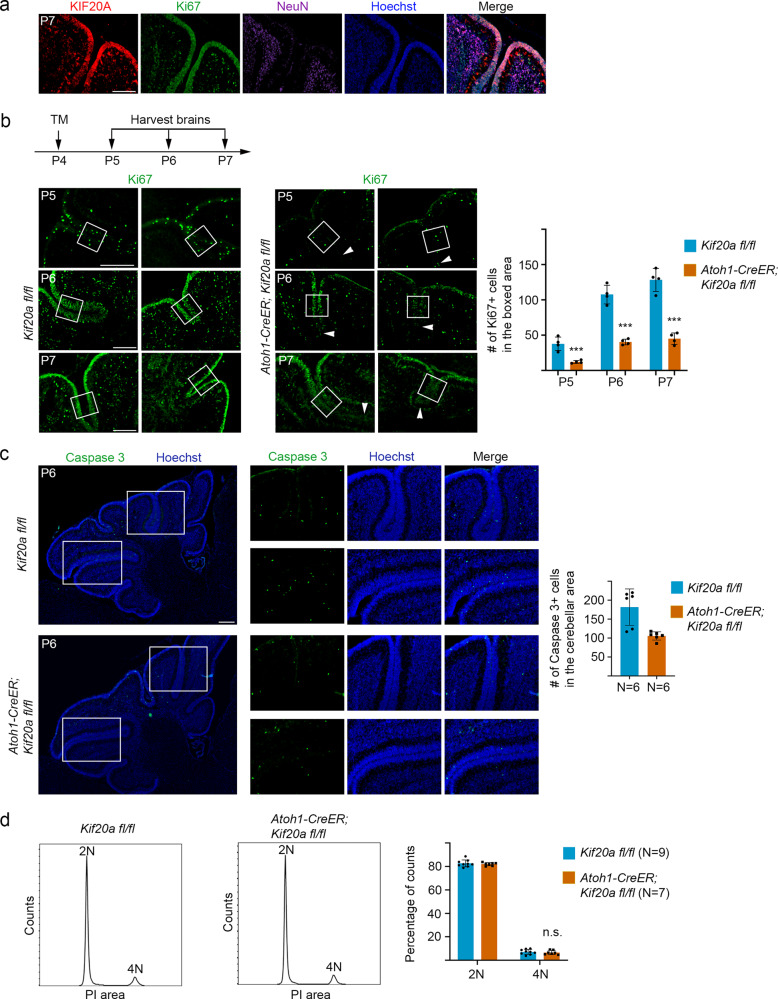
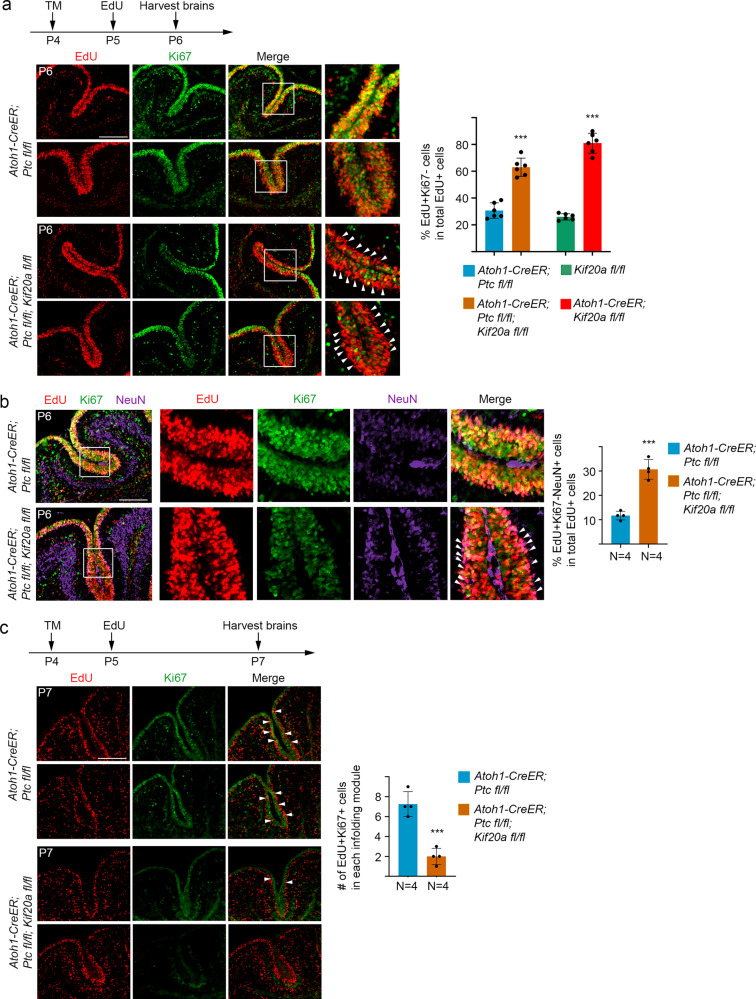
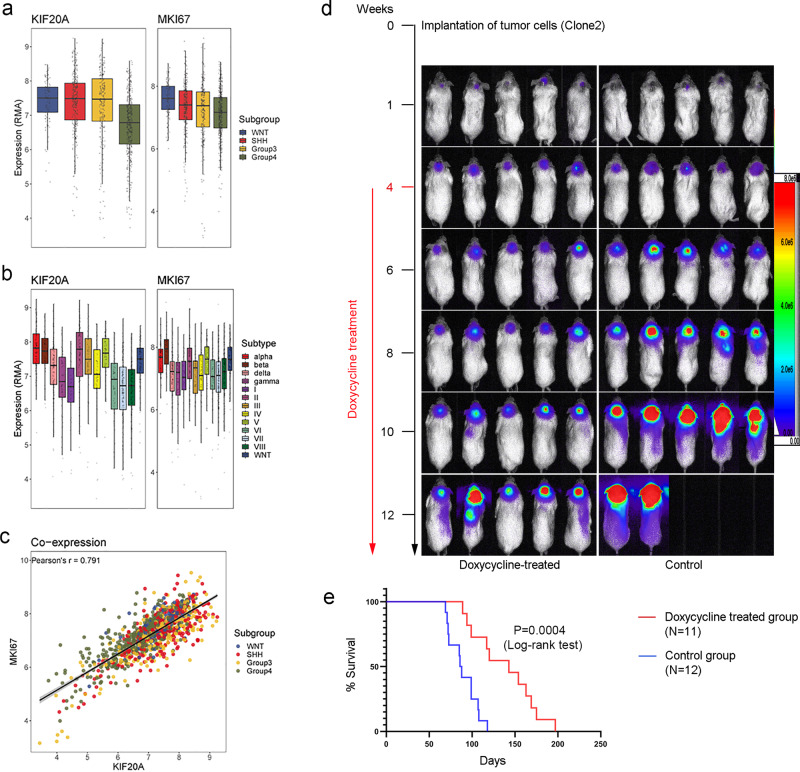
During mammalian brain development, neural progenitor cells proliferate extensively but can ensure the production of correct numbers of various types of mature cells by balancing symmetric proliferative versus asymmetric differentiative cell divisions. This process of cell fate determination may be harnessed for developing cancer therapy. Here, we test this idea by targeting KIF20A, a mitotic kinesin crucial for the control of cell division modes, in a genetic model of medulloblastoma (MB) and human MB cells. Inducible Kif20a knockout in both normal and MB-initiating granule neuron progenitors (GNPs) causes early cell cycle exit and precocious neuronal differentiation without causing cytokinesis failure and suppresses the development of Sonic Hedgehog (SHH)-activated MB. Inducible KIF20A knockdown in human MB cells inhibits proliferation both in cultures and in growing tumors. Our results indicate that targeting the fate specification process of nascent daughter cells presents a novel avenue for developing anti-proliferation treatment for malignant brain tumors.


Conflict of interest statement

The authors declare no competing interests.

Figures

Fig. 1
Fig. 1. LOF of KIF20A in GNPs results in a loss of proliferating cells.
a KIF20A expression was mainly enriched in the proliferating cell zone in the external granular layer (EGL) of the early postnatal cerebellum. Scale bar represents 50 μm. b Tamoxifen (TM)-induced knockout of Kif20a in GNPs caused a reduction in the number of proliferating cells in the mutant cerebellums. Ki67+ cells within boxed region at the center of individual cerebellar sulcus were used for quantification. White arrowheads indicated the tips of sulci in the mutant cerebellums, which often had diminished Ki67 signal. Scale bar represents 50 μm. Data are mean ± SD. P = 0.0019 (P5), 6.65E − 05 (P6), 9.52E − 05 (P7) (Student’s t-test). c Knockout of Kif20a did not cause a noticeable increase of apoptosis level marked by cleaved caspase 3 in the P6 mutant cerebellums. Scale bar represents 50 μm. Data are mean ± SD. d Flow cytometry-based cell cycle analysis of P6 littermate of knockout and control cerebellums. The 4N DNA contents (representing G2/M phase cells or cells with two nuclei resulted from cytokinesis defect) were little changed between the Kif20a-knockout and control brains. n.s., not significant.
Fig. 2
Fig. 2. LOF of KIF20A in GNPs causes early cell cycle exit and precocious neuronal differentiation.
a After tamoxifen (TM) treatment at P4, animal pups were labeled with EdU at P5 and then brains were collected at P6. Co-staining of EdU and Ki67 showed that knockout of Kif20a resulted in relatively more EdU+Ki67 cells in the EdU+ cell population compared to the wild-type littermate brains. Scale bar represents 50 μm. Data are mean ± SD. P = 1.09E − 09 (Student’s t-test). b More EdU+Ki67 cells in the mutant cerebellums were positive for neuronal marker NeuN (white arrowheads). These cells formed a line outside the Ki67+ cells, reflecting they are differentiating and migrating out of the EGL. Scale bar represents 50 μm. Data are mean ± SD. P = 1.29E − 06 (Student’s t-test). c After tamoxifen treatment at P4, animal pups were labeled with EdU at P5 and then brains were collected at P7. Co-staining of EdU and Ki67 showed that knockout of Kif20a resulted in fewer EdU+Ki67+ proliferating cells in the EGL at this stage. EdU+Ki67+ cells within individual cerebellar sulcus were used for quantification. Scale bar represents 50 μm. Data are mean ± SD. P = 1.58E − 07 (Student’s t-test).
Fig. 3
Fig. 3. LOF of KIF20A in tumor-initiating GNPs inhibits SHH-induced MB formation.
a Single (Atoh1-CreER; Ptcfl/fl)- and double (Atoh1-CreER; Ptcfl/fl; Kif20afl/fl)-knockout mice were treated with tamoxifen at P4 by gavage. Brain samples were collected for analyses when brain tumor symptoms were developed. Survival of mice was summarized in the Kaplan–Meier curve. b Representative whole brain samples from wild-type (Ptcfl/fl), Ptc single (Atoh1-CreER; Ptcfl/fl)-, or Ptc/Kif20a double (Atoh1-CreER; Ptcfl/fl; Kif20afl/fl)-knockout mice. Numbers in each panel indicate the days when brain samples were collected after TM injection (sections of these brains were shown in ch). c Normal brain features from section of wild-type control (Ptcfl/fl) brain collected 145 days after TM injection. Arrowhead indicates the cerebellum. d, e Examples of sections from Ptc single-knockout mice displayed strong tumor growth and often disformed brain structures. Arrows indicate the tumor mass. fh Examples of sections from Ptc/Kif20a double mice displayed varied tumor sizes. The overall brain structures were in general in better shape than the single-knockout mice.
Fig. 4
Fig. 4. Inducible knockout of Kif20a in tumor-initiating GNPs causes early cell cycle exit.
a After tamoxifen treatment at P4, animal pups were labeled with EdU at P5 and then brains were collected at P6. Co-staining of EdU and Ki67 revealed that knockout of Kif20a in MB-initiating GNPs (Ptc single-knockout GNPs) resulted in more EdU+Ki67 cells in the EdU+ cell population. White arrowheads indicate the EdU+Ki67 cells, many of which line outside the proliferating cell zone. Scale bar represents 50 μm. Quantifications from Fig. 2a (green and red columns) were plotted together in the graph. Data are mean ± SD. P = 1.82E − 05 (between the first two columns) (Student’s t-test). b More EdU+Ki67 cells in the Ptc/Kif20a double-knockout cerebellums were positive for neuronal marker NeuN (white arrowheads). Scale bar represents 50 μm. Data are mean ± SD. P = 0.00013 (Student’s t-test). c After tamoxifen treatment at P4, animal pups were labeled with EdU at P5 and then brains were collected at P7. Co-staining of EdU and Ki67 showed that knockout of Kif20a in MB-initiating GNPs resulted in fewer EdU+Ki67+ proliferating cells in the EGL. EdU+Ki67+ cells within individual cerebellar sulcus were used for quantification. Scale bar represents 50 μm. Data are mean ± SD. P = 0.00042 (Student’s t-test).
Fig. 5
Fig. 5. LOF of KIF20A in mouse tumor cells inhibits proliferation by inducing cell cycle exit.
a Two tumor cell lines were derived from the Ptc single-knockout mice and these cells carried a genotype of Ptc/−; Kif20a+/+. Two tumor cell lines from the Ptc/Kif20a double-knockout mice were also established in culture and these cells showed a genotype of Ptc−/−; Kif20afl/−. The latter two tumor lines displayed slower proliferation rates. Individual data points represented replicates of cell samples. Data are mean ± SD. P = 9.46E − 05 (two-way ANOVA). b Proliferating tumor cells were labeled with EdU for 24 h and were then stained for EdU and Ki67. There were fewer Ki67+ cells and a relatively high percentage of EdU+Ki67 cells (in the total population of EdU+ cells) in the tumor line derived from the Ptc/Kif20a double-knockout mice. Scale bar represents 50 μm. Data are mean ± SD. P = 5.45E − 08; 1.75E − 07 (Student’s t-test). c Tumor cells (having a genotype of Ptc−/−; Kif20afl/−) derived from the Ptc/Kif20a double-knockout mice were infected with lentivirus expressing Cre-2A-GFP or control GFP and were next labeled with EdU for 24 h in culture. Knockout of the remaining Kif20a allele in these cells resulted in cell cycle exit. Scale bar represents 50 μm. Data are mean ± SD. P = 4.12E − 05 (Student’s t-test). d Tumor cells derived from the Ptc/Kif20a double-knockout mice were infected with lentivirus expressing Cre-2A-GFP or control GFP. After labeling with propidium iodide, the cells were examined for their DNA contents by flow cytometry analysis. PI, propidium iodide; 2N, cells in G1 phase; 4N, cells in G2/M phase or bi-nucleated cells. n.s., not significant.
Fig. 6
Fig. 6. Knockdown of KIF20A expression in human MB cells inhibits tumor growth.
a Different subgroups of MB patient cells display strong expression of KIF20A, which is positively correlated with proliferating cell marker Ki67. b KIF20A and Ki67 expressions are also positively correlated in different subtypes of human MB cells. c Comparison between KIF20A expression and Ki67 expression in subgroups of human MB cells. Expression of the two factors are highly correlated. d Daoy cells stably integrated with Tet-on shKIF20A726 and firefly luciferase were intracranially injected into the cerebellar areas of recipient NSG mice (105 cells per mouse). Tumor growths were monitored by bioluminescence imaging. Doxycycline treatment started at 4 weeks after the initial cell implantation (indicated with a red font and line). The treatment group of mice was first given doxycycline by gavage for 2 consecutive days and was then fed with doxycycline-containing food for the entire duration of the experiment. e Survival data were analyzed by Kaplan–Meier plot.

References

    1. Caussinus E, Gonzalez C. Induction of tumor growth by altered stem-cell asymmetric division in Drosophila melanogaster. Nat. Genet. 2005;37:1125–1129. doi: 10.1038/ng1632. - DOI - PubMed
    1. Betschinger J, Mechtler K, Knoblich JA. Asymmetric segregation of the tumor suppressor brat regulates self-renewal in Drosophila neural stem cells. Cell. 2006;124:1241–1253. doi: 10.1016/j.cell.2006.01.038. - DOI - PubMed
    1. Lee CY, Wilkinson BD, Siegrist SE, Wharton RP, Doe CQ. Brat is a Miranda cargo protein that promotes neuronal differentiation and inhibits neuroblast self-renewal. Dev. Cell. 2006;10:441–449. doi: 10.1016/j.devcel.2006.01.017. - DOI - PubMed
    1. Lee CY, et al. Drosophila Aurora-A kinase inhibits neuroblast self-renewal by regulating aPKC/Numb cortical polarity and spindle orientation. Genes Dev. 2006;20:3464–3474. doi: 10.1101/gad.1489406. - DOI - PMC - PubMed
    1. Wang H, et al. Aurora-A acts as a tumor suppressor and regulates self-renewal of Drosophila neuroblasts. Genes Dev. 2006;20:3453–3463. doi: 10.1101/gad.1487506. - DOI - PMC - PubMed

Publication types

MeSH terms