. 2021 Nov;26(11):6820-6832.
doi: 10.1038/s41380-021-01106-0. Epub 2021 May 12.

GRK3 deficiency elicits brain immune activation and psychosis

Affiliations

GRK3 deficiency elicits brain immune activation and psychosis

Carl M Sellgren et al. Mol Psychiatry. 2021 Nov.

Erratum in

  • Correction: GRK3 deficiency elicits brain immune activation and psychosis.
    Sellgren CM, Imbeault S, Larsson MK, Oliveros A, Nilsson IAK, Codeluppi S, Orhan F, Bhat M, Tufvesson-Alm M, Gracias J, Kegel ME, Zheng Y, Faka A, Svedberg M, Powell SB, Caldwell S, Kamenski ME, Vawter MP, Schulmann A, Goiny M, Svensson CI, Hökfelt T, Schalling M, Schwieler L, Cervenka S, Choi DS, Landén M, Engberg G, Erhardt S. Sellgren CM, et al. Mol Psychiatry. 2022 Mar;27(3):1855. doi: 10.1038/s41380-021-01371-z. Mol Psychiatry. 2022. PMID: 34744164 Free PMC article. No abstract available.

Abstract

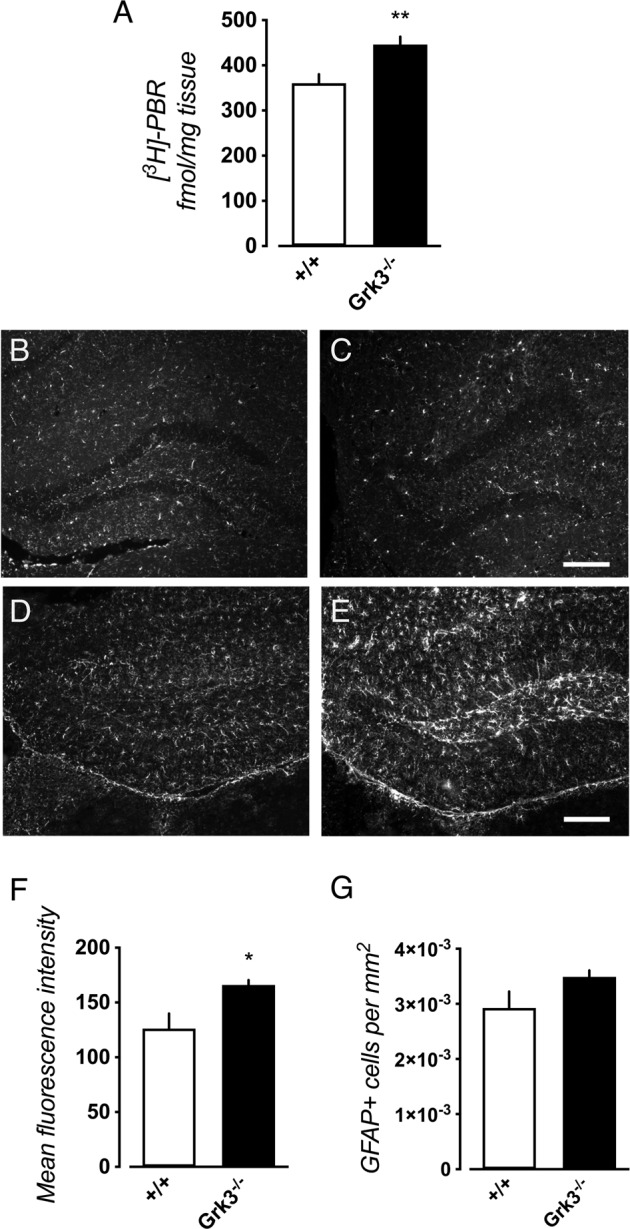
The G protein-coupled receptor kinase (GRK) family member protein GRK3 has been linked to the pathophysiology of schizophrenia and bipolar disorder. Expression, as well as protein levels, of GRK3 are reduced in post-mortem prefrontal cortex of schizophrenia subjects. Here, we investigate functional behavior and neurotransmission related to immune activation and psychosis using mice lacking functional Grk3 and utilizing a variety of methods, including behavioral, biochemical, electrophysiological, molecular, and imaging methods. Compared to wildtype controls, the Grk3-/- mice show a number of aberrations linked to psychosis, including elevated brain levels of IL-1β, increased turnover of kynurenic acid (KYNA), hyper-responsiveness to D-amphetamine, elevated spontaneous firing of midbrain dopamine neurons, and disruption in prepulse inhibition. Analyzing human genetic data, we observe a link between psychotic features in bipolar disorder, decreased GRK expression, and increased concentration of CSF KYNA. Taken together, our data suggest that Grk3-/- mice show face and construct validity relating to the psychosis phenotype with glial activation and would be suitable for translational studies of novel immunomodulatory agents in psychotic disorders.


Conflict of interest statement

MB is employed by AstraZeneca. D-SC is a scientific advisory board member to Peptron Inc. CMS is a scientific advisor to Outermost Inc. (MA, USA). All other authors declare they have no competing interests.

Figures

Fig. 1
Fig. 1. Grk3−/− mice exhibit deficits in working memory, psychosis-like behaviors, and altered dopaminergic transmission.
Working memory was assessed in Grk3+/+ (n = 19) and Grk3−/− (n = 20) mice by calculating the (A) % spontaneous alternations (P = 0.37) and (B) the % same arm return (P = 0.011). C The percent prepulse inhibition was influenced by genotype (effect of: prepulse intensity F(2,74) = 134.90, P < 0.0010; genotype F(1,37) = 1.27, P = 0.27; interaction F(2,74) = 4.20, P = 0.019) with deficits observed in Grk3−/− mice (n = 20) as compared to Grk3+/+ mice at 73 dB (n = 19; *P = 0.030 post hoc Fisher’s LSD), while (D) the startle magnitude was similar (P = 0.75). E Grk3−/− mice (n = 17) showed significantly higher sensitivity to the locomotor effects of D-amphetamine (5 mg/kg) than Grk3+/+ mice (n = 13) (effect of: time F(5,140) = 18.54, P < 0.0010; genotype F(1,28) = 4.94, P = 0.034; interaction F(5,140) = 2.95, P = 0.014). F Calculation of the area under the curve following injection was made in order to measure the net effect of D-amphetamine administration on locomotor response. Grk3−/− mice (n = 17) showed a stronger response to amphetamine with enhanced locomotion compared to Grk3+/+ mice (n = 13) (Mann–Whitney U-test, P = 0.039). G Accumulation of striatal dopamine induced by amphetamine (2 mg/kg) as measured by in vivo microdialysis was increased in Grk3−/− mice (n = 5) compared to Grk3+/+ mice (n = 5) 30 min post infusion (effect of: time F(11,88)=13.52, P < 0.0010; genotype F(1,8) = 4.08, P = 0.078; interaction F(11,88) = 2.22, P = 0.020; ***P = 0.00080 post hoc Bonferroni). H In vivo electrophysiology of dopaminergic cells in the VTA shows increased number of detectable cells per track in Grk3−/− mice (n = 6) compared to Grk3+/+ mice (n = 7; P = 0.0012), (I) as well as increased firing rate (Grk3+/+ n = 35 cells, Grk3−/− n = 78 cells; P = 0.043) although no significant changes in (J) burst firing could be detected (Grk3+/+ n = 35 cells, Grk3−/− n = 78 cells; P = 0.56). Group comparisons in (A), (B), (D), (G), (H), and (I) were performed using a Mann–Whitney U-test. Group comparisons in (C) were performed using a repeated measures 2-way ANOVA followed by Fisher’s LSD post hoc test. Group comparisons in (E) and (F) were performed using a repeated measures 2-way ANOVA followed by Bonferroni’s post hoc test. All error bars represent standard error of means (SEM). All tests were two-tailed. *P < 0.05, and **P < 0.01, ***P < 0.001.
Fig. 2
Fig. 2. IL-1β activation in Grk3−/− mice.
A Increased levels of IL-1β are detected in hippocampus of Grk3−/− mice (n = 5) compared to Grk3−/− mice (n = 5; P = 0.0079). B In wildtype mice (vehicle control: n = 8, and n = 9 IL-1β administered mice), ICV administration of IL-1β (0.5 ng) significantly increased hippocampal KYNA levels (P = 0.027), and (C) induced PPI deficits (P = 0.027; vehicle control n = 8, and n = 9 IL-1β administered mice). Group comparisons in (A) and (B) were performed using Mann–Whitney U tests. Group comparisons in (C) were performed using unpaired t test with Welch’s correction. All error bars represent SEM. All tests were two-tailed. *P < 0.05, and **P < 0.01.
Fig. 3
Fig. 3. Kynurenine pathway activation and P2RX7 upregulation in Grk3−/− mice.
Levels of (A) tryptophan (P = 0.094), (B) kynurenine (P = 0.014), (C) KYNA (P = 0.44), and (D) quinolinic acid (P = 0.12) in hippocampal tissue obtained from Grk3−/− as compared to Grk3+/+ mice. E Probenecid administration (200 mg/kg) was used to monitor accumulation of hippocampal KYNA (effect of: time F(12,108) = 11.47, P < 0.0010; genotype F(1,9) = 3.59, P = 0.091; interaction F(12,108) = 3.771, P < 0.0010) with significantly increased accumulation of KYNA in Grk3−/− mice at 120 as well as 150 min post infusion (Bonferroni post hoc test, P = 0.0028 and P = 0.033, respectively). F Grk3−/− mice displayed decreased expression of P2X7R on internal cellular membranes obtained from homogenized brain tissue (P = 0.017), while (G) no changes was observed in plasma membranes (P = 0.32). All experiments in (A)–(E) were carried out using 8 Grk3+/+ mice and 7 Grk3−/− mice. In (F) and (G) 5 Grk3+/+ and 6 Grk3−/− were used. Data in (A)–(D) and (F) to (G) were analyzed using Mann–Whitney U tests, while the data in (E) were analyzed using a 2-way repeated measures ANOVA followed by Bonferroni post hoc test. All error bars represent SEM. All tests were two-tailed. *P < 0.05, and **P < 0.01.
Fig. 4
Fig. 4. Reactive astrocytes in Grk3−/− mice.
A Autoradiography using the [3H]-PBR28 ligand for the 18 kDa translocator-protein (TSPO) in hippocampus revealed increased binding in Grk3−/− mice (n = 8) as compared to Grk3+/+ mice (n = 10; P = 0.0085). Representative image of immunostaining for the microglial marker IBA-1 in hippocampus of (B) Grk3+/+ and (C) Grk3−/− mice. Representative images of GFAP immunostaining in hippocampus of (D) Grk3+/+ (E) and Grk3−/− mice. Quantification of the (F) mean fluorescence intensity in 8 Grk3−/− mice and 7 Grk3+/+ revealed significantly increased intensity in Grk3−/− mice (P = 0.044), although (G) not reaching significant measuring cell density (P = 0.13). Scale bar = 200 μm. All group comparisons were performed using Mann–Whitney U tests. All error bars represent SEM. All tests were two-tailed. *P < 0.05, and **P < 0.01.
Fig. 5
Fig. 5. Genetically predicted GRK3 expression, KYNA levels, and psychotic symptoms in humans.
The SNP rs478655 (MAF: 0.29) was used to represent a cis acting eQTL in the GRK3 promoter with TT genotype denoted as high GRK3 RNA expression (black circle), CT as medium GRK3 RNA expression (gray circle), and CC as low GRK3 RNA expression (white circle). A CSF levels of KYNA, in a sample of 48 healthy individuals, as a result of genetically predicted GRK3 RNA expression (β = 0.051, P = 0.026). B Distribution of subjects with high, low, and medium prediction scores for GRK3 RNA expression in a sample of 70 bipolar disorder subjects. Subjects with a history of psychosis had higher predicted GRK3 RNA expression (OR = 2.6; 95% CI: 1.09–6.16). C Lack of GRK3 prevents internalization of microglial and/or astrocytic P2X7R, thereby triggering caspase-1 to produce IL-1β. This cytokine induces the kynurenine pathway, resulting in increased production of KYNA, a neuroactive compound that facilitates dopamine neurotransmission. All tests were two-tailed.

References

    1. Gurevich EV, Tesmer JJ, Mushegian A, Gurevich VV. G protein-coupled receptor kinases: more than just kinases and not only for GPCRs. Pharm Ther. 2012;133:40–69. - PMC - PubMed
    1. Steury MD, Lucas PC, McCabe LR, Parameswaran N. G-protein-coupled receptor kinase-2 is a critical regulator of TNFalpha signaling in colon epithelial cells. Biochem J. 2017;474:2301–2313. - PMC - PubMed
    1. Tesmer VM, Kawano T, Shankaranarayanan A, Kozasa T, Tesmer JJ. Snapshot of activated G proteins at the membrane: the Galphaq-GRK2-Gbetagamma complex. Science. 2005;310:1686–1690. - PubMed
    1. Arriza JL, Dawson TM, Simerly RB, Martin LJ, Caron MG, Snyder SH, et al. The G-protein-coupled receptor kinases beta ARK1 and beta ARK2 are widely distributed at synapses in rat brain. J Neurosci. 1992;12:4045–4055. - PMC - PubMed
    1. Erdtmann-Vourliotis M, Mayer P, Ammon S, Riechert U, Hollt V. Distribution of G-protein-coupled receptor kinase (GRK) isoforms 2, 3, 5 and 6 mRNA in the rat brain. Brain Res Mol Brain Res. 2001;95:129–137. - PubMed

Publication types