. 2021 Mar 30;12(11):3098-3113.
doi: 10.7150/jca.56340. eCollection 2021.

Highly deregulated lncRNA LOC is associated with overall worse prognosis in Hepatocellular Carcinoma patients

Affiliations

Highly deregulated lncRNA LOC is associated with overall worse prognosis in Hepatocellular Carcinoma patients

Lee Jin Lim et al. J Cancer. .

Abstract

Although numerous long non-coding RNAs (lncRNAs) were reported to be deregulated in Hepatocellular Carcinoma (HCC), experimentally characterized, and/or associated with patient's clinical characteristics, there is, thus far, minimal concerted research strategy to identify deregulated lncRNAs that modulate prognosis of HCC patients. Here, we present a novel strategy where we identify lncRNAs, which are not only de-regulated in HCC patients, but are also associated with pertinent clinical characteristics, potentially contributing to the prognosis of HCC patients. LOC101926913 (LOC) was further characterized because it is the most highly differentially expressed amongst those that are associated with the most number of clinical features (tumor-stage, vascular and tumor invasion and poorer overall survival). Experimental gain- and loss-of-function manipulation of LOC in liver cell-lines highlight LOC as a potential onco-lncRNA promoting cell proliferation, anchorage independent growth and invasion. LOC expression in cells up-regulated genes involved in GTPase-activities and downregulated genes associated with cellular detoxification, oxygen- and drug-transport. Hence, LOC may represent a novel therapeutic target, modulating prognosis of HCC patients through up-regulating GTPase-activities and down-regulating detoxification, oxygen- and drug-transport. This strategy may thus be useful for the identification of clinically relevant lncRNAs as potential biomarkers/targets that modulate prognosis in other cancers as well.

Keywords: Hepatocarcinogenesis; Hepatocellular Carcinoma; LOC101926913; Long non-coding RNA; Prognosis.


Conflict of interest statement

Competing Interests: The authors have declared that no competing interest exists.

Figures
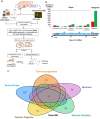
Figure 1
Figure 1
Identification of differentially expressed and clinically relevant lncRNAs. A) Schematic overview of the strategy to study differentially expressed and clinically relevant lncRNAs. LncRNA and mRNA expression profile were performed on HCC tumor tissues and adjacent non-tumorous tissues. Clinical phenotypes of HCC tumor tissues were used for clinical association studies. Differentially expressed (DE) and clinically relevant lncRNAs were then identified. Among the clinically relevant DElncRNAs, lncRNA that was simultaneously highly differentially expressed and associated with the most clinical phenotypes was selected for further analysis. Gain-and loss-of-function experiments in two cell lines were performed to study the cancer phenotypes and genes deregulated by the clinically relevant lncRNA. Pathway analysis was conducted on the deregulated genes. Colored circles: Five clinical phenotypes used in this study; Orange: Tumor properties; Yellow: Tumor capsule; Blue: Tumor grade; Green: Tumor invasion; Purple: Patient overall survival. B) Bar chart shows the number of differentially expressed lncRNAs that are grouped based on their relationship with protein-coding genes. The six types of lncRNAs are illustrated below the bar chart. Red: Upregulation in T vs NT; Green: Downregulation in T vs NT. Light blue thick arrows: Exons of protein coding genes; Dark blue thick arrows: Protein coding genes; Purple arrows: LncRNA transcription start site. C) Venn diagram shows the number of clinically relevant lncRNAs, which is defined as lncRNAs that is differentially expressed in T vs NT and also differentially expressed in poor clinical characteristic vs good clinical characteristic. Their expressions in both T vs NT and poor clinical characteristic vs good clinical characteristic are in the same direction and significant. Blue: Tumor Grade; Orange: Tumor properties (Includes tumor size, tumor stage and vascular invasion); Purple: Overall Survival; Green: Tumor invasion; Yellow: Tumor capsule (Includes Encapsulation and Degree of encapsulation).
Figure 2
Figure 2
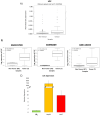
Clinical association of LOC in HCC patients including vascularization, cancer stage, tumor invasion and overall survival. A-C) The boxplots show expression of LOC in adjacent non-tumorous tissues, tumors associated with better clinical characteristics (absence of vascular invasion, stage 1-2, absence of tumor invasion) and tumors associated with worse clinical characteristics (presence of vascular invasion, stage 3-4, presence of tumor invasion). D) Survival curves shows that high LOC expression is associated with worse overall survival.
Figure 3
Figure 3
Validation of LOC expression in HCC patients and cell lines. A) Boxplot shows qPCR result of LOC expression in adjacent non-tumorous tissues and tumor tissues. B) Boxplot shows LOC expression in adjacent non-tumorous tissues and HCC tumor tissues in three GEO dataset (GSE101728, GSE98269 and GSE115019). C) Relative LOC expression in LO2 cells, HepG2 cells and Huh7 cells, measured by qPCR. The expression is normalized against actin. Data is presented as Mean±SE from three independent experiments.
Figure 4
Figure 4
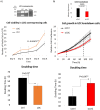
LOC enhances cell proliferation. A) (Top panel) Representative gel image shows multiplex PCR result of actin and LOC expression in LOC-overexpressing cells (LOC), control cells (Ctrl) and water as a negative control. (Middle panel) Cell proliferation profile of LOC-overexpressing cells (LOC) and control (Ctrl), measured by trypan blue exclusion cell counting method. (Bottom panel) The corresponding doubling time from day two till day eight is shown in the bar chart. B) (Top panel) Relative expression of LOC after knockdown in HepG2 cells (siLOC) compared to the knockdown control (siCtrl), as detected by qPCR. The expression is normalized against actin. (Middle panel) Cell growth result of LOC knockdown in HepG2 cells (siLOC) compared to control (siCtrl), measured with live cell imaging method. (Bottom panel) The corresponding doubling time from 36 hr till 108 hr is shown in the bar chart. All data are shown as mean±SE of three biological replicates. *:P<0.05 compared with control.
Figure 5
Figure 5
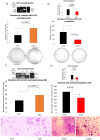
LOC promotes anchorage independent growth and cell invasive ability. A) (Top panel) Representative gel image shows multiplex PCR result of actin and LOC expression in LOC-overexpressing cells (LOC), control cells (Ctrl) and water as a negative control. (Middle panel) Number of colonies of LOC-overexpressing cells (LOC) and control (Ctrl) in soft agar. Colonies were stained with 1% (w/v) methyl green in methanol after incubating for 30 days post seeding. (Bottom panel) Representative figures taken from soft agar plates. B) (Top panel) Relative expression of LOC after knockdown in HepG2 cells (siLOC) compared to the knockdown control (siCtrl), as detected by qPCR. The expression is normalized against actin. (Middle panel) Number of colonies of LOC knockdown cells (siLOC) and control (siCtrl) in soft agar. Colonies were stained with 1%(w/v) methyl green in methanol after incubating for 28 days post seeding. (Bottom panel) Representative figures taken from soft agar plates. All data are shown as mean±SE of three biological replicates. **: P<0.01 compared with control. C) (Top panel) Representative gel image shows multiplex PCR result of actin and LOC expression in LOC-overexpressing cells (LOC), control cells (Ctrl) and water as a negative control. (Middle panel) Invasion profile of LOC-transfected cells (LOC) and control (Ctrl) using Transwell Matrigel assay. Cells were stained with Giemsa Stain solution before visualization under light microscope (x20 magnification). (Bottom panel) Representative pictures of invaded cells. ***: P<0.001 compared with control. D) (Top panel) Relative expression of LOC after knockdown in HepG2 cells (siLOC) compared to the knockdown control (siCtrl), as detected by qPCR. The expression is normalized against actin. (Middle panel) Invasion profile of LOC knockdown cells (siLOC) and control (siCtrl) using Transwell Matrigel assay. Cells were stained with Giemsa Stain solution before visualization under light microscope (x20 magnification). (Bottom panel) Representative pictures of invaded cells. All data are shown as mean±SE of three biological replicates. *:P<0.05 compared with control.
Figure 6
Figure 6
Identification of LOC regulated genes and their associated pathways. A) Subcellular localization of LOC is predicted using lnclocator (http://www.csbio.sjtu.edu.cn/bioinf/lncLocator/). B) Cytoplasmic and nuclear RNA fraction was separated using cytoplasmic and nuclear RNA purification kit and PCR was used to detect lncRNA expression. Quantification of lncRNA level is done by quantifying band intensity on gel image using Image J software. HOTAIR is a well characterized RNA localized in the nuclear while Actin is a well characterized RNA localized in the cytoplasm. Data are shown as mean±SE of three biological replicates. C) Workflow to identify potential genes regulated by LOC. RNA sequencing was performed in LOC overexpressing cells, LOC knockdown cells and respective controls. Genes that were expressed with |FC|≥ 2 in LOC vs Ctrl and siLOC vs siCtrl as well as expressed in opposite direction in both cells were included for pathway analysis. D) Pathways associated with LOC upregulated genes are GTPase activity, nucleoside-triphosphatase regulator activity, positive regulation of hydrolase activity. E) Pathways associated with LOC downregulated genes are cellular detoxification, oxygen transport and drug transport.
Figure 7
Figure 7
Summary of LOC expression, clinical association in patient tissues as well as experimental validated phenotypes and pathways. Possible mechanisms of LOC in gene regulation are shown in the dotted box with grey background. Red arrow: Upregulated; Green arrow: Downregulated.

Similar articles

Cited by

References

    1. Bray F, Ferlay J, Soerjomataram I, Siegel RL, Torre LA, Jemal A. Global cancer statistics 2018: GLOBOCAN estimates of incidence and mortality worldwide for 36 cancers in 185 countries. CA Cancer J Clin. 2018;68:394–424. - PubMed
    1. Farazi PA, DePinho RA. Hepatocellular carcinoma pathogenesis: from genes to environment. Nat Rev Cancer. 2006;6:674–87. - PubMed
    1. Sia D, Villanueva A, Friedman SL, Llovet JM. Liver Cancer Cell of Origin, Molecular Class, and Effects on Patient Prognosis. Gastroenterology. 2017;152:745–61. - PubMed
    1. Hartke J, Johnson M, Ghabril M. The diagnosis and treatment of hepatocellular carcinoma. Semin Diagn Pathol. 2017;34:153–9. - PubMed
    1. Yang JD, Roberts LR. Hepatocellular carcinoma: A global view. Nat Rev Gastroenterol Hepatol. 2010;7:448–58. - PMC - PubMed

LinkOut - more resources