Signature of gene aberrant alternative splicing events in pancreatic adenocarcinoma prognosis
- PMID: 33976726
- PMCID: PMC8100795
- DOI: 10.7150/jca.48661
Signature of gene aberrant alternative splicing events in pancreatic adenocarcinoma prognosis
Abstract
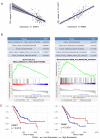
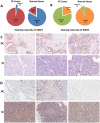
Alternative splicing (AS), as an effective and universal mechanism of transcriptional regulation, is involved in the development and progression of cancer. Therefore, systematic analysis of alternative splicing in pancreatic adenocarcinoma (PAAD) is warranted. The corresponding clinical information of the RNA-Seq data and PAAD cohort was downloaded from the TCGA data portal. Then, a java application, SpliceSeq, was used to evaluate the RNA splicing pattern and calculate the splicing percentage index (PSI). Differentially expressed AS events (DEAS) were identified based on PSI values between PAAD cancer samples and normal samples of adjacent tissues. Kaplan-Meier and Cox regression analyses were used to assess the association between DEAS and patient clinical characteristics. Unsupervised cluster analysis used to reveal four clusters with different survival patterns. At the same time, GEO and TCGA combined with GTEx to verify the differential expression of AS gene and splicing factor. After rigorous filtering, a total of 45,313 AS events were identified, 1,546 of which were differentially expressed AS events. Nineteen DEAS were found to be associated with OS with a five-year overall survival rate of 0.946. And the subtype clusters results indicate that there are differences in the nature of individual AS that affect clinical outcomes. Results also identified 15 splicing factors associated with the prognosis of PAAD. And the splicing factors ESRP1 and RBM5 played an important role in the PAAD-associated AS events. The PAAD-associated AS events, splicing networks, and clusters identified in this study are valuable for deciphering the underlying mechanisms of AS in PAAD and may facilitate the establishment of therapeutic goals for further validation.
Keywords: alternative splicing; alternative splicing factors.; genomic analysis; pancreatic adenocarcinoma; risk model.
© The author(s).
Conflict of interest statement
Competing Interests: The authors have declared that no competing interest exists.
Figures


Similar articles
-
Profiles of alternative splicing in colorectal cancer and their clinical significance: A study based on large-scale sequencing data.EBioMedicine. 2018 Oct;36:183-195. doi: 10.1016/j.ebiom.2018.09.021. Epub 2018 Sep 19. EBioMedicine. 2018. PMID: 30243491 Free PMC article.
-
Systematic profiling of alternative splicing signature reveals prognostic predictor for prostate cancer.Cancer Sci. 2020 Aug;111(8):3020-3031. doi: 10.1111/cas.14525. Epub 2020 Jul 9. Cancer Sci. 2020. PMID: 32530556 Free PMC article.
-
Systematic Analyses of the Differentially Expressed Alternative Splicing Events in Gastric Cancer and Its Clinical Significance.Front Genet. 2020 Nov 17;11:522831. doi: 10.3389/fgene.2020.522831. eCollection 2020. Front Genet. 2020. PMID: 33281863 Free PMC article.
-
Potential impact of epithelial splicing regulatory protein 1 (ESRP1) associated with tumor immunity in pancreatic adenocarcinoma.J Proteomics. 2024 Sep 30;308:105277. doi: 10.1016/j.jprot.2024.105277. Epub 2024 Aug 8. J Proteomics. 2024. PMID: 39127164
-
Identification of a competing endogenous RNA network associated with prognosis of pancreatic adenocarcinoma.Cancer Cell Int. 2020 Jun 11;20:231. doi: 10.1186/s12935-020-01243-6. eCollection 2020. Cancer Cell Int. 2020. PMID: 32536819 Free PMC article. Review.
Cited by
-
ZMAT2 condensates regulate the alternative splicing of TRIM28 to reduce cellular ROS accumulation, thereby promoting the proliferation of HCC cells.Cell Commun Signal. 2024 Aug 20;22(1):407. doi: 10.1186/s12964-024-01790-9. Cell Commun Signal. 2024. PMID: 39164737 Free PMC article.
-
Comprehensive analysis of alternative splicing signatures in pancreatic head cancer.IET Syst Biol. 2023 Feb;17(1):14-26. doi: 10.1049/syb2.12056. Epub 2022 Dec 7. IET Syst Biol. 2023. PMID: 36479597 Free PMC article.
-
CDKL3 is a promising biomarker for diagnosis and prognosis prediction in patients with hepatocellular carcinoma.Exp Biol Med (Maywood). 2024 Jun 27;249:10106. doi: 10.3389/ebm.2024.10106. eCollection 2024. Exp Biol Med (Maywood). 2024. PMID: 38993199 Free PMC article.
-
RBFOX2 deregulation promotes pancreatic cancer progression and metastasis through alternative splicing.Nat Commun. 2023 Dec 19;14(1):8444. doi: 10.1038/s41467-023-44126-w. Nat Commun. 2023. PMID: 38114498 Free PMC article.
-
Identification of EMT-related alternative splicing event of TMC7 to promote invasion and migration of pancreatic cancer.Front Immunol. 2023 Jan 12;13:1089008. doi: 10.3389/fimmu.2022.1089008. eCollection 2022. Front Immunol. 2023. PMID: 36713450 Free PMC article.
References
-
- Siegel RL, Miller KD, Jemal A. Cancer statistics, 2018. CA: a cancer journal for clinicians. 2018;68:7–30. - PubMed
-
- Rahib L, Smith BD, Aizenberg R, Rosenzweig AB, Fleshman JM, Matrisian LM. Projecting cancer incidence and deaths to 2030: The unexpected burden of thyroid, liver, and pancreas cancers in the United States. Cancer research. 2014;74:2913–21. - PubMed
-
- Ge Y, Porse BT. The functional consequences of intron retention: Alternative splicing coupled to NMD as a regulator of gene expression. BioEssays: news and reviews in molecular, cellular and developmental biology. 2014;36:236–43. - PubMed
LinkOut - more resources
Full Text Sources
Other Literature Sources
Research Materials

