

High expression of TREM2 promotes EMT via the PI3K/AKT pathway in gastric cancer: bioinformatics analysis and experimental verification
- PMID: 33976737
- PMCID: PMC8100818
- DOI: 10.7150/jca.55077
High expression of TREM2 promotes EMT via the PI3K/AKT pathway in gastric cancer: bioinformatics analysis and experimental verification
Abstract
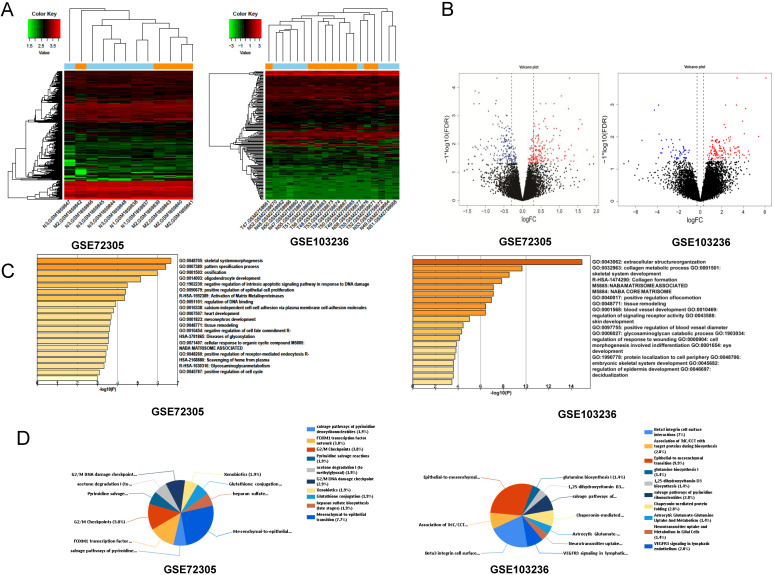
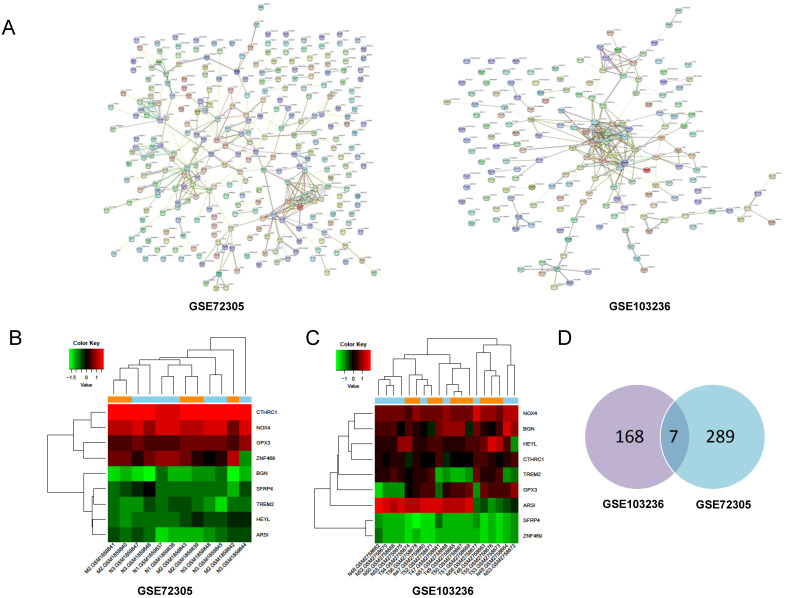
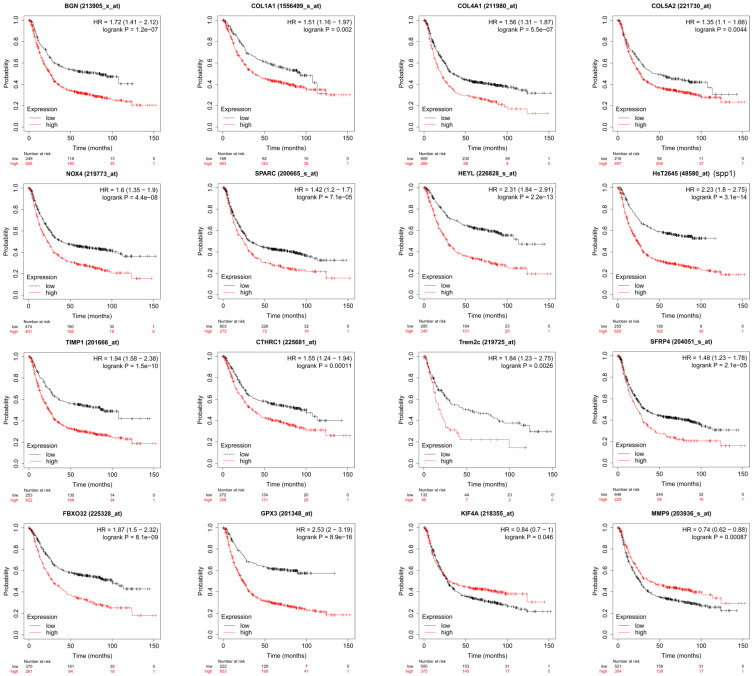
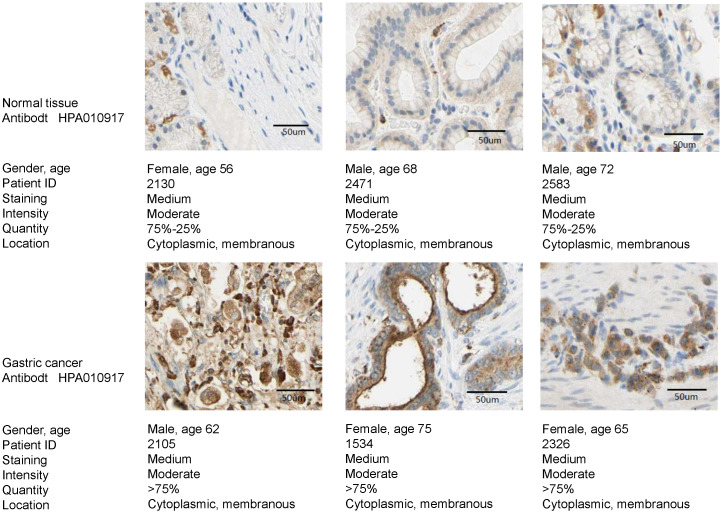
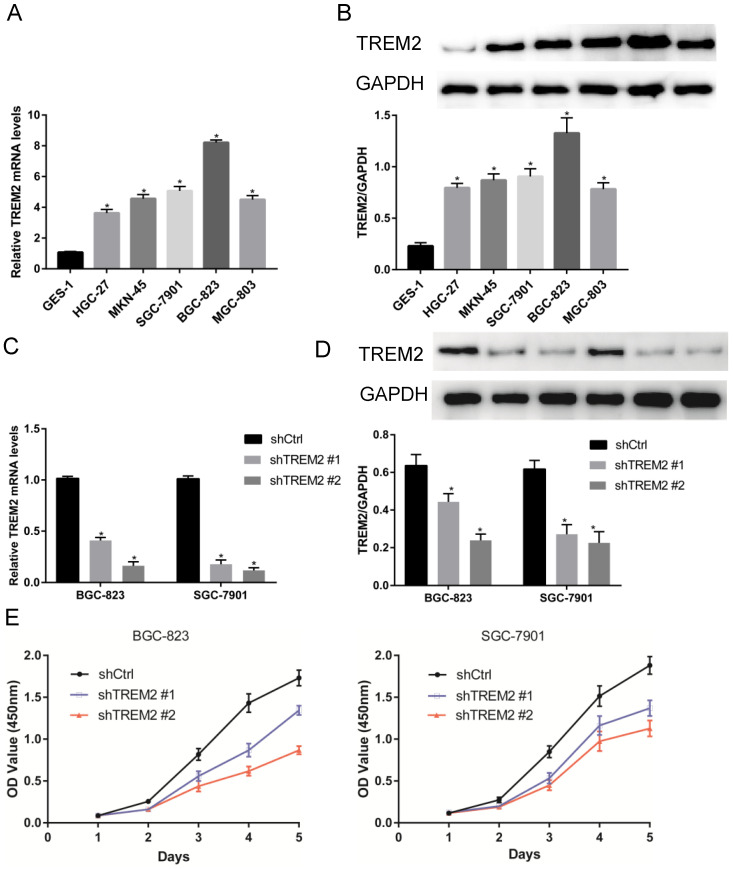
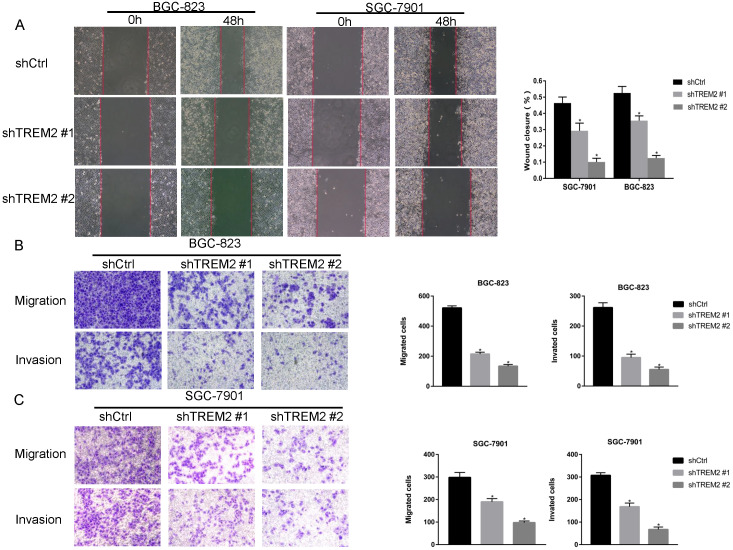
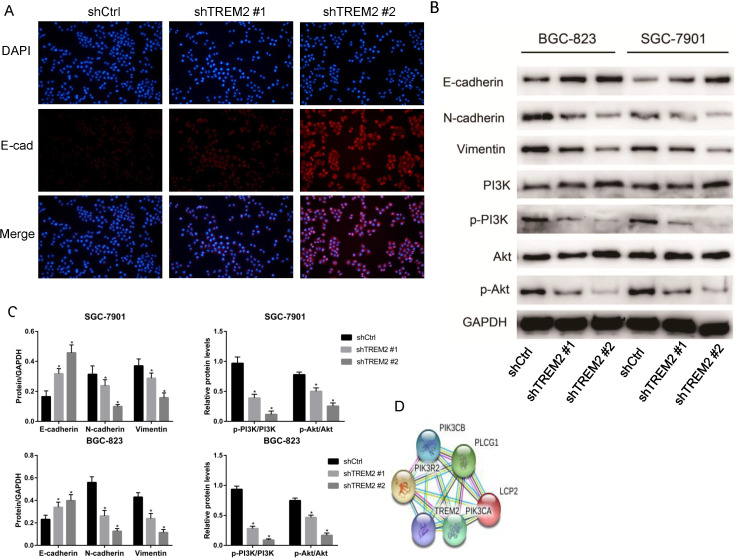
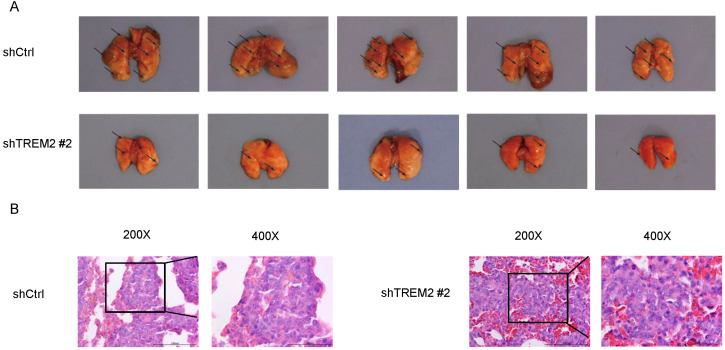
Background: To date, the pathogenesis of gastric cancer (GC) remains unclear. We combined public database resources and bioinformatics analysis methods, explored some novel genes and verified the experiments to further understand the pathogenesis of GC and to provide a promising target for anti-tumor therapy. Methods: We downloaded the chip data related to GC from the Gene Expression Omnibus (GEO) database, extracted differentially expressed genes (DEGs), and then determined the key genes in the development of GC via PPI networks and model analysis. Functional annotation via GO and KEGG enrichment of DEGs was used to understand the latent roles of DEGs. The expression of the triggering receptor expressed on myeloid cells 2 (TREM2) gene in GC cell lines was verified via RT-PCR and western blotting. Moreover, the CCK-8, wound healing assay, and transwell migration and invasion assays were used to understand the changes in the proliferation, migration, and invasion abilities of GC cells after silencing TREM2. Western blotting verified the interaction between TREM2 and PI3K predict of the string website, as well as the effect of TREM2 on EMT. Finally, a lung metastasis model was used to explore the relationship between TREM2 and metastasis. Results: Our study identified 16 key genes, namely BGN, COL1A1, COL4A1, COL5A2, NOX4, SPARC, HEYL, SPP1, TIMP1, CTHRC1, TREM2, SFRP4, FBXO32, GPX3, KIF4A, and MMP9 genes associated with GC. The EMT-related pathway was the most significantly altered pathway. TREM2 expression was higher in GC cell lines and was remarkably associated with tumor invasion depth, TNM stage, histological grade, histological type, anatomic subdivision, and Helicobacter pylori state. Knockdown of TREM2 expression inhibited the proliferation, migration, and invasion of GC cells as well as the progression of EMT by PI3K/AKT signaling in vitro. In addition, lung metastasis were decreased in vivo. Conclusions: We identified some important genes associated with the progression of GC via public database analysis, explored and verified the effects of proto-oncogene TREM2 on EMT via the PI3K/AKT pathway. TREM2 may be a novel target in the GC therapy.
Keywords: EMT; PI3K/AKT pathway; TREM2; bioinformatics; gastric cancer (GC).
© The author(s).
Conflict of interest statement
Competing Interests: The authors have declared that no competing interest exists.
Figures
Similar articles
-
TEAD4 functions as a prognostic biomarker and triggers EMT via PI3K/AKT pathway in bladder cancer.J Exp Clin Cancer Res. 2022 May 17;41(1):175. doi: 10.1186/s13046-022-02377-3. J Exp Clin Cancer Res. 2022. PMID: 35581606 Free PMC article.
-
CALD1 facilitates epithelial-mesenchymal transition progression in gastric cancer cells by modulating the PI3K-Akt pathway.World J Gastrointest Oncol. 2024 Mar 15;16(3):1029-1045. doi: 10.4251/wjgo.v16.i3.1029. World J Gastrointest Oncol. 2024. PMID: 38577446 Free PMC article.
-
Compound Kushen injection inhibits EMT of gastric cancer cells via the PI3K/AKT pathway.World J Surg Oncol. 2022 May 20;20(1):161. doi: 10.1186/s12957-022-02609-y. World J Surg Oncol. 2022. PMID: 35590327 Free PMC article.
-
Bioinformatics Analysis of Key Genes and circRNA-miRNA-mRNA Regulatory Network in Gastric Cancer.Biomed Res Int. 2020 Aug 22;2020:2862701. doi: 10.1155/2020/2862701. eCollection 2020. Biomed Res Int. 2020. PMID: 32908877 Free PMC article.
-
Mechanisms of TREM2 mediated immunosuppression and regulation of cancer progression.Front Oncol. 2024 Apr 25;14:1375729. doi: 10.3389/fonc.2024.1375729. eCollection 2024. Front Oncol. 2024. PMID: 38725629 Free PMC article. Review.
Cited by
-
Construction of 11 metabolic-related lncRNAs to predict the prognosis in lung adenocarcinoma.BMC Med Genomics. 2023 Dec 18;16(1):330. doi: 10.1186/s12920-023-01764-9. BMC Med Genomics. 2023. PMID: 38110999 Free PMC article.
-
Tumor-related exosomal circ_0001715 promotes lung adenocarcinoma cell proliferation and metastasis via enhancing M2 macrophage polarization by regulating triggering receptor expressed on myeloid cells-2.Thorac Cancer. 2024 Jan;15(3):227-238. doi: 10.1111/1759-7714.15182. Epub 2023 Dec 12. Thorac Cancer. 2024. PMID: 38087801 Free PMC article.
-
PI3K/AKT/mTOR Axis in Cancer: From Pathogenesis to Treatment.MedComm (2020). 2025 Jul 30;6(8):e70295. doi: 10.1002/mco2.70295. eCollection 2025 Aug. MedComm (2020). 2025. PMID: 40740483 Free PMC article. Review.
-
TREM2+ macrophages: a key role in disease development.Front Immunol. 2025 Apr 2;16:1550893. doi: 10.3389/fimmu.2025.1550893. eCollection 2025. Front Immunol. 2025. PMID: 40242752 Free PMC article. Review.
-
Knockdown of kinesin family member 4A inhibits cell proliferation, migration, and invasion while promoting apoptosis of urothelial bladder carcinoma cells.Cancer Med. 2023 Jun;12(11):12581-12592. doi: 10.1002/cam4.5932. Epub 2023 Apr 11. Cancer Med. 2023. PMID: 37039264 Free PMC article.
References
-
- Bray F, Ferlay J, Soerjomataram I, Siegel RL, Torre LA, Jemal A. Global cancer statistics 2018: GLOBOCAN estimates of incidence and mortality worldwide for 36 cancers in 185 countries. CA Cancer J Clin. 2018;68:394–424. - PubMed
-
- Hackl H, Charoentong P, Finotello F, Trajanoski Z. Computational genomics tools for dissecting tumour-immune cell interactions. Nature reviews Genetics. 2016;17:441–58. - PubMed
LinkOut - more resources
Full Text Sources
Other Literature Sources
Research Materials
Miscellaneous
