

Considering sampling bias in close-kin mark-recapture abundance estimates of Atlantic salmon
- PMID: 33976784
- PMCID: PMC8093659
- DOI: 10.1002/ece3.7279
Considering sampling bias in close-kin mark-recapture abundance estimates of Atlantic salmon
Abstract
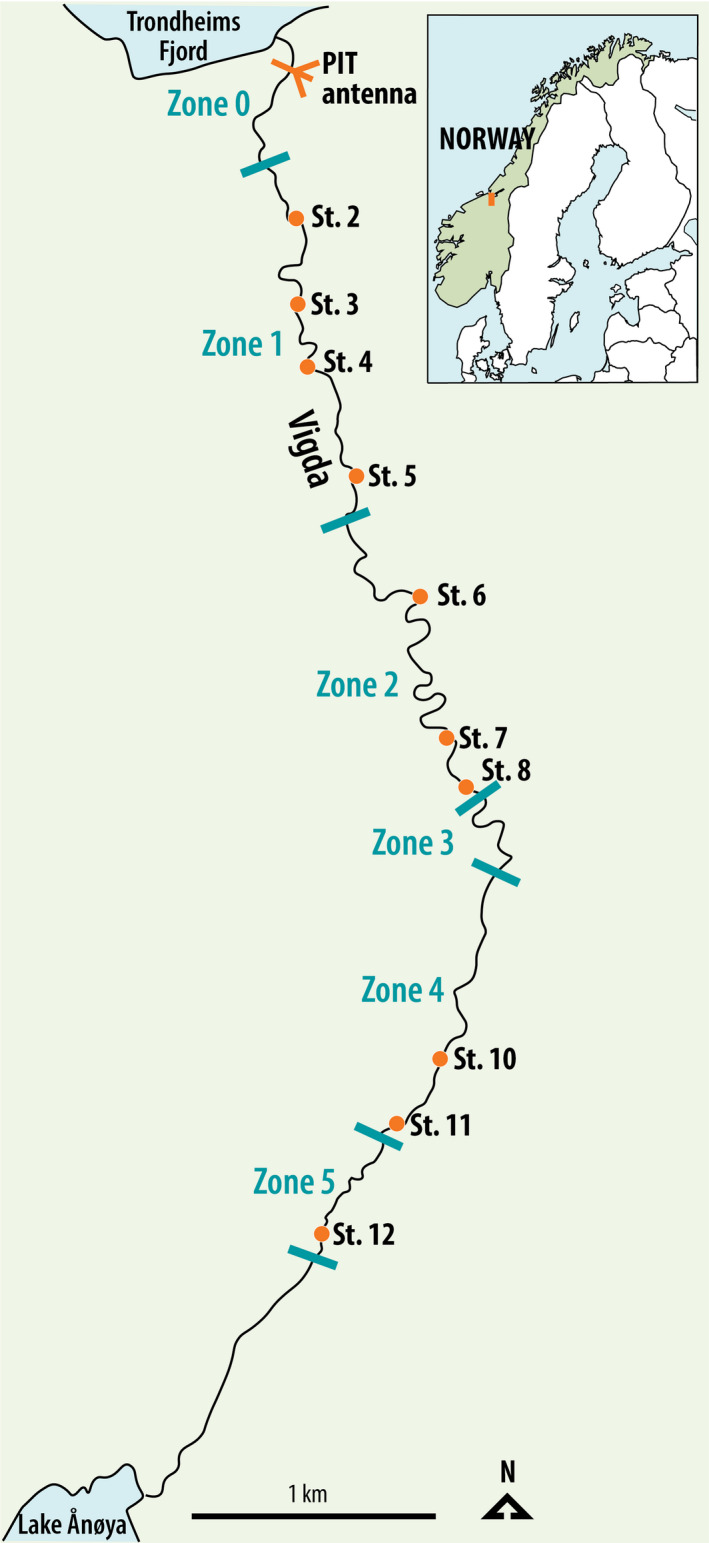
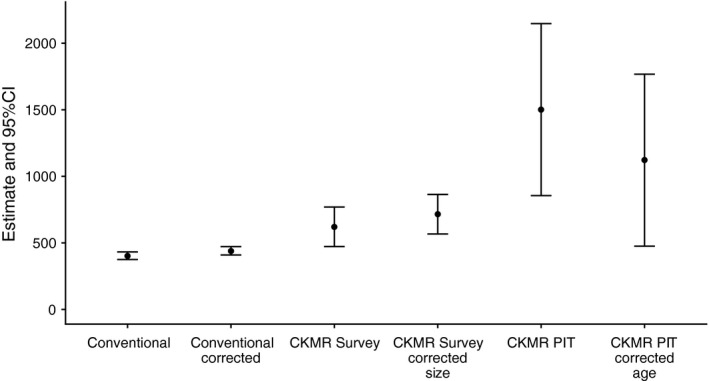
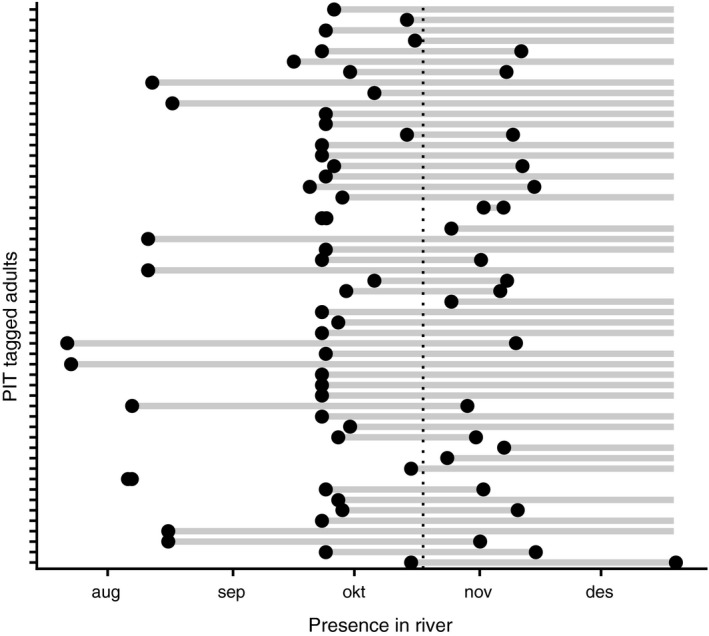
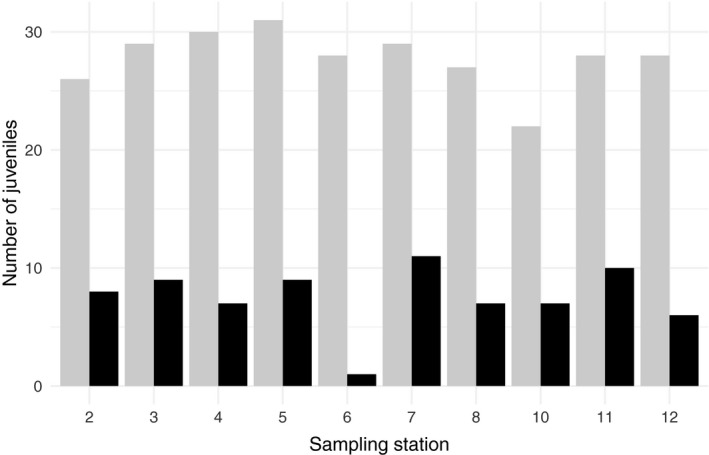
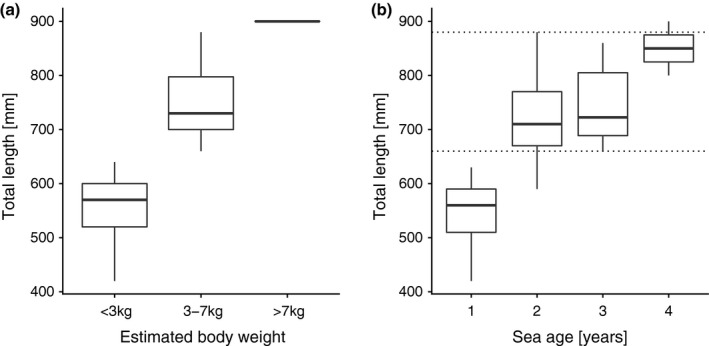
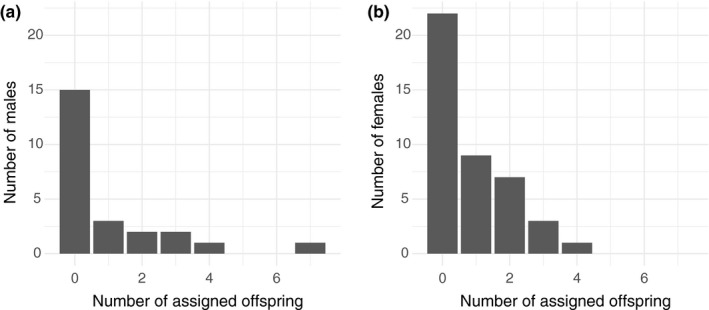
Genetic methods for the estimation of population size can be powerful alternatives to conventional methods. Close-kin mark-recapture (CKMR) is based on the principles of conventional mark-recapture, but instead of being physically marked, individuals are marked through their close kin. The aim of this study was to evaluate the potential of CKMR for the estimation of spawner abundance in Atlantic salmon and how age, sex, spatial, and temporal sampling bias may affect CKMR estimates. Spawner abundance in a wild population was estimated from genetic samples of adults returning in 2018 and of their potential offspring collected in 2019. Adult samples were obtained in two ways. First, adults were sampled and released alive in the breeding habitat during spawning surveys. Second, genetic samples were collected from out-migrating smolts PIT-tagged in 2017 and registered when returning as adults in 2018. CKMR estimates based on adult samples collected during spawning surveys were somewhat higher than conventional counts. Uncertainty was small (CV < 0.15), due to the detection of a high number of parent-offspring pairs. Sampling of adults was age- and size-biased and correction for those biases resulted in moderate changes in the CKMR estimate. Juvenile dispersal was limited, but spatially balanced sampling of adults rendered CKMR estimates robust to spatially biased sampling of juveniles. CKMR estimates based on returning PIT-tagged adults were approximately twice as high as estimates based on samples collected during spawning surveys. We suggest that estimates based on PIT-tagged fish reflect the total abundance of adults entering the river, while estimates based on samples collected during spawning surveys reflect the abundance of adults present in the breeding habitat at the time of spawning. Our study showed that CKMR can be used to estimate spawner abundance in Atlantic salmon, with a moderate sampling effort, but a carefully designed sampling regime is required.
Keywords: Atlantic salmon; Lincoln‐Petersen; abundance estimation; census size; close‐kin mark–recapture; mating success; mature male parr; population size; reproductive success; sampling bias.
© 2021 The Authors. Ecology and Evolution published by John Wiley & Sons Ltd.
Conflict of interest statement
None declared.
Figures
Similar articles
-
Robustness of close-kin mark-recapture estimators to dispersal limitation and spatially varying sampling probabilities.Ecol Evol. 2020 May 5;10(12):5558-5569. doi: 10.1002/ece3.6296. eCollection 2020 Jun. Ecol Evol. 2020. PMID: 32607174 Free PMC article.
-
Temporal Variability in Effective Size ( ) Identifies Potential Sources of Discrepancies Between Mark Recapture and Close Kin Mark Recapture Estimates of Population Abundance.Mol Ecol Resour. 2025 Apr;25(3):e14047. doi: 10.1111/1755-0998.14047. Epub 2024 Nov 24. Mol Ecol Resour. 2025. PMID: 39582254 Free PMC article.
-
Sources of bias in applying close-kin mark-recapture to terrestrial game species with different life histories.Ecology. 2024 Mar;105(3):e4244. doi: 10.1002/ecy.4244. Epub 2024 Jan 25. Ecology. 2024. PMID: 38272487
-
Assessing the suitability of a one-time sampling event for close-kin mark-recapture: A caribou case study.Ecol Evol. 2024 Sep 3;14(9):e70230. doi: 10.1002/ece3.70230. eCollection 2024 Sep. Ecol Evol. 2024. PMID: 39234160 Free PMC article.
-
Accounting for unobserved population dynamics and aging error in close-kin mark-recapture assessments.Ecol Evol. 2024 Feb 7;14(2):e10854. doi: 10.1002/ece3.10854. eCollection 2024 Feb. Ecol Evol. 2024. PMID: 38327683 Free PMC article.
Cited by
-
Age is not just a number: How incorrect ageing impacts close-kin mark-recapture estimates of population size.Ecol Evol. 2024 Jun 4;14(6):e11352. doi: 10.1002/ece3.11352. eCollection 2024 Jun. Ecol Evol. 2024. PMID: 38840589 Free PMC article.
-
Reliability of trans-generational genetic mark-recapture (tGMR) for enumerating Pacific salmon.Evol Appl. 2024 Feb 7;17(2):e13647. doi: 10.1111/eva.13647. eCollection 2024 Feb. Evol Appl. 2024. PMID: 38333554 Free PMC article.
-
Microsatellites as Molecular Markers with Applications in Exploitation and Conservation of Aquatic Animal Populations.Genes (Basel). 2023 Mar 27;14(4):808. doi: 10.3390/genes14040808. Genes (Basel). 2023. PMID: 37107566 Free PMC article. Review.
-
Close-kin mark-recapture informs critically endangered terrestrial mammal status.Sci Rep. 2023 Aug 2;13(1):12512. doi: 10.1038/s41598-023-38639-z. Sci Rep. 2023. PMID: 37532795 Free PMC article.
-
Evaluating the suitability of close-kin mark-recapture as a demographic modelling tool for a critically endangered elasmobranch population.Evol Appl. 2022 Sep 3;16(2):461-473. doi: 10.1111/eva.13474. eCollection 2023 Feb. Evol Appl. 2022. PMID: 36793682 Free PMC article.
References
-
- Allendorf, F. W. , & Phelps, S. R. (1981). Use of allelic frequencies to describe population structure. Canadian Journal of Fisheries and Aquatic Sciences, 38, 1507–1514. 10.1139/f81-203 - DOI
-
- Anon (2009). Status for norske laksebestander i 2009 og råd om beskatning (pp. 1–230). Vitenskapelig råd for lakseforvaltning (in Norwegian).
-
- Bacles, C. F. E. , Bouchard, C. , Lange, F. , Manicki, A. , Tentelier, C. , & Lepais, O. (2018). Estimating the effective number of breeders from single parr samples for conservation monitoring of wild populations of Atlantic salmon Salmo salar. Journal of Fish Biology, 92, 699–726. - PubMed
-
- Begon, M. , Townsend, C. R. , & Harper, J. L. (2005). Ecology: From individuals to ecosystems. Blackwell Publishing.
-
- Bourret, V. , Kent, M. P. , Primmer, C. R. , Vasemagi, A. , Karlsson, S. , Hindar, K. , Mcginnity, P. , Verspoor, E. , Bernatchez, L. , & Lien, S. (2013). SNP‐array reveals genome‐wide patterns of geographical and potential adaptive divergence across the natural range of Atlantic salmon (Salmo salar). Molecular Ecology, 22, 532–551. - PubMed
Associated data
LinkOut - more resources
Full Text Sources
Other Literature Sources
