. 2021 Mar 16;11(9):3956-3976.
doi: 10.1002/ece3.7290. eCollection 2021 May.

Cell size, genome size, and maximum growth rate are near-independent dimensions of ecological variation across bacteria and archaea

Affiliations

Cell size, genome size, and maximum growth rate are near-independent dimensions of ecological variation across bacteria and archaea

Mark Westoby et al. Ecol Evol. .

Abstract

Among bacteria and archaea, maximum relative growth rate, cell diameter, and genome size are widely regarded as important influences on ecological strategy. Via the most extensive data compilation so far for these traits across all clades and habitats, we ask whether they are correlated and if so how. Overall, we found little correlation among them, indicating they should be considered as independent dimensions of ecological variation. Nor was correlation evident within particular habitat types. A weak nonlinearity (6% of variance) was found whereby high maximum growth rates (temperature-adjusted) tended to occur in the midrange of cell diameters. Species identified in the literature as oligotrophs or copiotrophs were clearly separated on the dimension of maximum growth rate, but not on the dimensions of genome size or cell diameter.

Keywords: archaea; bacteria; cell diameter; ecological strategies; genome size; maximum growth rate; traits.


Conflict of interest statement

None of the authors have any conflict of interest.

Figures

FIGURE 1
FIGURE 1
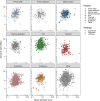
(a) Temperature‐adjusted maximum growth rate in relation to genome size across species. (b) Temperature‐adjusted maximum growth rate in relation to cell radial diameter across species. (c) Genome size in relation to cell radial diameter. Dashed lines indicate density contours. In the habitat classification (color scheme), fresh and marine waters include both water and sediment. Host‐associated species are attributed to endotherm or to ectotherm hosts if they multiply within the host body or gut, or to “other” if they grow on the host's external surface or are associated with plants, algae, or fungi or have no habitat attributed. Species identified in the literature (Table A1) as copiotrophs or oligotrophs are denoted by squares and triangles, respectively
FIGURE 2
FIGURE 2
Temperature‐adjusted maximum growth rate in relation to cell diameter, with polynomial fits separated by habitat. The model (Table 2) accounts for about 17% of variance in log temp‐adjusted maximum growth rate in total, with habitat contributing about 11% and nonlinear response to cell diameter about 6%. Coefficients of the model are in Table A3. While the models in Table 2 use only species for which all data are available so that AIC is comparable, use of all available species for each model (Table A4) shows similar patterns
FIGURE 3
FIGURE 3
Genome size in relation to cell radial diameter, separated by habitat type. Symbols as in Figure 1
FIGURE A1
FIGURE A1
Relationship across species between number of different coding genes and total genome size. Ordinary least squares regression has r 2 of .976 across 3,300 species. In the habitat classification (color scheme), fresh and marine waters include both water and sediment. Intracellular species are those making a living inside eukaryote cells. Host‐associated species are attributed to endotherm or to ectotherm hosts if they multiply within the host body or gut, or to “other” if they grow on the host’s external surface or are associated with plants, algae, or fungi. Species without habitat information are also attributed to “other.” Species identified in the literature as copiotrophs or oligotrophs (Table A1) are denoted by squares and triangles, respectively
FIGURE A2
FIGURE A2
Temperature‐adjusted maximum growth rate in relation to genome size across species, including intracellular species. 646 species, r 2 = .0066. Dotted lines are density contours. Habitat and copiotrophy–oligotrophy coding as in Figure A1
FIGURE A3
FIGURE A3
Temperature‐adjusted maximum growth rate in relation to cell radial diameter across species, including intracellular species. 529 species, r 2 = .00044. Habitat and copiotrophy–oligotrophy coding as in Figure A1
FIGURE A4
FIGURE A4
Genome size in relation to cell radial diameter across species, including intracellular species. 3,502 species, r 2 = .019. Habitat and copiotrophy–oligotrophy coding as in Figure A1
FIGURE A5
FIGURE A5
Temperature‐adjusted maximum growth rate in relation to genome size across species, showing archaea vs bacteria and excluding intracellular species. Species identified in the literature (Table A1) as copiotrophs or oligotrophs are denoted by squares and triangles respectively
FIGURE A6
FIGURE A6
Temperature‐adjusted maximum growth rate in relation to mean cell radial diameter across species, distinguishing archaea from bacteria
FIGURE A7
FIGURE A7
Genome size in relation to mean cell radial diameter across species, distinguishing archaea from bacteria
FIGURE A8
FIGURE A8
Relationship across species between ribosomal RNA operon copy number and temperature‐adjusted maximum growth rate; r 2 = .30 across 389 species. rRNA operon counts have been averaged across multiple records within species, where available, hence noninteger counts sometimes appear. Host‐associated species were attributed to endotherm or ectotherm hosts, or to “other” if they came from external animal surface or were associated with plants, algae, or fungi, or had no habitat attributed. Species identified in the literature (Table A1) as copiotrophs or oligotrophs are denoted by squares and triangles, respectively
FIGURE A9
FIGURE A9
Genome size in relation to rRNA operon copy number; r 2 = .14 across 2,727 species, or if those with growth temperature >50°C are excluded, r 2 = .048 across 1,666 species. In the habitat classification (color scheme), fresh and marine waters include both water and sediment. Host‐associated species are attributed to endotherm or to ectotherm hosts if they multiply within the host body or gut, or to “other” if they grow on the host’s external surface or are associated with plants, algae, or fungi, or have no habitat attributed. Species identified in the literature (Table A1) as copiotrophs or oligotrophs are denoted by squares and triangles, respectively
FIGURE A10
FIGURE A10
Cell radial diameter in relation to rRNA operon copy number; r 2 = .023 across 926 species. In the habitat classification (color scheme), fresh and marine waters include both water and sediment. Host‐associated species are attributed to endotherm or to ectotherm hosts if they multiply within the host body or gut, or to “other” if they grow on the host’s external surface or are associated with plants, algae, or fungi, or are not attributed to any habitat. Species identified in the literature (Table A1) as copiotrophs or oligotrophs are denoted by squares and triangles, respectively
FIGURE A11
FIGURE A11
Mean cell radial diameter in relation to genome size, separating rod‐shaped bacilli from near‐spheroidal cocci and coccobacilli. Species identified in the literature (Table A1) as copiotrophs and oligotrophs are denoted by squares and triangles, respectively
FIGURE B1
FIGURE B1
Maximum growth rate in relation to cell volume across 390 species, including intracellular, from our data. R 2 = .00043, F‐statistic 0.1659 on 1 and 382 df, p‐value .684
FIGURE B2
FIGURE B2
Genome size in relation to cell volume across 2,628 species, including intracellular, from our data. R 2 = .01989, F‐statistic 53.32 on 1 and 2,627 df. Leaving out the 14 intracellular species R 2 = .0119, F‐statistic 31.69 on 1 and 2,613 df

References

    1. Bobay, L.‐M. , & Ochman, H. (2018). Factors driving effective population size and pan‐genome evolution in bacteria. BMC Evolutionary Biology, 18(1), 1–12. 10.1186/s12862-018-1272-4 - DOI - PMC - PubMed
    1. Boutte, C. C. , & Crosson, S. (2013). Bacterial lifestyle shapes stringent response activation. Trends in Microbiology, 21(4), 174–180. 10.1016/j.tim.2013.01.002 - DOI - PMC - PubMed
    1. Chang, Y.‐Y. , Hagawa, S. , & Hsu, C.‐H. (2020). Adaptation of thermophilic acetyltransferase to a water‐mediated catalytic mechanism. Chemical Communications, 56(72), 10537–10540. 10.1039/D0CC04305B - DOI - PubMed
    1. Cho, J.‐C. , & Giovannoni, S. J. (2004). Cultivation and growth characteristics of a diverse group of oligotrophic marine gammaproteobacteria. Applied and Environmental Microbiology, 70(1), 432–440. 10.1128/AEM.70.1.432-440.2004 - DOI - PMC - PubMed
    1. Cottrell, M. T. , & Kirchman, D. L. (2016). Transcriptional control in marine copiotrophic and oligotrophic bacteria with streamlined genomes. Applied and Environmental Microbiology, 82(19), 6010–6018. 10.1128/AEM.01299-16 - DOI - PMC - PubMed

LinkOut - more resources