

Assessing invertebrate herbivory in human-modified tropical forest canopies
- PMID: 33976790
- PMCID: PMC8093672
- DOI: 10.1002/ece3.7295
Assessing invertebrate herbivory in human-modified tropical forest canopies
Abstract
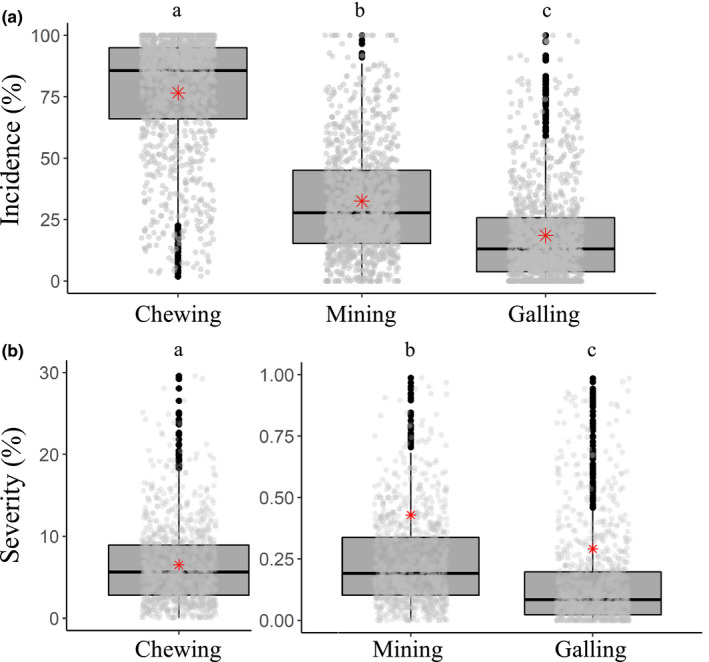
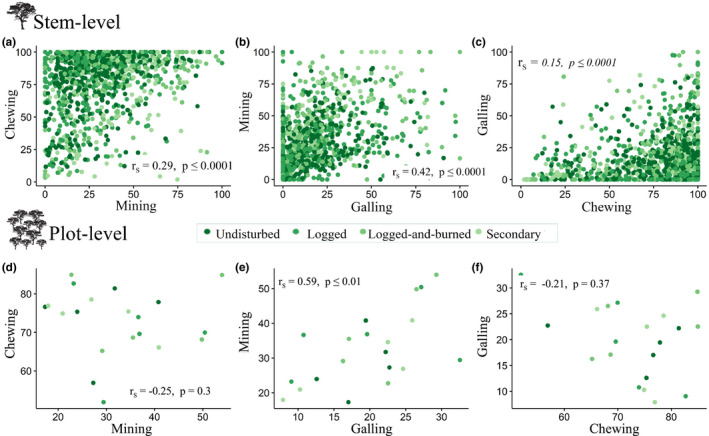
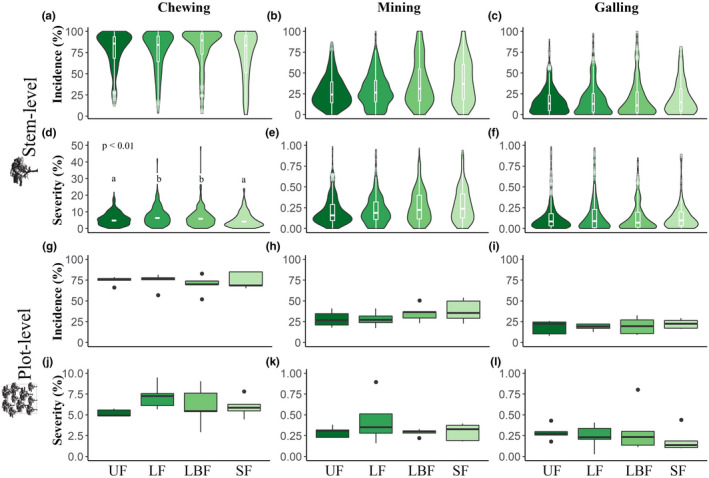
Studies on the effects of human-driven forest disturbance usually focus on either biodiversity or carbon dynamics but much less is known about ecosystem processes that span different trophic levels. Herbivory is a fundamental ecological process for ecosystem functioning, but it remains poorly quantified in human-modified tropical rainforests.Here, we present the results of the largest study to date on the impacts of human disturbances on herbivory. We quantified the incidence (percentage of leaves affected) and severity (the percentage of leaf area lost) of canopy insect herbivory caused by chewers, miners, and gall makers in leaves from 1,076 trees distributed across 20 undisturbed and human-modified forest plots in the Amazon.We found that chewers dominated herbivory incidence, yet were not a good predictor of the other forms of herbivory at either the stem or plot level. Chewing severity was higher in both logged and logged-and-burned primary forests when compared to undisturbed forests. We found no difference in herbivory severity between undisturbed primary forests and secondary forests. Despite evidence at the stem level, neither plot-level incidence nor severity of the three forms of herbivory responded to disturbance. Synthesis. Our large-scale study of canopy herbivory confirms that chewers dominate the herbivory signal in tropical forests, but that their influence on leaf area lost cannot predict the incidence or severity of other forms. We found only limited evidence suggesting that human disturbance affects the severity of leaf herbivory, with higher values in logged and logged-and-burned forests than undisturbed and secondary forests. Additionally, we found no effect of human disturbance on the incidence of leaf herbivory.
Keywords: Amazon rainforest; biodiversity and ecosystem functioning; environmental gradient; folivory; forest degradation; herbivore interactions; herbivory; plant; tropical forest.
© 2021 The Authors. Ecology and Evolution published by John Wiley & Sons Ltd.
Conflict of interest statement
None declared.
Figures
References
-
- Aide, T. M. (1993). Patterns of leaf development and herbivory in a tropical understory community. Ecological Society of America, 74(2), 455–466. 10.2307/1939307 - DOI
-
- Aldea, M. , Hamilton, J. G. , Resti, J. P. , Zangerl, A. R. , Berenbaum, M. R. , Frank, T. D. , & DeLucia, E. H. (2006). Comparison of photosynthetic damage from arthropod herbivory and pathogen infection in understory hardwood saplings. Oecologia, 149(2), 221–232. 10.1007/s00442-006-0444-x - DOI - PubMed
-
- Alliende, M. C. (1989). Demographic studies of a dioecious tree. 2. The distribution of leaf predation within and between trees. Journal of Ecology, 77, 1048–1058.
-
- Angulo‐Sandoval, P. , Fernández‐Marín, H. , Zimmerman, J. K. , & Aide, T. M. (2004). Changes in patterns of understory leaf phenology and herbivory following hurricane Damage1. Biotropica, 36(1), 60. 10.1646/03002 - DOI
Associated data
LinkOut - more resources
Full Text Sources
Other Literature Sources
