. 2021 Mar 16;11(9):4470-4480.
doi: 10.1002/ece3.7342. eCollection 2021 May.

Colonization process determines species diversity via competitive quasi-exclusion

Affiliations

Colonization process determines species diversity via competitive quasi-exclusion

Atsushi Yamauchi et al. Ecol Evol. .

Abstract

A colonization model provides a useful basis to investigate a role of interspecific competition in species diversity. The model formulates colonization processes of propagules competing for spatially distinct habitats, which is known to result in stable coexistence of multiple species under various trade-off, for example, competition-colonization and fecundity-mortality trade-offs. Based on this model, we propose a new theory to explain patterns of species abundance, assuming a trade-off between competitive ability and fecundity among species. This model makes testable predictions about species positions in the rank abundance diagram under a discrete species competitiveness. The predictions were tested by three data of animal communities, which supported our model, suggesting the importance of interspecific competition in community structure. Our approach provides a new insight into understanding a mechanism of species diversity.

Keywords: coexistence; community; rank abundance diagram; statistical test; theory.


Conflict of interest statement

We know of no conflicts of interest associated with this publication, and there has been no significant financial support for this work that could have influenced its outcome.

Figures

FIGURE 1
FIGURE 1
Species composition properties under various competition–fecundity trade‐offs (a–c). Solutions of equilibrium frequency with resolutions of (d–f) n = 30 and (g–i) n = 150 within 0 ≤ x ≤ x^ = 2.5, respectively. Lines represent the numerical solutions in discrete competitiveness, and broken curves are the analytical solutions to continuous competitiveness. Panels (d–f) also plot the results of simulations. Panels (j–l) are rank abundance diagrams for discrete competitiveness under various resolutions with ignoring species with frequencies lower than 10−7, where solid and open dots represent peak and nonpeak species, respectively. The peak species is a species that achieves higher frequency than both its neighboring species on the competitiveness axis. Panels (m–o) plot two indexes, the standard deviations (SDs) of pairwise rank distances between species adjoined in competitiveness (upper panel) and the average rank positions of species that survive with similar species (lower panel), which are derived from the relative rank positions to resolution. The triangles indicate the index values of modeled cases, and labels indicate values based on absolute rank positions. Dot plots with error bars represent the means and SDs of the corresponding indexes in 5,000 trials of randomization. + denotes significance (see text). The fractions at the bottom represent the number of species surviving together with neighboring species in competitiveness (numerator) and the numbers of surviving species (denominator)
FIGURE 2
FIGURE 2
Variability of frequency distributions in discrete competitiveness under various combinations of resolution and relative shifts of species competitiveness. The species' positions are determined by [original position] + [relative shift] × [absolute interval between species (x^/n)], where the relative shifts changes from 0 to 1 with 0.001 interval. Panels (a–c) are the results of the trade‐off functions illustrated in Figure 1a–c, respectively. The variability of the frequency distribution is denoted by an average ratio of the difference between the analytical and numerical solutions to the analytical solution in species frequency. This indicates that variability tends to be greater than 20% under the broad conditions
FIGURE 3
FIGURE 3
Two types of SADs that are translated from Figure 1j–k. Panels (a–c) are simple histograms of species frequencies, whereas panels (d–f) are histograms on log2‐scale. Ranges of species frequencies are normalized between 0 (the minimum frequency) and 1 (the maximum frequency), in which species frequencies are categorized into 11 classes with a 0.1 interval
FIGURE 4
FIGURE 4
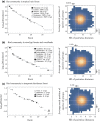
Rank abundance diagrams of three communities that were observed empirically, and the distributions of the average and standard deviation of pairwise distances between species within a group after randomization of species rank. (a) A bat community with 39 species in the tropical region of Los Tuxtlas, Mexico (Estrada & Coates‐Estrada, 2001), (b) a bird community with 41 species in the eucalypt forests of southeastern Australia (Holmes & Recher, 1986), and (c) a bird community with 29 species in a temperate forest of New Hampshire, United States (Holmes et al., 1986). In the left panels, each mark (except for the small light gray dot) represents a species belonging to a group of certain genera and foraging guilds, as described in the legend. In (a), the foraging guilds are categorized as IN: insectivore, FRIN: frugivore complementing diet with insects, FR: frugivore, and INFR: insectivore complementing diet with fruit. Five out six groups include two species, whereas one group (Dermanura: FRIN) involves three species. In (b), the Roman numerals indicate the foraging guilds, which are categorized by foraging method, substrate, and plant species (see Holmes & Recher, 1986), involving eight groups with two species. In (c), the foraging guilds are denoted by locations where the majority of foods are obtained: F: foliage of trees, shrubs, and herbs, G: ground and litter, and B: bark of tree boles and branches. Two out of four groups include three species, whereas the remaining two groups involve two and four species. In (c), a species indicated by the black arrow was excluded from analyses but included in an additional analysis. In those panels, gray dots indicate species without taxonomically or ecologically similar species. The right panels illustrate histograms of combination of two indexes of randomization trials with 100,000 iterations, excluding the species with the black arrow in (c). In those panels, brighter colors indicate a higher frequency, whereas white regions represent absence. The vertical and horizontal dotted lines show index values of the original data. Horizontal dashed lines indicate the mean rank position among all randomization trials, which is a baseline to calculate the conditional probabilities for a difference of average rank position between the original and randomized data. The numbers on the top and right sides of each panel indicate the probability that the randomized data satisfy a relevant condition (see text)

Similar articles

Cited by

References

    1. Brokaw, N. , & Busing, R. T. (2000). Niche versus chance and tree diversity in forest gaps. Trends in Ecology & Evolution, 15, 183–188. 10.1016/S0169-5347(00)01822-X - DOI - PubMed
    1. Calcagno, V. , Mouquet, N. , Jarne, P. , & David, P. (2006). Coexistence in a metacommunity: The competition‐colonization trade‐off is not dead. Ecology Letters, 9, 897–907. 10.1111/j.1461-0248.2006.00930.x - DOI - PubMed
    1. Chesson, P. L. , & Warner, R. R. (1981). Environmental variability promotes coexistence in lottery competitive systems. The American Naturalist, 117, 923–943. 10.1086/283778 - DOI
    1. Cody, M. L. , & Diamond, J. M. (1975). Ecology and evolution of communities. Harvard University Press.
    1. Collins, C. D. , Holt, R. D. , & Foster, B. L. (2009). Patch size effects on plant species decline in an experimentally fragmented landscape. Ecology, 90, 2577–2588. 10.1890/08-1405.1 - DOI - PubMed