

Prediction and analysis of novel key genes ITGAX, LAPTM5, SERPINE1 in clear cell renal cell carcinoma through bioinformatics analysis
- PMID: 33976979
- PMCID: PMC8063882
- DOI: 10.7717/peerj.11272
Prediction and analysis of novel key genes ITGAX, LAPTM5, SERPINE1 in clear cell renal cell carcinoma through bioinformatics analysis
Abstract
Background: Clear Cell Renal Cell Carcinoma (CCRCC) is the most aggressive subtype of Renal Cell Carcinoma (RCC) with high metastasis and recurrence rates. This study aims to find new potential key genes of CCRCC.
Methods: Four gene expression profiles (GSE12606, GSE53000, GSE68417, and GSE66272) were downloaded from the Gene Expression Omnibus (GEO) database. The TCGA KIRC data was downloaded from The Cancer Genome Atlas (TCGA). Using GEO2R, the differentially expressed genes (DEG) in CCRCC tissues and normal samples were analyzed. Gene ontology (GO) and Kyoto Encyclopedia of Genes and Genomes (KEGG) enrichment analyses were performed in DAVID database. A protein-protein interaction (PPI) network was constructed and the hub gene was predicted by STRING and Cytoscape. GEPIA and Kaplan-Meier plotter databases were used for further screening of Key genes. Expression verification and survival analysis of key genes were performed using TCGA database, GEPIA database, and Kaplan-Meier plotter. Receiver operating characteristic (ROC) curve was used to analyze the diagnostic value of key genes in CCRCC, which is plotted by R software based on TCGA database. UALCAN database was used to analyze the relationship between key genes and clinical pathology in CCRCC and the methylation level of the promoter of key genes in CCRCC.
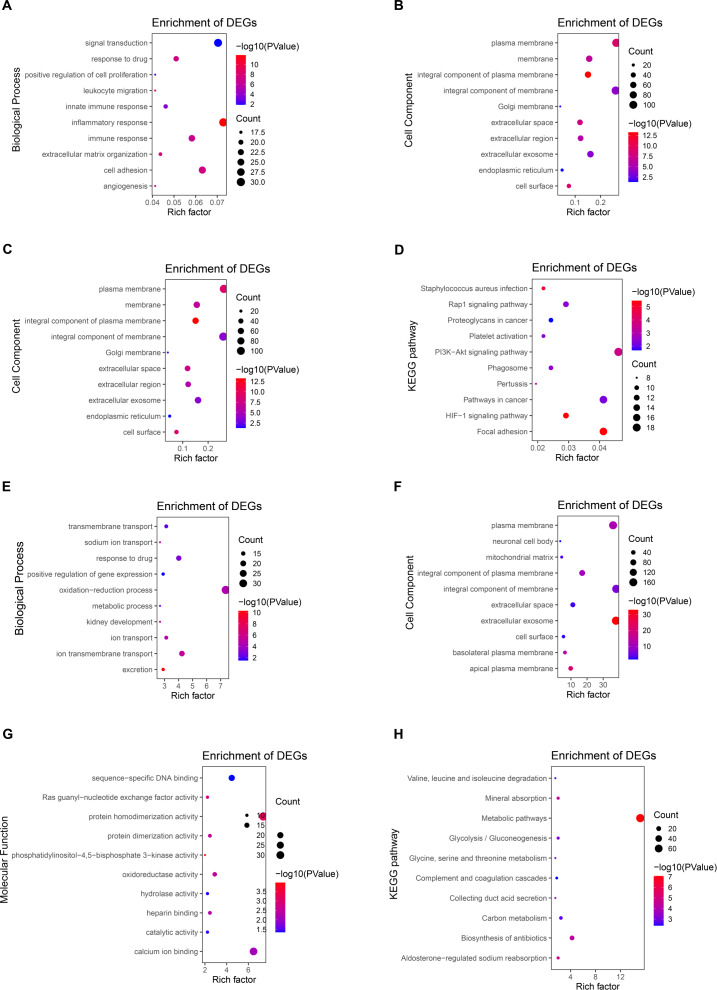
Results: A total of 289 up-regulated and 449 down-regulated genes were identified based on GSE12606, GSE53000, GSE68417, and GSE66272 profiles in CCRCC. The upregulated DEGs were mainly enriched with protein binding and PI3K-Akt signaling pathway, whereas down-regulated genes were enriched with the integral component of the membrane and metabolic pathways. Next, the top 35 genes were screened out from the PPI network according to Degree, and three new key genes ITGAX, LAPTM5 and SERPINE1 were further screened out through survival and prognosis analysis. Further results showed that the ITGAX, LAPTM5, and SERPINE1 levels in CCRCC tumor tissues were significantly higher than those in normal tissues and were associated with poor prognosis. ROC curve shows that ITGAX, LAPTM5, and SERPINE1 have good diagnostic value with good specificity and sensitivity. The promoter methylation levels of ITGAX, LAPTM5 and SERPINE1 in CCRCC tumor tissues were significantly lower than those in normal tissues. We also found that key genes were associated with clinical pathology in CCRCC.
Conclusion: ITGAX, LAPTM5, and SERPINE1 were identified as novel key candidate genes that could be used as prognostic biomarkers and potential therapeutic targets for CCRCC.
Keywords: Bioinformatical analysis; CCRCC; Differentially expressed genes; Protein-protein interaction.
©2021 Sui et al.
Conflict of interest statement
The authors declare there are no competing interests.
Figures


Similar articles
-
Bioinformatics analysis and verification of gene targets for renal clear cell carcinoma.Comput Biol Chem. 2021 Jun;92:107453. doi: 10.1016/j.compbiolchem.2021.107453. Epub 2021 Feb 9. Comput Biol Chem. 2021. PMID: 33636636
-
Identification of Prognostic Related Hub Genes in Clear-Cell Renal Cell Carcinoma via Bioinformatical Analysis.Chin Med Sci J. 2021 Jun 30;36(2):127-134. doi: 10.24920/003651. Chin Med Sci J. 2021. PMID: 34231461
-
Identification of CXCL10 as a Prognostic Biomarker for Clear Cell Renal Cell Carcinoma.Front Oncol. 2022 Feb 28;12:857619. doi: 10.3389/fonc.2022.857619. eCollection 2022. Front Oncol. 2022. PMID: 35296026 Free PMC article.
-
Systematic Analysis of microRNA Biomarkers for Diagnosis, Prognosis, and Therapy in Patients With Clear Cell Renal Cell Carcinoma.Front Oncol. 2020 Dec 4;10:543817. doi: 10.3389/fonc.2020.543817. eCollection 2020. Front Oncol. 2020. PMID: 33344224 Free PMC article.
-
The Partial Role of KLF4 and KLF5 in Gastrointestinal Tumors.Gastroenterol Res Pract. 2021 Jul 27;2021:2425356. doi: 10.1155/2021/2425356. eCollection 2021. Gastroenterol Res Pract. 2021. PMID: 34367275 Free PMC article. Review.
Cited by
-
Lysosomal-Associated Transmembrane Protein 5 Promotes Proliferation, Migration, and Invasion of Clear Cell Renal Cell Carcinoma.J Oncol. 2022 Nov 2;2022:6334546. doi: 10.1155/2022/6334546. eCollection 2022. J Oncol. 2022. PMID: 36385959 Free PMC article.
-
ZKSCAN5 activates LAPTM5 expression by recruiting SETD7 to promote metastasis in pancreatic ductal adenocarcinoma.Histol Histopathol. 2024 Jun;39(6):747-760. doi: 10.14670/HH-18-678. Epub 2023 Nov 22. Histol Histopathol. 2024. PMID: 38018874
-
Expression of basement membrane genes and their prognostic significance in clear cell renal cell carcinoma patients.Front Oncol. 2022 Oct 24;12:1026331. doi: 10.3389/fonc.2022.1026331. eCollection 2022. Front Oncol. 2022. PMID: 36353536 Free PMC article.
-
Network pharmacology-based analysis of Resinacein S against non-alcoholic fatty liver disease by modulating lipid metabolism.Front Nutr. 2023 Feb 14;10:1076569. doi: 10.3389/fnut.2023.1076569. eCollection 2023. Front Nutr. 2023. PMID: 36866057 Free PMC article.
-
Key Prognostic Value of Lysosomal Protein Transmembrane 5 in Kidney Renal Clear Cell Carcinoma.Int J Gen Med. 2022 Mar 5;15:2515-2527. doi: 10.2147/IJGM.S357013. eCollection 2022. Int J Gen Med. 2022. PMID: 35557976 Free PMC article.
References
-
- Barrett T, Wilhite SE, Ledoux P, Evangelista C, Kim IF, Tomashevsky M, Marshall KA, Phillippy KH, Sherman PM, Holko M, Yefanov A, Lee H, Zhang N, Robertson CL, Serova N, Davis S, Soboleva A. NCBI GEO: archive for functional genomics data sets–update. Nucleic Acids Research. 2013;41:D991–D995. - PMC - PubMed
-
- Bex A, Mulders P, Jewett M, Wagstaff J, van Thienen JV, Blank CU, van Velthoven R, Del Pilar Laguna M, Wood L, van Melick HHE, Aarts MJ, Lattouf JB, Powles T, de Jong Md Ph DI, Rottey S, Tombal B, Marreaud S, Collette S, Collette L, Haanen J. Comparison of immediate vs deferred cytoreductive nephrectomy in patients with synchronous metastatic renal cell carcinoma receiving sunitinib: The SURTIME randomized clinical trial. JAMA Oncology. 2019;5:164–170. doi: 10.1001/jamaoncol.2018.5543. - DOI - PMC - PubMed
-
- Cai X, Qiao Y, Chen Y, Du S, Chen D, Yu S, Liu N, Jiang Y. Expression and Polymorphisms of Lysosome-Associated Protein Transmembrane 5 (LAPTM5) in patients with systemic lupus erythematosus in a chinese population. Biochemical Genetics. 2015;53:200–210. doi: 10.1007/s10528-015-9682-0. - DOI - PubMed
LinkOut - more resources
Full Text Sources
Other Literature Sources
Research Materials
Miscellaneous
