. 2021 Mar 8;8(9):2003630.
doi: 10.1002/advs.202003630. eCollection 2021 May.

A High-Affinity Calmodulin-Binding Site in the CyaA Toxin Translocation Domain is Essential for Invasion of Eukaryotic Cells

Affiliations

A High-Affinity Calmodulin-Binding Site in the CyaA Toxin Translocation Domain is Essential for Invasion of Eukaryotic Cells

Alexis Voegele et al. Adv Sci (Weinh). .

Abstract

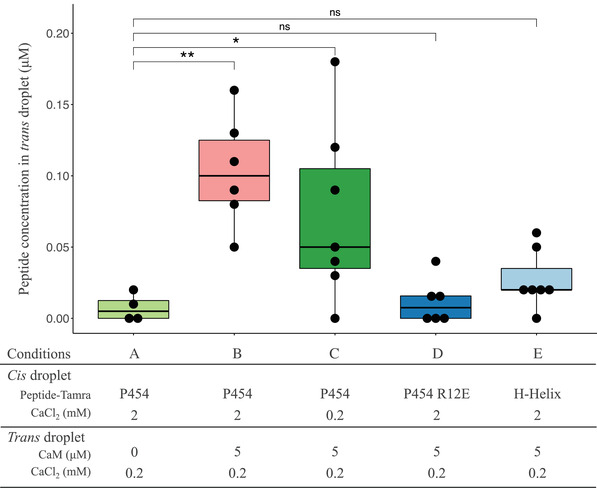
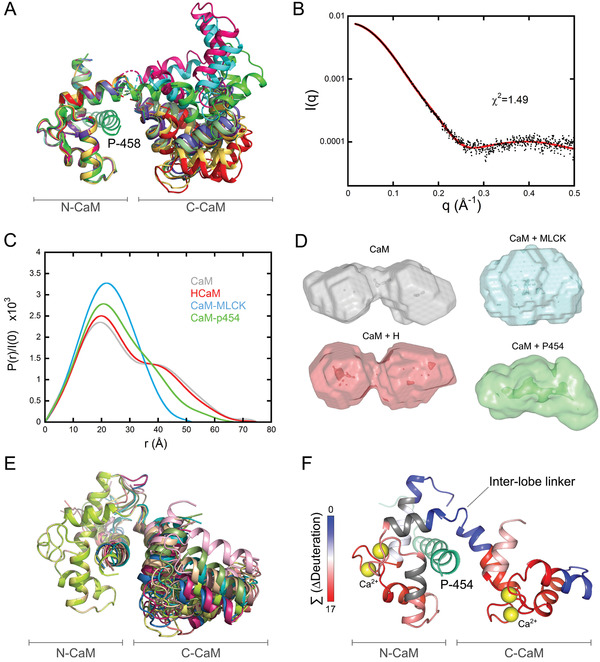
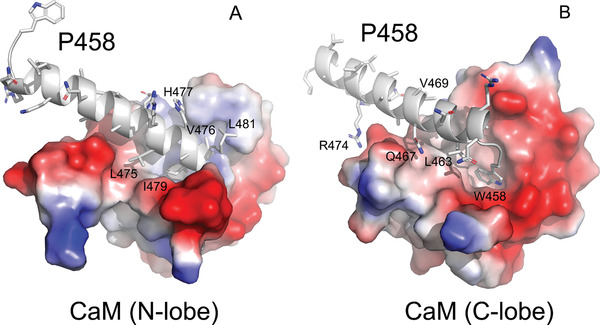
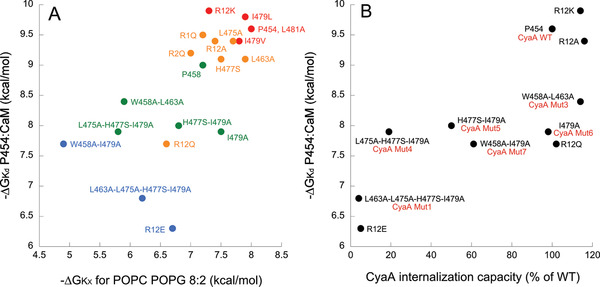
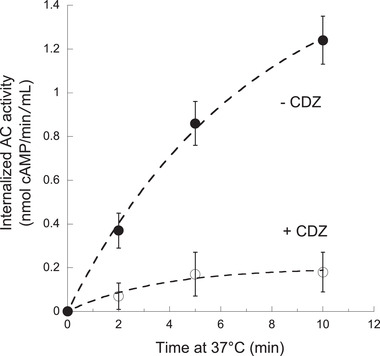
The molecular mechanisms and forces involved in the translocation of bacterial toxins into host cells are still a matter of intense research. The adenylate cyclase (CyaA) toxin from Bordetella pertussis displays a unique intoxication pathway in which its catalytic domain is directly translocated across target cell membranes. The CyaA translocation region contains a segment, P454 (residues 454-484), which exhibits membrane-active properties related to antimicrobial peptides. Herein, the results show that this peptide is able to translocate across membranes and to interact with calmodulin (CaM). Structural and biophysical analyses reveal the key residues of P454 involved in membrane destabilization and calmodulin binding. Mutational analysis demonstrates that these residues play a crucial role in CyaA translocation into target cells. In addition, calmidazolium, a calmodulin inhibitor, efficiently blocks CyaA internalization. It is proposed that after CyaA binding to target cells, the P454 segment destabilizes the plasma membrane, translocates across the lipid bilayer and binds calmodulin. Trapping of CyaA by the CaM:P454 interaction in the cytosol may assist the entry of the N-terminal catalytic domain by converting the stochastic motion of the polypeptide chain through the membrane into an efficient vectorial chain translocation into host cells.

Keywords: Bordetella pertussis; CyaA toxin; adenylate cyclase; calmodulin; membrane translocation; protein membrane interaction; protein–protein interactions.


Conflict of interest statement

The authors declare no conflict of interest.

Figures

Figure 1
Figure 1
Peptide translocation across droplet interface bilayers. Boxplot representation of the TAMRA‐peptide concentration (µm) in the trans droplet 15 min after the formation of the droplet interface bilayers (see Experimental Section for details). TAMRA fluorescence was measured in the A) absence and in the B–E) presence of 5 μ m CaM in the trans droplet; C) in the absence and in (A–B,D–E) the presence of a calcium gradient across the lipid bilayer (CaCl2: 2 mm cis versus 0.2 mm trans). Concentration of A–C) TAMRA‐P454 WT, D) TAMRA‐P454 R12E, and the E) TAMRA‐H‐helix peptides in the trans droplets are reported. Four to seven independent trials were conducted for each condition. Mann–Whitney–Wilcoxon test was applied to compare the experiments (ns: p > 0.05, *: p < 0.05, and **: p < 0.01).
Figure 2
Figure 2
Structure and dynamics of the P454:CaM complex. A) The twelve P458:CaM crystal structures (PDB 6YNS) are displayed after superimposition of Cαs over the range 10 to 70 included, corresponding to the N‐ter lobe of calmodulin. The crystal structure 1CLL[ 92 ] of the extended conformation of CaM is shown in light green. B) Experimental SAXS curve of the P454:CaM complex (black dots) superimposed over the best fit (red curve) obtained from the structural model shown in Figure 2F. C) Comparison of the four distance distribution functions obtained using the program GNOM for CaM alone (grey), H:CaM (red), MLCK:CaM (cyan), and P454:CaM (green) complexes. D) DAMMIN models of CaM alone, H:CaM, MLCK:CaM, and P454:CaM complexes, shown with the same color code. E) Ten models fitting the SAXS curve shown on Figure 2B obtained using the program DADIMODO[ 68 ] are displayed after superimposition of Cαs over the range 10 to 70. F) Effects of P454 on the HDX behavior of CaM. The uptake differences (∆Deuteration) measured between the free‐ and P454‐bound CaM were extracted for each peptide at each time point, summed, and plotted on the best‐fitting structural model of P454:CaM (red curve in 2B). The summed ∆Deuteration values [Σ (∆Deuteration)] are colored from blue (no variation of deuterium uptake) to red (major reductions of deuterium uptake). Uncovered regions are in grey.
Figure 3
Figure 3
P458:CaM interactions. Close views of the molecular contacts between P458 and the panel A) N and panel B) C lobes of CaM (pdb 6YNU). The peptide is shown in cartoon representation and colored in grey. Side chains of key residues interacting with CaM are shown as sticks. These residues establish numerous non‐polar interactions, as well as several hydrogen bonds with CaM residues. These contacts are summarized in Table S5B,C, Supporting Information.The CaM lobes are represented by their electrostatic surfaces (negative and positive charges are colored in red and blue, respectively).
Figure 4
Figure 4
Correlations between in vitro properties of P454‐derived peptides and the internalization activity of the CyaA recombinant proteins. A) The free energy values of peptide:CaM complex formation (∆G Kd) are plotted as a function of free energy values for peptide solution‐to‐membrane partitioning (∆G Kx, see Table S3, Supporting Information) and permeabilization efficiency (Cp1/2 values, see Table S9, Supporting Information). The color code refers to the Cp1/2 values ranging from red‐to‐blue (high‐to‐low permeabilization efficiency, respectively) using a logarithmic scale (red: Cp1/2 < 100 nM, orange: 0.1 < Cp1/2 < 1 µm, green: 1 < Cp1/2<10 µm, and blue: 10 < Cp1/2 < 100 µm. B) The free energy values of peptide:CaM complex formation (∆G Kd) as a function of relative internalization activity of the CyaA variants (data from Table 1). The peptide names are in black and the names of the recombinant CyaA proteins are in red, if different from the peptide name. Each dot reported on plots corresponds to the average value of at least three independent replicates (see Table 1; Tables S3 and S9, Supporting Information). The r2 values for the data of panels (A) and (B) are 0.54 and 0.62, respectively.
Figure 5
Figure 5
Calmidazolium (CDZ) inhibits CyaA translocation into erythrocytes. Erythrocytes were first incubated with CyaA (5.6 nm) at 4 °C in the presence of CaCl2 for 30 min so that the toxin could bind to cells but not translocate across plasma membrane (see main text). After removal of unbound toxin, 10 μ m CDZ were added (open symbols) or not (CyaA, filled symbols) and the cell mixtures were transferred to 37 °C. At the indicated time, the cell suspensions were treated with trypsin for 10 min and after addition of soybean trypsin inhibitor, cells were washed and lysed with 0.1% Tween 20 and the internalized AC activity (i.e., enzyme activity protected from trypsin digestion) was measured as described in Experimental Section. Each dot corresponds to the average value of three independent replicates.

References

    1. Guiso N., Toxins 2017, 9, 277. - PMC - PubMed
    1. Novak J., Cerny O., Osickova A., Linhartova I., Masin J., Bumba L., Sebo P., Osicka R., Toxins 2017, 9, 300. - PMC - PubMed
    1. Coote J. G., FEMS Microbiol. Rev. 1992, 8, 137. - PubMed
    1. Linhartova I., Bumba L., Masin J., Basler M., Osicka R., Kamanova J., Prochazkova K., Adkins I., Hejnova‐Holubova J., Sadilkova L., Morova J., Sebo P., FEMS Microbiol. Rev. 2010, 34, 1076. - PMC - PubMed
    1. Chenal A., Sotomayor Perez A. C., Ladant D., in The Comprehensive Sourcebook of Bacterial Protein Toxins, 4th ed. (Eds: Alouf J., Ladant D., Popoff M. R.), Elsevier, Amsterdam, Netherlands: 2015.

Publication types

MeSH terms

LinkOut - more resources