Review
. 2021 Mar 3;8(9):2004525.
doi: 10.1002/advs.202004525. eCollection 2021 May.

Eco-Friendly Nanoplatforms for Crop Quality Control, Protection, and Nutrition

Affiliations
Review

Eco-Friendly Nanoplatforms for Crop Quality Control, Protection, and Nutrition

Chao-Yi Wang et al. Adv Sci (Weinh). .

Abstract

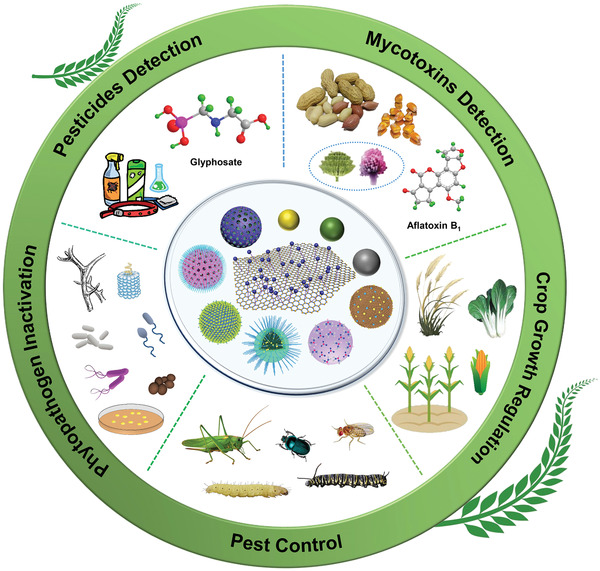
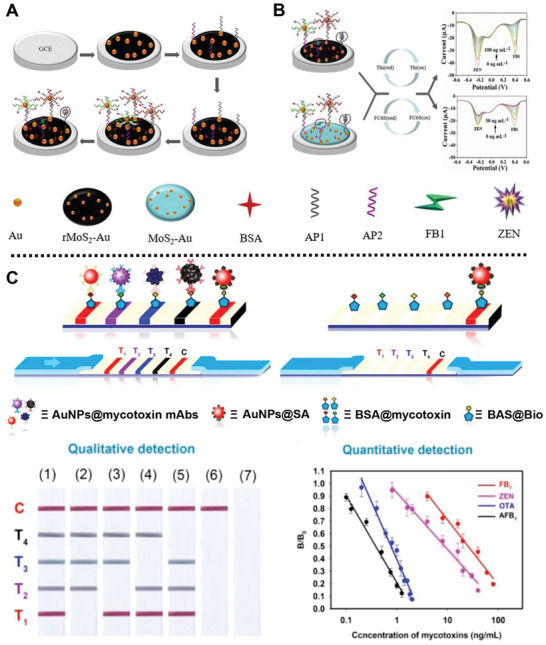
Agricultural chemicals have been widely utilized to manage pests, weeds, and plant pathogens for maximizing crop yields. However, the excessive use of these organic substances to compensate their instability in the environment has caused severe environmental consequences, threatened human health, and consumed enormous economic costs. In order to improve the utilization efficiency of these agricultural chemicals, one strategy that attracted researchers is to design novel eco-friendly nanoplatforms. To date, numerous advanced nanoplatforms with functional components have been applied in the agricultural field, such as silica-based materials for pesticides delivery, metal/metal oxide nanoparticles for pesticides/mycotoxins detection, and carbon nanoparticles for fertilizers delivery. In this review, the synthesis, applications, and mechanisms of recent eco-friendly nanoplatforms in the agricultural field, including pesticides and mycotoxins on-site detection, phytopathogen inactivation, pest control, and crops growth regulation for guaranteeing food security, enhancing the utilization efficiency of agricultural chemicals and increasing crop yields are highlighted. The review also stimulates new thinking for improving the existing agricultural technologies, protecting crops from biotic and abiotic stress, alleviating the global food crisis, and ensuring food security. In addition, the challenges to overcome the constrained applications of functional nanoplatforms in the agricultural field are also discussed.

Keywords: crop growth regulation; nanomaterials; pest control; pesticides detection; phytopathogen inactivation.


Conflict of interest statement

The authors declare no conflict of interest.

Figures

Figure 1
Figure 1
Schematic representation of some advanced nanoplatforms with specific properties for agricultural applications, including on‐site pesticides and mycotoxins detection, phytopathogen inactivation, pest control, and crops growth regulation.
Figure 2
Figure 2
A) Schematic diagram of the preparation of SERS tape and its application of sensing pyridine and sulfur pesticides from apple peel by SERS analysis. B) Raman spectra of parathion‐methyl peeled from the surfaces of different fruits and vegetables using SERS tape. Reproduced with permission.[ 47 ] Copyright 2016, American Chemical Society. C) Schematic description of the preparation of SERS swabs and its application for the detection of pesticides residues in garden stuff. Reproduced with permission.[ 49 ] Copyright 2018, Royal Society of Chemistry. D) Schematic representation for the fabrication process of the lab‐on‐paper SERS platform and the SERS on‐site detection of thiram in the soil. E) Raman spectra of thiram at different concentrations in the soil using SERS platform on paper. Reproduced with permission.[ 50 ] Copyright 2019, Wiley‐VCH Verlag GmbH & Co. KGaA, Weinheim.
Figure 3
Figure 3
A) Schematic illustration of rapid SERS on‐site detection of pesticides residue from apple. B,C) Schematic description of the SERS on‐site detection of thiram and TBZ on cabbage surface, respectively. Reproduced with permission.[ 51 ] Copyright 2019, Elsevier. D) Schematic representation for the preparation process of a AuNPs/PVC film. Reproduced with permission.[ 53 ] Copyright 2010, Royal Society of Chemistry.
Figure 4
Figure 4
A) Schematic illustration of the urease‐induced AuNFs pELISA for on‐site detection of OTA cereal samples. Reproduced with permission.[ 66 ] Copyright 2018, Elsevier. B) Schematic diagram of the preparation of AuE‐dc‐pELISA for the detection of AFB1 in corn samples. Reproduced with permission.[ 67 ] Copyright 2018, Elsevier.
Figure 5
Figure 5
A) Schematic description of the fabrication process of the electrochemical sensor for screening ZEN and FB1, and B) the detection mechanism of the prepared platform. Reproduced with permission.[ 28 ] Copyright 2020, Elsevier. C) Schematic representation for colored AuNP‐based incorporation ICTS probes with four T lines for the detection of FB1, ZEN, OTA, and AFB1, and the T/C value curves of the AuNP‐based probes for quantitative test of the four mycotoxins. Reproduced with permission.[ 68 ] Copyright 2020, Elsevier.
Figure 6
Figure 6
A) Schematic description of the toxicity mechanism of the preparation of MgONPs in response to phytopathogenic R. solanacearum. Reproduced with permission.[ 76 ] Copyright 2018, Frontiers Media S.A. B) Schematic summarization of the interactions between the MgONPs and fungal pathogen conidia and mycelia. Reproduced with permission.[ 77 ] Copyright 2018, Frontiers Media S.A.
Figure 7
Figure 7
A) Schematic diagram of the fabrication process of the Py@MSNs‐HTCC platform. B) Release profiles of Py from Py@MSNs‐HTCC, Py@MSNs, and pyraclostrobin technical, respectively. Reproduced with permission.[ 79 ] Copyright 2016, MDPI. C) Schematic description of the preparation process of the AZOX@MSN‐CMCS platform. Release profiles of AZOX from D) AZOX@MSN‐CMCS and E) AZOX@MSN at different pH values. Reproduced with permission.[ 80 ] Copyright 2018, Elsevier.
Figure 8
Figure 8
A) Schematic summarization for the process of NPs in response to TMV in tobacco plants. B) Mechanisms of antiviral activity of ZnONPs in N. benthamiana plants. Accumulation and distribution of C) Si4+ and D) Zn2+ in the different parts of plants treated with 100 µg mL−1 SiO2NPs and ZnONPs. Reproduced with permission.[ 83 ] Copyright 2019, Royal Society of Chemistry.
Figure 9
Figure 9
A) Schematic illustration for the preparation process of the bioresponsive PRO‐MON‐CaC platform and its release mechanism in response to S. sclerotiorum. B) Ptotostability of PRO‐MON‐CaC, PRO EW, and PRO under UV light. Reproduced with permission.[ 85 ] Copyright 2020, American Chemical Society. C) Schematic diagram of the fabrication process of GO‐AgNPs composite and its antifungal activity in vitro and in vivo. D) The germination rates of spores treated with GO, AgNPs, and GOAgNPs nanocomposite. Reproduced with permission.[ 86 ] Copyright 2016, American Chemical Society.
Figure 10
Figure 10
A) Schematic illustration of the fabrication process of CLAP‐CRFs. B) The cumulative release performance of CLAP from CLAP‐CRFs platform at different pH values. C) Schematic description and D) the curve of CLAP release from the CLAP‐CRF triggered by α‐amylase. Reproduced with permission.[ 94 ] Copyright 2017, American Chemical Society. E) Schematic description of the preparation process of AVM/MSN‐PDA‐M+. F) Photostability of AVM, AVM/MSN, AVM/MSN‐PDA, and AVM/MSN‐PDA‐M+ under UV light for 25 h. Reproduced with permission.[ 95 ] Copyright 2019, Elsevier.
Figure 11
Figure 11
A) Scheme summarization for the preparation process and the insecticidal mechanism of AVM loaded HMS@P(GMA‐AA). B) The cumulative release curve of AVM from the AVM loaded HMS@P(GMA‐AA) platform at different pH values. Reproduced with permission.[ 96 ] Copyright 2019, Elsevier. C) Schematic diagram of the release mechanism of the thermo‐responsive THI@HMS@P(NIPAM‐MAA) platform. D) The synthesis process of HMS@P(NIPAM‐MAA) system. E) The cumulative release curve of THI from the THI@HMS@P(NIPAM‐MAA) at different temperatures for 14 d. F) The mortality of N. lugens treated with THI@HMS@P(GMA‐AA) and Actara for 14 d, respectively. Reproduced with permission.[ 97 ] Copyright 2020, Elsevier.
Figure 12
Figure 12
A) Scheme summarization of the synthesis process of anion‐responsive Se fertilizer CRS. B) The release behavior of the Se fertilizer CRS in response to anion in the soil. C) Schematic illustration of the release behavior of PHMCN‐Se in response to anion in leaching experiment. D) The amount of Se release from the Se fertilizer CRS in the soil under different concentration and valence of anion. Reproduced with permission.[ 103 ] Copyright 2018, Elsevier. E) Schematic description of the fabrication process of the GA3‐HMSN/Fe3O4 platform and its application in response to multi‐stimuli for the regulation of plant growth. F) The cumulative release curve of RhB from RhB‐HMSN/Fe3O4 at different pH values. Reproduced with permission.[ 16 ] Copyright 2019, Royal Society of Chemistry.

References

    1. Enserink M., Hines P. J., Vignieri S. N., Wigginton N. S., Yeston J. S., Science 2013, 341, 728. - PubMed
    1. a) Liang Y., Guo M., Fan C., Dong H., Ding G., Zhang W., Tang G., Yang J., Kong D., Cao Y., ACS Sustainable Chem. Eng. 2017, 5, 4802;
    2. b) Mogul M. G., Akin H., Hasirci N., Trantolo D. J., Gresser J. D., Wise D. L., Resour., Conserv. Recycl. 1996, 16, 289.
    1. Al‐Taher F., Banaszewski K., Jackson L., Zweigenbaum J., Ryu D., Cappozzo J., J. Agric. Food Chem. 2013, 61, 2378. - PubMed
    1. Hu Z., Lustig W. P., Zhang J., Zheng C., Wang H., Teat S. J., Gong Q., Rudd N. D., Li J., J. Am. Chem. Soc. 2015, 137, 16209. - PubMed
    1. Flood J., Food Sec. 2010, 2, 215.

Publication types

LinkOut - more resources