. 2021 Mar 1;8(9):2004793.
doi: 10.1002/advs.202004793. eCollection 2021 May.

DNA-Grafted Hyaluronic Acid System with Enhanced Injectability and Biostability for Photo-Controlled Osteoarthritis Gene Therapy

Affiliations

DNA-Grafted Hyaluronic Acid System with Enhanced Injectability and Biostability for Photo-Controlled Osteoarthritis Gene Therapy

Zhijie Chen et al. Adv Sci (Weinh). .

Abstract

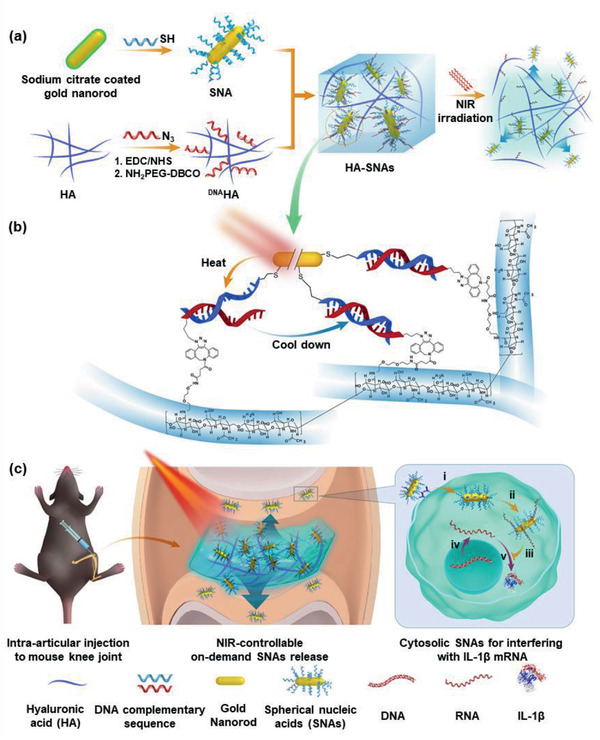
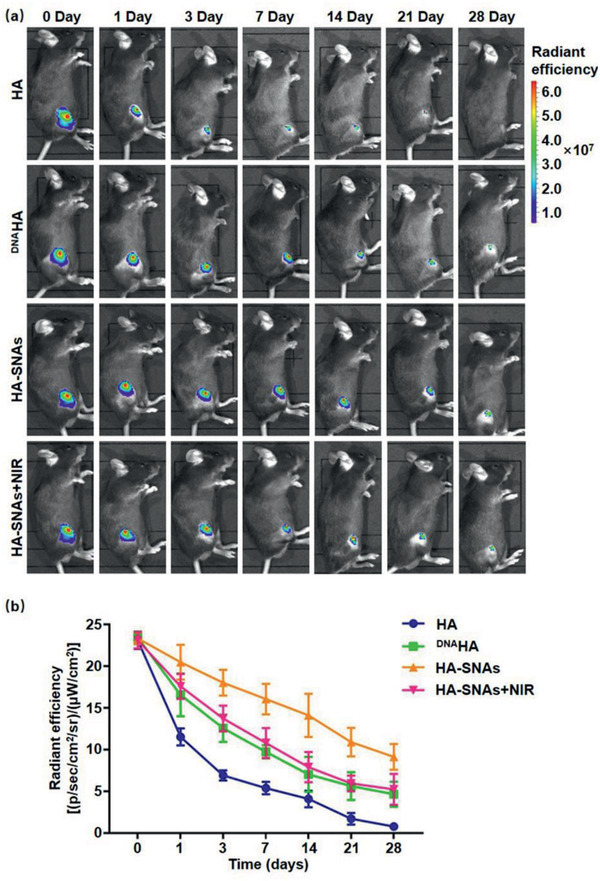
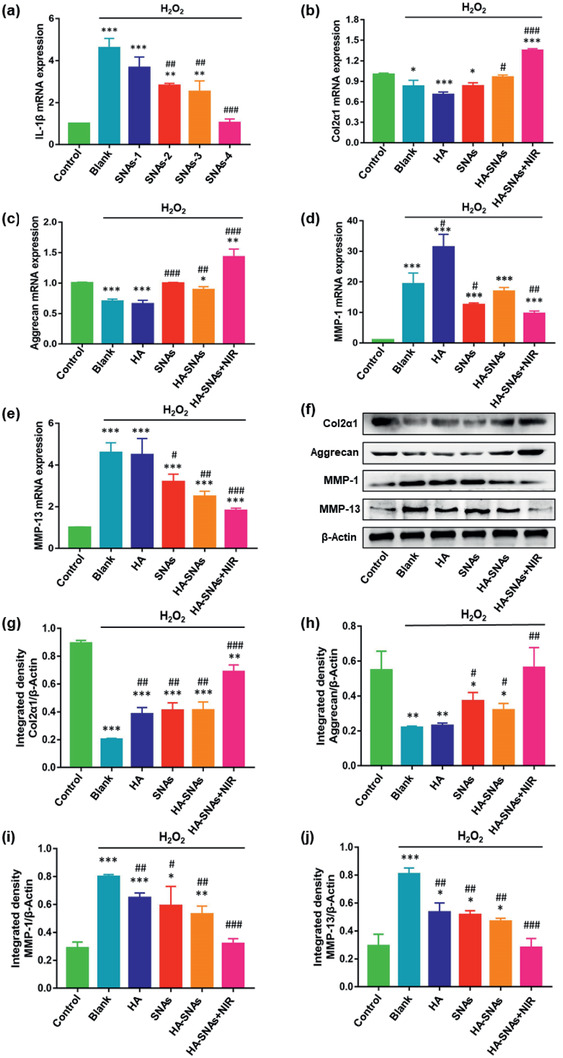
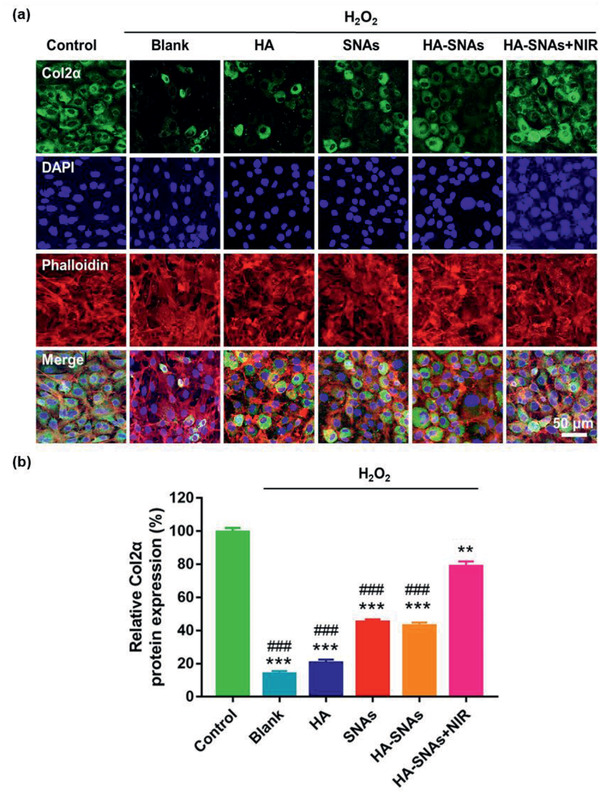
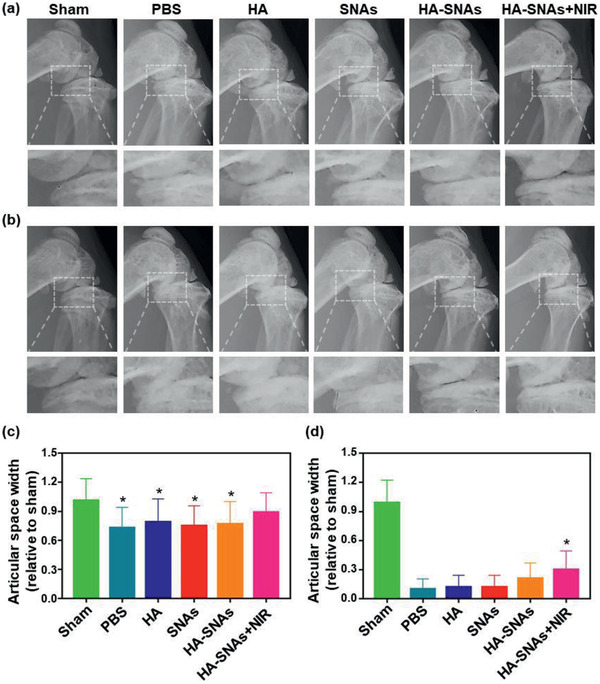
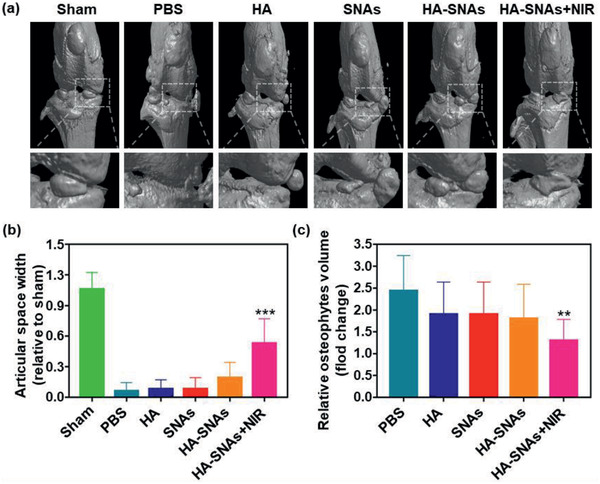
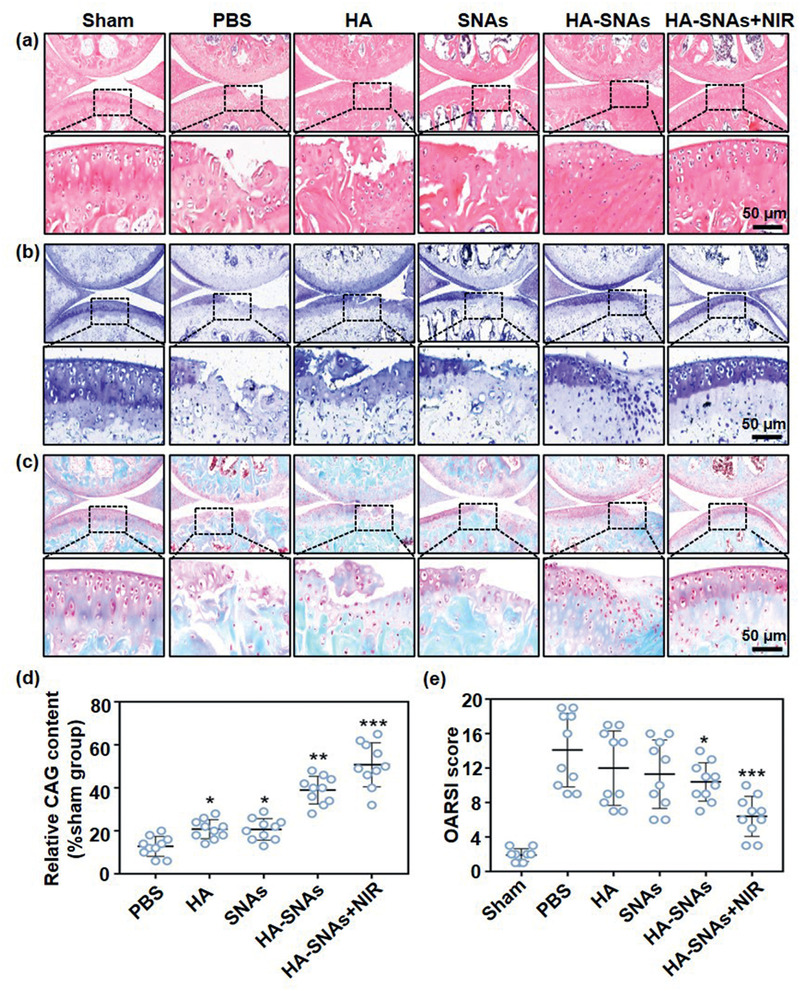
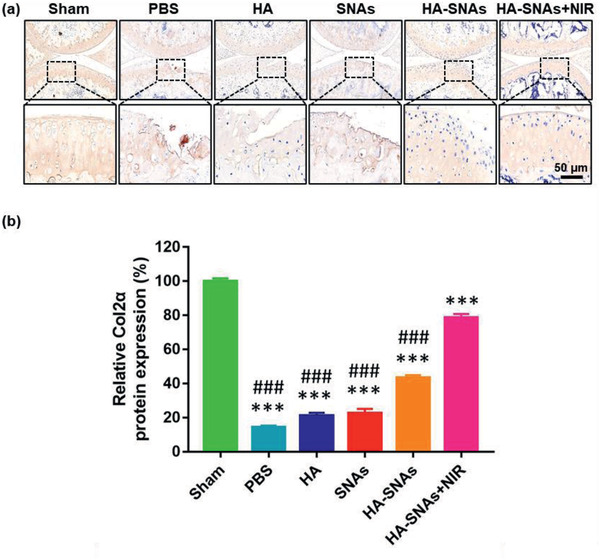
Gene therapy is identified as a powerful strategy to overcome the limitations of traditional therapeutics to achieve satisfactory effects. However, various challenges related to the dosage form, delivery method, and, especially, application value, hampered the clinical transition of gene therapy. Here, aiming to regulate the cartilage inflammation and degeneration related abnormal IL-1β mRNA expression in osteoarthritis (OA), the interference oligonucleotides is integrated with the Au nanorods to fabricate the spherical nucleic acids (SNAs), to promote the stability and cell internalization efficiency. Furthermore, the complementary oligonucleotides are grafted onto hyaluronic acid (HA) to obtained DNA-grafted HA (DNAHA) for SNAs delivery by base pairing, resulting in significantly improved injectability and bio-stability of the system. After loading SNAs, the constructed DNAHA-SNAs system (HA-SNAs) performs a reversible NIR-triggered on-demand release of SNAs by photo-thermal induced DNA dehybridization and followed by post-NIR in situ hybridization. The in vitro and in vivo experiments showed that this system down-regulated catabolic proteases and up-regulated anabolic components in cartilage over extended periods of time, to safeguard the chondrocytes against degenerative changes and impede the continual advancement of OA.

Keywords: DNA grafted hyaluronic acid; anti‐inflammation; enhanced injectability; long‐term bio‐stability; osteoarthritis gene therapy; spherical nucleic acids.


Conflict of interest statement

The authors declare no conflict of interest.

Figures

Scheme 1
Scheme 1
NIR light‐controllable SNAs release based on DNA‐grafted HA for OA treatment. a) Synthesis of HA‐SNAs multi‐functional delivery system via DNA hybridization and its unspooling to release SNAs by virtue of photothermal response. b) Chemical modification and base pairing design of DNAHA and SNAs aimed at IL‐1β. c) HA‐SNAs system is injected into the knee joint and irradiated by NIR light to gradually release the SNAs, which enter into cells to interfere with mRNA molecules to silence IL‐1β expression. c(i)) Cell internalization; c(ii)) SNAs capturing the targeted mRNA; c(iii)) Inhibiting the process of translation; c(iv)) Transcription from DNA to mRNA; and c(v)) Translation from mRNA to IL‐1b protein.
Figure 1
Figure 1
Characterization of the HA‐SNAs system. a) Size and b) zeta(ζ)‐potential changes of the nanosystem during the preparation. c) FTIR spectra of the HA, sense DNA, and DNAHA. d) SEM images of HA‐SNAs at different magnification and the TEM images of (d(iv)) Au NPs, d(v)) SNAs, and d(vi)) HA‐SNAs. f) Photothermal images of SNAs, HA+SNAs, HA‐SNAs irradiated at 808 nm (1.5 W cm−2) for 14 min, respectively. g) Temperature profiles of SNAs, HA+SNAs, HA‐SNAs irradiated at 808 nm (1.5 W cm−2) for 14 min, respectively. h) Temperature profiles of HA‐SNAs irradiated at 808 nm for 14 min with power densities of 1.0 and 1.5 W cm−2, respectively.
Figure 2
Figure 2
Cytotoxicity of the nanosystem in vitro. a) Live/Dead staining of chondrocytes co‐cultured with HA, SNAs, HA‐SNAs, HA‐SNAs+NIR detected employing fluorescence microscopy. b) The live cell count summarized from the Live/Dead assay. c) Cytotoxicity of HA, SNAs, HA‐SNAs, and HA‐SNAs+NIR on chondrocytes examined with CCK‐8. n = 3; NS = no significance; ***p < 0.001.
Figure 3
Figure 3
Cellular uptake. a) Representative photomicrographs of chondrocytes acquired using CLSM treated with HA, DNAHA, SNAs, HA‐SNAs, HA‐SNAs+NIR for 12 h. Red: ICG labeling HA; Green: FITC labeling SNAs; blue: DAPI labeling cell nuclei; gray: Phalloidin labeling cell actin. b) Flow cytometry analysis of cellular uptake after incubating SNAs, HA‐SNAs, HA‐SNAs+NIR for 12 h with chondrocytes where SNAs are labeled with FITC with the corresponding cellular uptake quantification. n = 3; *p < 0.05, **p < 0.01, compared with HA‐SNAs; # p < 0.05, compared with HA‐SNAs+NIR 1. c) Flow cytometry analysis of cellular uptake after incubating HA, DNAHA, HA‐SNAs, HA‐SNAs+NIR with chondrocytes where HA are labeled with ICG. Correspondingly, the cellular uptake is quantified. n = 3; *p < 0.05, **p < 0.01, compared with DNAHA; # p < 0.05, compared with HA‐SNAs. The power density of NIR light is 1 W cm−2.
Figure 4
Figure 4
Joint residence of the injected nanosystem. (–a) Representative IVIS images of mice knee joints over 28 days after injection of fluorescent HA, DNAHA, HA‐SNAs and HA‐SNAs+NIR. Fluorescence scale: max = 7.0 × 10⁷, min = 1.0 × 10⁷. b) Time course of fluorescent radiant efficiency within joints corresponding to a). n = 3. Half‐lives are statistically different for each dataset (p < 0.05).
Figure 5
Figure 5
Mechanism for chondrocytes degradation protection of the nanosystem. a) The qRT‐PCR analysis exhibiting the mRNA expression of IL‐1β in chondrocytes treated with 10 mU of H2O2 at different concentrations of SNAs (0, 5, 10, 20, and 50 µg mL−1). n = 3, **p < 0.01, ***p < 0.001, compared with control; ## p < 0.01, ### p < 0.001, compared with blank group. qRT‐PCR analysis and quantitation of b) Col2α, c) aggrecan, d) MMP‐1, and e) MMP‐13 expression in chondrocytes treated with 10 mU of H2O2, and cocultured with HA, SNAs, HA‐SNAs, HA‐SNAs+NIR for 24 h. f) Western blot analysis and quantitation of g) Col2α, h) aggrecan, i) MMP‐1, and j) MMP‐13 expression in chondrocytes treated with 10 mU of H2O2, and cocultured with HA, SNAs, HA‐SNAs, HA‐SNAs+NIR for 24 h. n = 3, *p < 0.05, **p < 0.01, ***p < 0.001, compared with control; # p < 0.05, ## p < 0.01, ### p < 0.001, compared with blank group.
Figure 6
Figure 6
Immunofluorescence staining. a) Representative photomicrographs of chondrocytes treated with 10 mU of H2O2 and co‐cultured with HA, SNAs, HA‐SNAs, HA‐SNAs+NIR for 12 h, acquired using a CLSM. Green: Molecular Probes labeling Col2α; red: Phalloidin labeling cell actin; blue: DAPI labeling cell nuclei. b) The quantitative data showing comparison of Col2α protein expression of chondrocytes treated with 10 mU of H2O2, and co‐cultured with HA, SNAs, HA‐SNAs, HA‐SNAs+NIR for 12 h. n = 3, **p < 0.01, ***p < 0.001, compared with control; ###p < 0.001, compared with HA‐SNAs+NIR.
Figure 7
Figure 7
X‐ray radiography. Representative X‐ray radiographs of the mice knee joints showing the treatment of DMM‐induced OA after the intra‐articular injection of PBS, HA, SNAs, HA‐SNAs, HA‐SNAs+NIR at a) 4 weeks and at b) 12 weeks after surgery. The relative articular space width between the medial compartments of mouse knee joints at c) 4 weeks and at d) 12 weeks after surgery. n = 5, *p < 0.05, compared with the PBS group.
Figure 8
Figure 8
Micro‐CT arthrography. a) Representative micro‐CT scanning and reconstruction of mouse knee joints showing the treatment of DMM‐induced OA after the intra‐articular injection of PBS, HA, SNAs, HA‐SNAs, HA‐SNAs+NIR at 12 weeks after surgery. b) The relative articular space width between the medial compartments of mice knee joints at 12 weeks after surgery. c) The relative osteophytes volume of the experimental groups. n = 5, **p < 0.01, ***p < 0.001, compared with the PBS group.
Figure 9
Figure 9
Histological staining. a) Representative H&E staining, b) Toluidine Blue staining, and c) Safranin O‐fast green staining of the cartilage sections showing the treatment of mouse DMM‐induced OA after injection of PBS, HA, SNAs, HA‐SNAs, and HA‐SNAs+NIR at 12 weeks after surgery. d) GAG content relative to the sham group obtained from the quantitative analysis of Safranin O‐fast green staining of the cartilage sections using the Image J software. e) OARSI score of articular cartilage for each group after treatment for 12 weeks. n = 10. *p < 0.05, **p < 0.01, ***p < 0.001, compared with the PBS group.
Figure 10
Figure 10
Immunohistochemistry staining. a) Representative fluorescence images showing the protein expression level of Col2α in the articular cartilage of mice knee joints after intra‐articular injection of PBS, HA, SNAs, HA‐SNAs and HA‐SNAs+NIR at 12 weeks following the DMM surgery. b) The quantitative data showing the protein expression level of Col2α acquired from the fluorescence intensity using the Image J software. n = 10, the values are presented as mean ± SD, ***p < 0.001, compared with the Sham group; ### p < 0.001, compared with the HA‐SNAs+NIR group.

References

    1. Hunter D., Bierma‐Zeinstra S., Lancet 2019, 393, 1745. - PubMed
    1. Zhao L., Huang J., Fan Y., Li J., You T., He S., Xiao G., Chen D., Ann. Rheum. Dis. 2019, 78, 676. - PMC - PubMed
    1. Kapoor M., Martel‐Pelletier J., Lajeunesse D., Pelletier J., Fahmi H., Nat. Rev. Rheumatol. 2011, 7, 33. - PubMed
    1. Glyn‐Jones S., Palmer A., Agricola R., Price A., Vincent T., Weinans H., Carr A., Lancet 2015, 386, 376. - PubMed
    1. Jones I., Togashi R., Wilson M., Heckmann N., Vangsness C. Jr, Nat. Rev. Rheumatol. 2019, 15, 77. - PMC - PubMed

Publication types

LinkOut - more resources