. 2021 Feb 17;8(9):2004831.
doi: 10.1002/advs.202004831. eCollection 2021 May.

Extracellular Vesicles from Child Gut Microbiota Enter into Bone to Preserve Bone Mass and Strength

Affiliations

Extracellular Vesicles from Child Gut Microbiota Enter into Bone to Preserve Bone Mass and Strength

Jiang-Hua Liu et al. Adv Sci (Weinh). .

Abstract

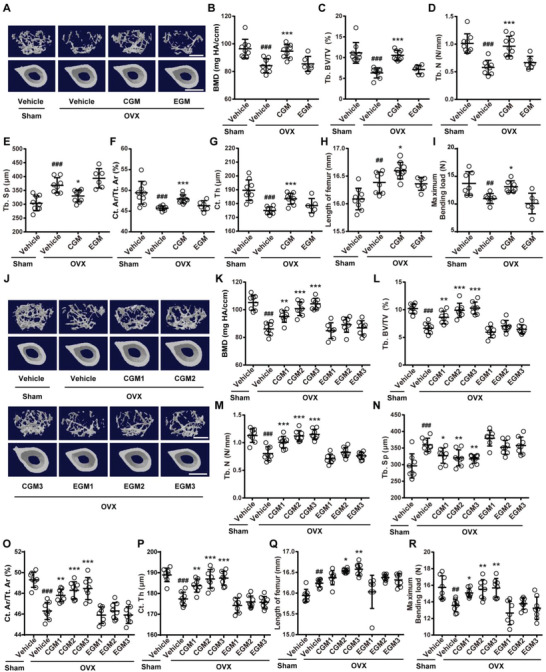
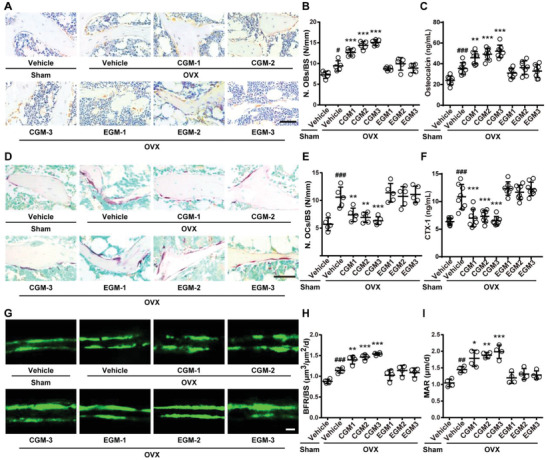
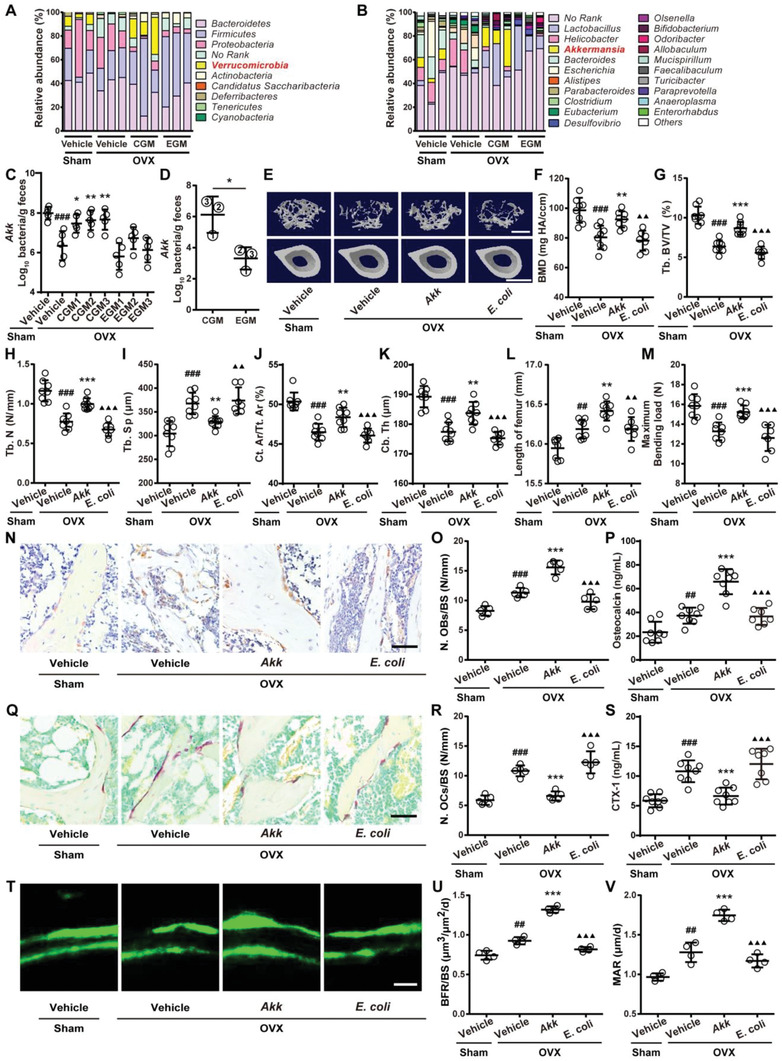
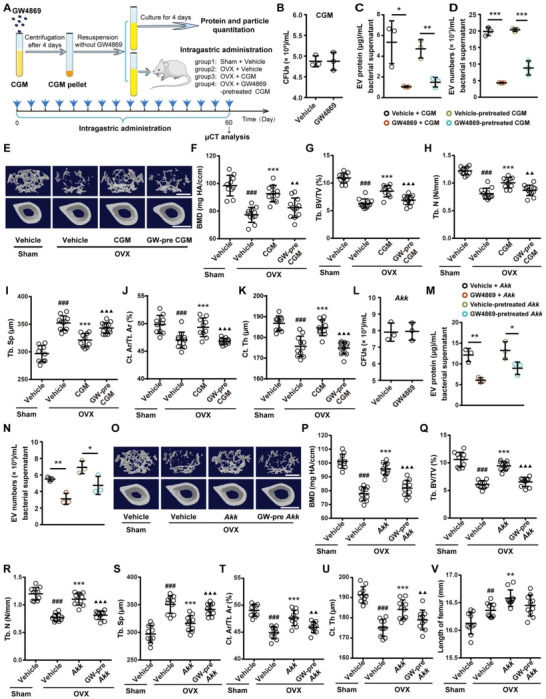
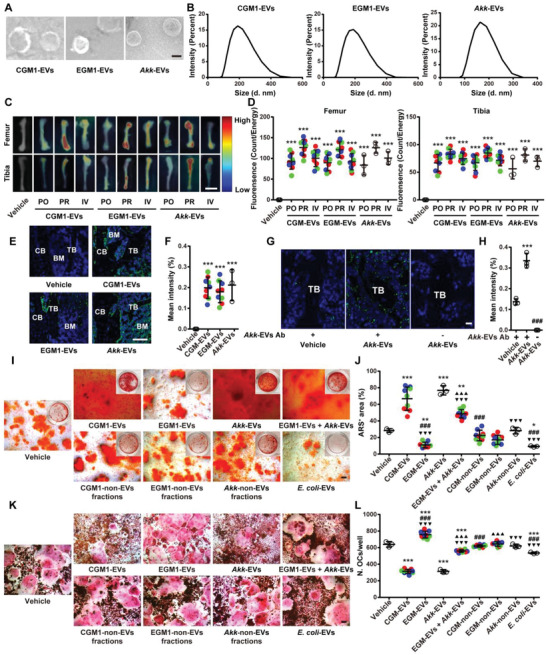
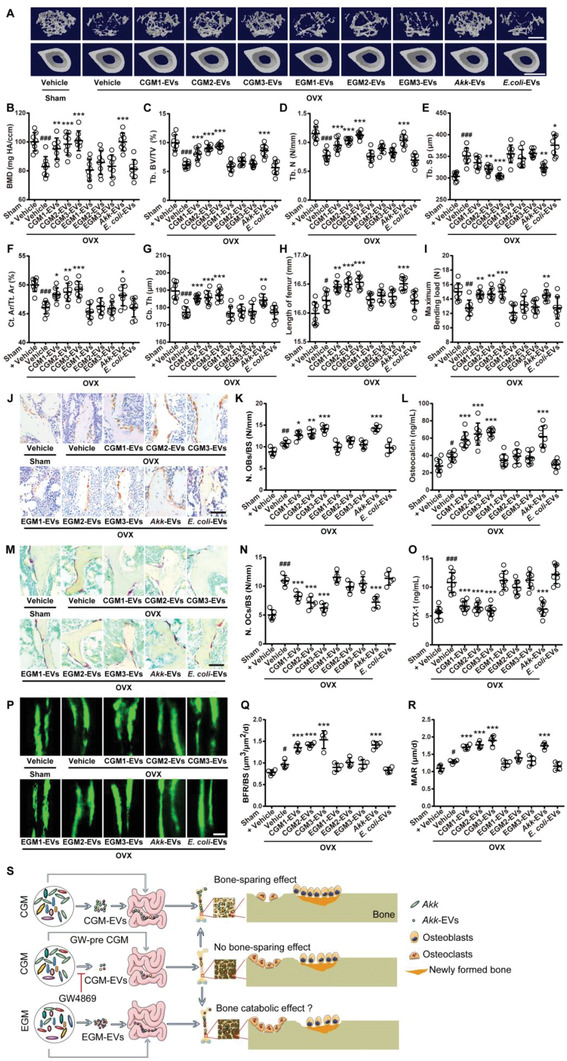
Recently, the gut microbiota (GM) has been shown to be a regulator of bone homeostasis and the mechanisms by which GM modulates bone mass are still being investigated. Here, it is found that colonization with GM from children (CGM) but not from the elderly (EGM) prevents decreases in bone mass and bone strength in conventionally raised, ovariectomy (OVX)-induced osteoporotic mice. 16S rRNA gene sequencing reveals that CGM reverses the OVX-induced reduction of Akkermansia muciniphila (Akk). Direct replenishment of Akk is sufficient to correct the OVX-induced imbalanced bone metabolism and protect against osteoporosis. Mechanistic studies show that the secretion of extracellular vesicles (EVs) is required for the CGM- and Akk-induced bone protective effects and these nanovesicles can enter and accumulate into bone tissues to attenuate the OVX-induced osteoporotic phenotypes by augmenting osteogenic activity and inhibiting osteoclast formation. The study identifies that gut bacterium Akk mediates the CGM-induced anti-osteoporotic effects and presents a novel mechanism underlying the exchange of signals between GM and host bone.

Keywords: Akkermansia muciniphila; bone homeostasis; extracellular vesicles; gut microbiota.


Conflict of interest statement

The authors declare no conflict of interest.

Figures

Figure 1
Figure 1
CGM increases bone mass, bone length, and bone strength in OVX mice. A) Representative µCT images of trabecular (up) and cortical (bottom) bone in femora from mice in Sham + Vehicle, OVX + Vehicle, OVX + pooled CGM, and OVX + pooled EGM groups. CGM: gut microbiota from child. EGM: gut microbiota from the elderly. Scale bars: 500 µm (up) and 1 mm (bottom). Quantitative analysis of B) bone mineral density (BMD), C) trabecular bone volume fraction (Tb. BV/TV), D) trabecular number (Tb. N), E) trabecular separation (Tb. Sp), F) cortical bone area fraction (Ct. Ar/Tt. Ar), and G) cortical thickness (Ct. Th). n = 6–9 per group. H) Lengths of femora. n = 6–9 per group. I) Three‐point bending measurement of femur ultimate load. n = 6–7 per group. J) Representative µCT images of trabecular (up) and cortical (bottom) bone in femora from Sham and OVX mice treated with vehicle or different donor‐derived CGM or EGM. Scale bars: 500 µm (up) and 1 mm (bottom). Quantitative analysis of K) BMD, L) Tb. BV/TV, M) Tb. N, N) Tb. Sp, O) Ct. Ar/Tt. Ar, and P) Ct. Th. n = 7–8 per group. Q) Lengths of femora. n = 7–8 per group. R) Femur ultimate load measured by three‐point bending test. n = 7–8 per group. Data are presented as mean ± SD. # P < 0.05 versus Sham + Vehicle group and * P < 0.05 versus OVX + Vehicle group. * P < 0.05, ##/** P < 0.01, and ###/*** P < 0.001.
Figure 2
Figure 2
CGM reverses the imbalanced bone metabolism in OVX mice. A) Representative OCN‐stained sections with quantification of the B) number of osteoblasts (N. OBs) on trabecular bone surface (BS) in distal femora from mice treated with vehicle or different donor‐derived CGM or EGM. n = 5 per group. Scale bar: 50 µm. C) ELISA for serum OCN. n = 7–8 per group. D) Representative TRAP‐stained sections with quantitation of the E) number of osteoclasts (N. OCs). n = 5 per group. Scale bar: 50 µm. F) ELISA for serum CTX‐I. n = 7–8 per group. G) Representative images of calcein double labeling with quantitation of H) bone formation rate per bone surface (BFR/BS) and I) mineral apposition rate (MAR). Scale bar: 10 µm. n = 4 per group. Data are presented as mean ± SD. # P < 0.05 versus Sham + Vehicle group and * P < 0.05 versus OVX + Vehicle group. #/* P < 0.05, ##/** P < 0.01, and ###/*** P < 0.001.
Figure 3
Figure 3
CGM rescues the loss of gut Akk during osteoporosis and supplementation of Akk attenuates osteoporotic phenotypes in OVX mice. Composition of fecal microbiota at the A) phylum and B) genus levels tested by 16S rRNA gene sequencing. n = 3 per group. As for genus, the proportion <1% occupancy is noted as others. qRT‐PCR analysis of Akk abundance in fecal microbiota from C) Sham and OVX mice receiving different treatments (n = 5 per group), or from D) different CGM and EGM donors (n = 3 per group). E) Representative µCT images of trabecular (up) and cortical (bottom) bone in femora and quantification of F) BMD, G) Tb. BV/TV, H) Tb. N, I) Tb. Sp, J) Ct. Ar/Tt. Ar, and K) Ct. Th. Scale bars: 500 µm (up) and 1 mm (bottom). n = 7–8 per group. L) Lengths of femora. n = 7–8 per group. M) Femur ultimate load measured by three‐point bending test. n = 7–8 per group. N) Representative OCN‐stained sections with quantification of O) osteoblast number. Scale bar: 50 µm. n = 5 per group. P) ELISA for serum OCN. n = 7–8 per group. Q) Representative TRAP‐stained sections with quantification of R) osteoclast number. Scale bar: 50 µm. n = 5 per group. S) ELISA for serum CTX‐I. n = 7–8 per group. T) Representative images of calcein double labeling with quantitation of U) BFR/BS and V) MAR. Scale bar: 10 µm. n = 4 per group. Data are presented as mean ± SD. For panel (D): * P < 0.05 versus CGM group. For other dot plots: # P < 0.05 versus Sham + Vehicle group, * P < 0.05 versus OVX + Vehicle group, and P < 0.05 versus OVX + Akk group. * P < 0.05, ##/**/▲▲ P < 0.01, and ###/***/▲▲▲ P < 0.001.
Figure 4
Figure 4
EVs secretion is required for the anti‐osteoporotic activity of CGM and Akk. A) Experiment design for testing the impact of GW4869 on the secretion of EVs by CGM and on the anti‐osteoporotic properties of CGM. The Sham and OVX mice were orally treated with vehicle, CGM, or GW4869‐pretreated CGM twice a week for 8 weeks (16 times within 60 days). B) Quantification of the number of bacterial colonies formed by the vehicle‐ or GW4869‐treated CGM. n = 3 per group. C) Total protein contents and D) particle numbers of EVs from CGM treated with vehicle or GW4869 for 4 days, or from CGM pretreated with vehicle or GW4869 for 4 days and cultured in fresh medium without vehicle or GW4869 for another 4 days. n = 3 per group. E) Representative µCT images of trabecular (up) and cortical (bottom) bone in femora and quantification of F) BMD, G) Tb. BV/TV, H) Tb. N, I) Tb. Sp, J) Ct. Ar/Tt. Ar, and K) Ct. Th. Scale bars: 500 µm (up) and 1 mm (bottom). n = 10–12 per group. L) Quantification of the number of bacterial colonies formed by the vehicle‐ or GW4869‐treated Akk. n = 3 per group. M) Total protein contents and N) particle numbers of EVs from Akk treated or pretreated with vehicle or GW4869 for 4 days. n = 3 per group. O) Representative µCT images of trabecular (up) and cortical (bottom) bone in femora and quantification of P) BMD, Q) Tb. BV/TV, R) Tb. N, S) Tb. Sp, T) Ct. Ar/Tt. Ar, and U) Ct. Th. Scale bars: 500 µm (up) and 1 mm (bottom). n = 10 per group. V) Lengths of femora. n = 10 per group. Data are presented as mean ± SD. For panels (F)–(J) and (O)–(T): # P < 0.05 versus Sham + Vehicle group, * P < 0.05 versus OVX + Vehicle group, and P < 0.05 versus OVX + CGM or Akk group. * P < 0.05, ##/**/▲▲ P < 0.01, and ###/***/▲▲▲ P < 0.001.
Figure 5
Figure 5
CGM‐EVs and Akk‐EVs can be transported to the mouse bone tissues and directly promote osteogenesis and inhibit osteoclastogenesis in vitro. A) Morphological analysis of CGM1‐EVs, EGM1‐EVs, and Akk‐EVs by transmission electron microscopy. Scale bar: 50 nm. B) Particle size distribution of different EVs measured by DLS. C) Ex vivo fluorescent imaging of the femur and tibia from mice treated with vehicle or the DIR‐labeled EVs for 1 h and D) quantification of the fluorescent signals. PO: per os; PR: per rectal; IV: intravenous. Scale bar: 6 mm. n = 3 per group. E) Confocal microscopy analysis of the femoral sections from mice treated with the PKH67‐labeled EVs for 1 h by oral route. CB: cortical bone; TB: trabecular bone; BM: bone marrow. Scale bar: 20 µm. F) Quantification of the fluorescent signals in (E). n = 3 per group. G) Representative images of the Akk‐EVs antibody (Ab)‐stained femoral sections with quantification of the H) positive signals. Scale bar: 10 µm. n = 3 per group. I) Representative ARS staining images of BMSCs receiving different treatments and J) quantitation of the percentage of ARS‐positive areas per well in a 48‐well plate. Scale bar: 100 µm. n = 3 per group. K) Representative TRAP staining images of RAW264.7 cells receiving different treatments and L) quantification of osteoclast number per well in a 48‐well plate. Scale bar: 100 µm. n = 3 per group. Data are presented as mean ± SD. For panels (D), (F), (J), and (L): Red dots indicate CGM1‐EVs or EGM1‐EVs, green dots indicate CGM2‐EVs or EGM2‐EVs, and blue dots indicate CGM3‐EVs or EGM3‐EVs. For panels (D) and (F): * P < 0.05 versus Vehicle group. For panel (H): * P < 0.05 versus Vehicle + Akk‐EVs Ab group and # P < 0.05 versus Akk‐EVs + Akk‐EVs Ab group. For panels (J) and (L): * P < 0.05 versus Vehicle group, # P < 0.05 versus CGM‐EVs group, P < 0.05 versus EGM‐EVs group, and P < 0.05 versus Akk‐EVs group. ** P < 0.01 and ***/###/▲▲▲/▼▼▼ P < 0.001.
Figure 6
Figure 6
CGM‐EVs and Akk‐EVs protect against OVX‐induced osteoporosis after oral administration. A) Representative µCT images of trabecular (up) and cortical (bottom) bone in femora from Sham and OVX mice receiving vehicle or different EVs by oral route. Scale bars: 500 µm (up) and 1 mm (bottom). Quantification of B) BMD, C) Tb. BV/TV, D) Tb. N, E) Tb. Sp, F) Ct. Ar/Tt. Ar, and G) Ct. Th. n = 8 per group. H) Lengths of femora. n = 8 per group. I) Femur ultimate load measured by three‐point bending test. n = 8 per group. J) Representative OCN‐stained sections with quantification of K) osteoblast number. Scale bar: 50 µm. n = 5 per group. L) ELISA for serum OCN. n = 8 per group. M) Representative TRAP‐stained sections with quantification of N) osteoclast number. Scale bar: 50 µm. n = 5 per group. O) ELISA for serum CTX‐I. n = 8 per group. P) Representative images of calcein double labeling with quantitation of Q) BFR/BS and R) MAR. Scale bar: 10 µm. n = 4 per group. S) Schematic diagram summarizing the major findings of this study. Data are presented as mean ± SD. # P < 0.05 versus Sham + Vehicle group, * P < 0.05 versus OVX + Vehicle group. #/* P < 0.05, ##/** P < 0.01, and ###/*** P < 0.001.

Similar articles

Cited by

References

    1. Distrutti E., Monaldi L., Ricci P., Fiorucci S., World J. Gastroenterol. 2016, 22, 2219. - PMC - PubMed
    1. Sjögren K., Engdahl C., Henning P., Lerner U. H., Tremaroli V., Lagerquist M. K., Backhed F., Ohlsson C., J. Bone Miner. Res. 2012, 27, 1357. - PMC - PubMed
    1. Quach D., Collins F., Parameswaran N., McCabe L., Britton R. A., mSphere 2018, 3, e00545. - PMC - PubMed
    1. Schwarzer M., Makki K., Storelli G., Machuca‐Gayet I., Srutkova D., Hermanova P., Martino M. E., Balmand S., Hudcovic T., Heddi A., Rieusset J., Kozakova H., Vidal H., Leulier F., Science 2016, 351, 854. - PubMed
    1. Yan J., Herzog J. W., Tsang K., Brennan C. A., Bower M. A., Garrett W. S., Sartor B. R., Aliprantis A. O., Charles J. F., Proc. Natl. Acad. Sci. USA 2016, 113, E7554. - PMC - PubMed

Publication types

LinkOut - more resources