. 2021 Jun:25:104285.
doi: 10.1016/j.rinp.2021.104285. Epub 2021 May 6.

Mathematical modeling of the COVID-19 pandemic with intervention strategies

Affiliations

Mathematical modeling of the COVID-19 pandemic with intervention strategies

Subhas Khajanchi et al. Results Phys. 2021 Jun.

Abstract

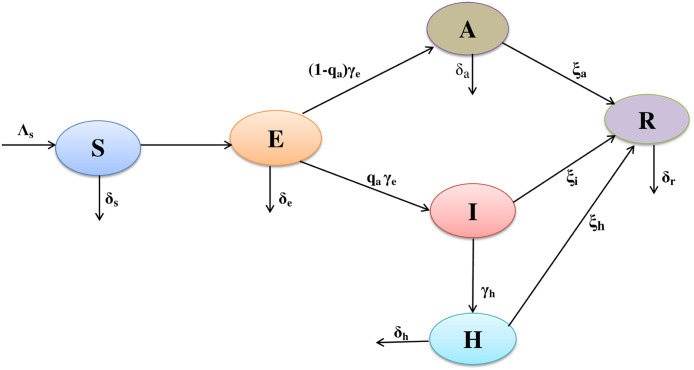
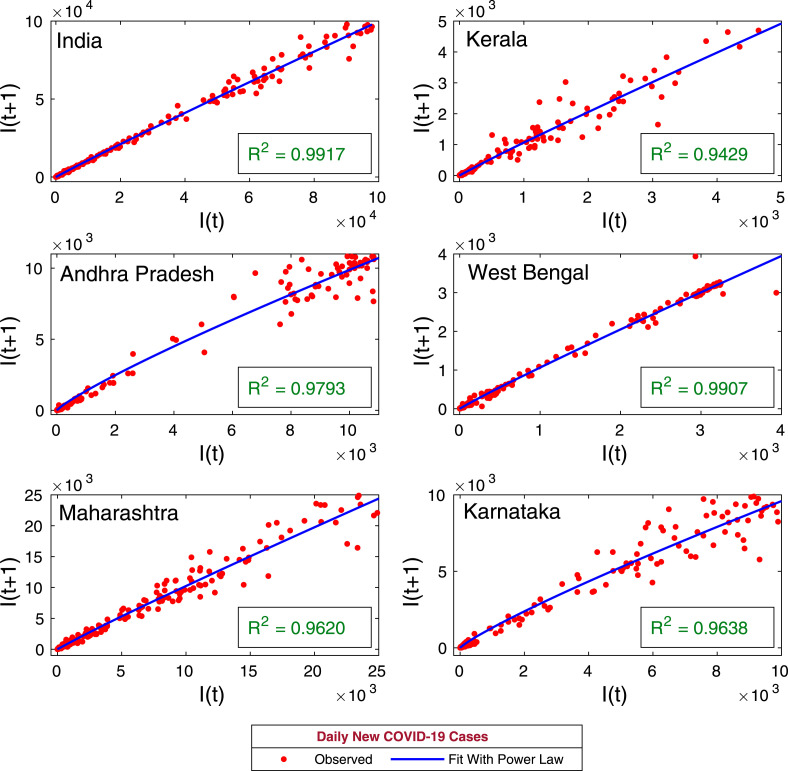
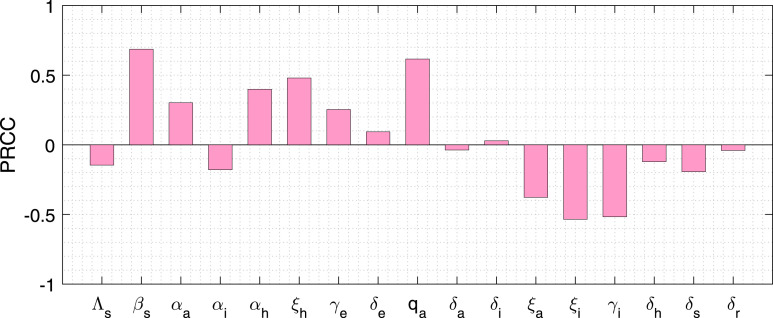
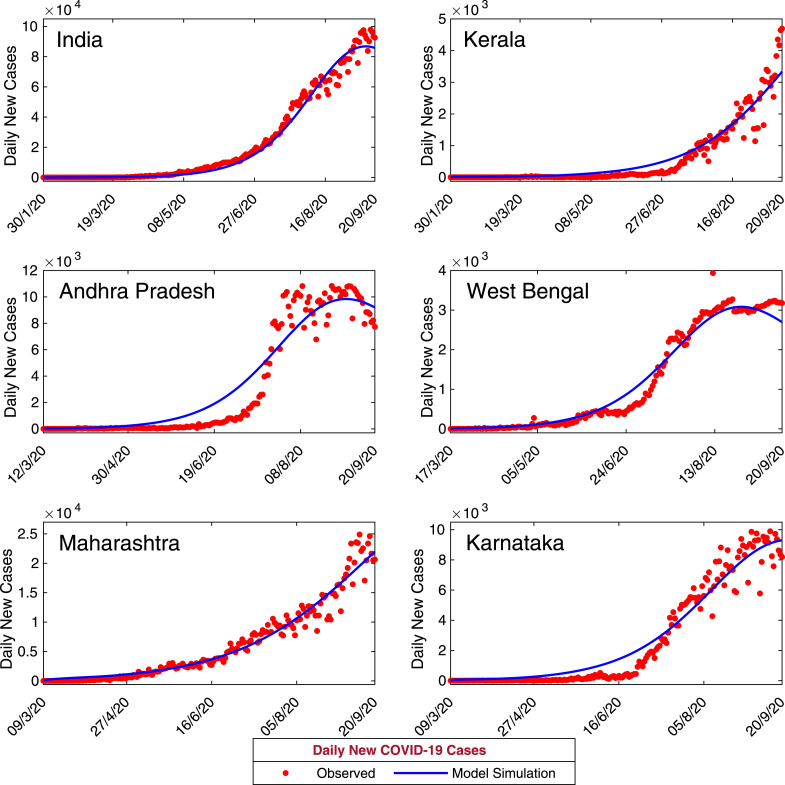
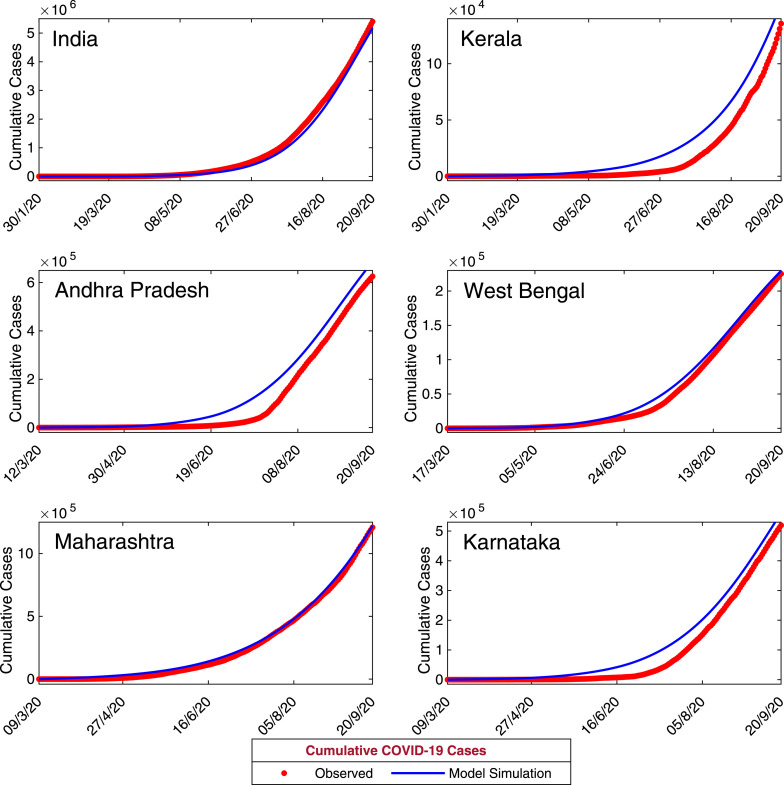
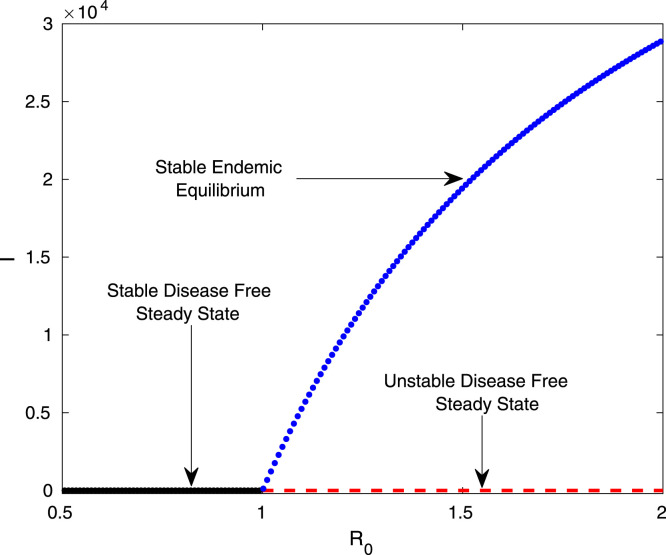
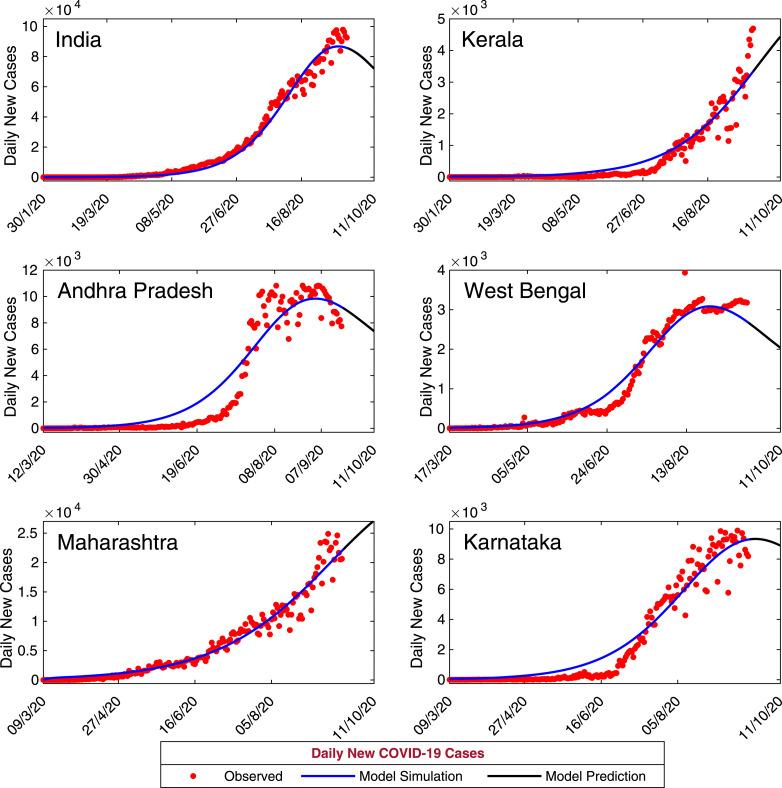
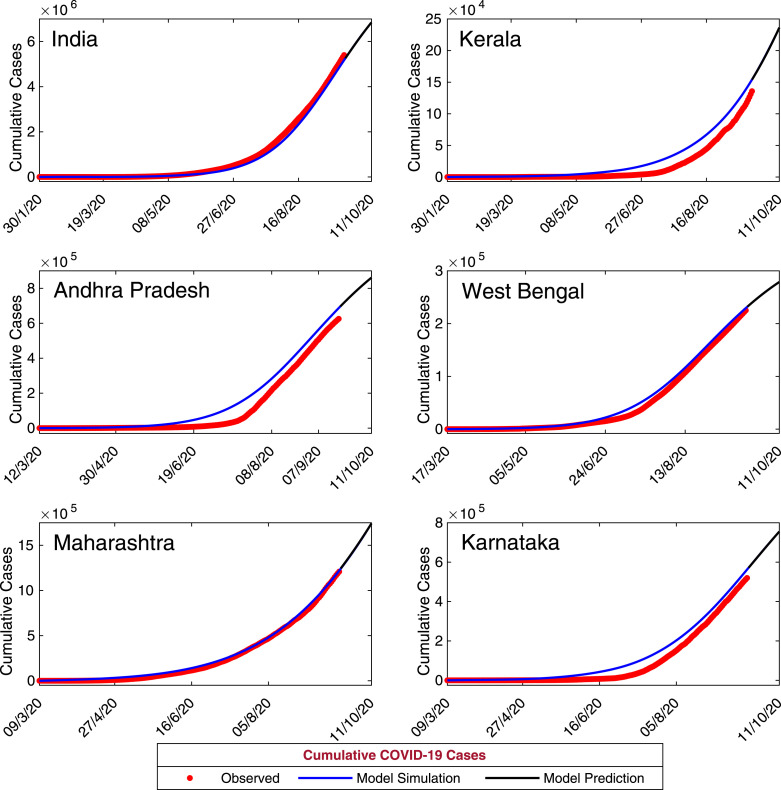
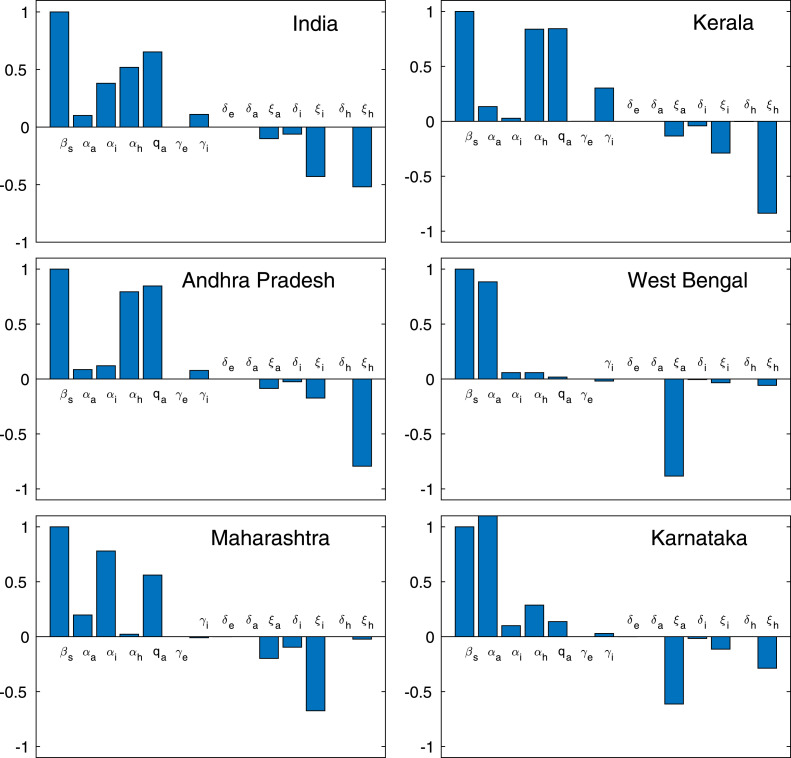
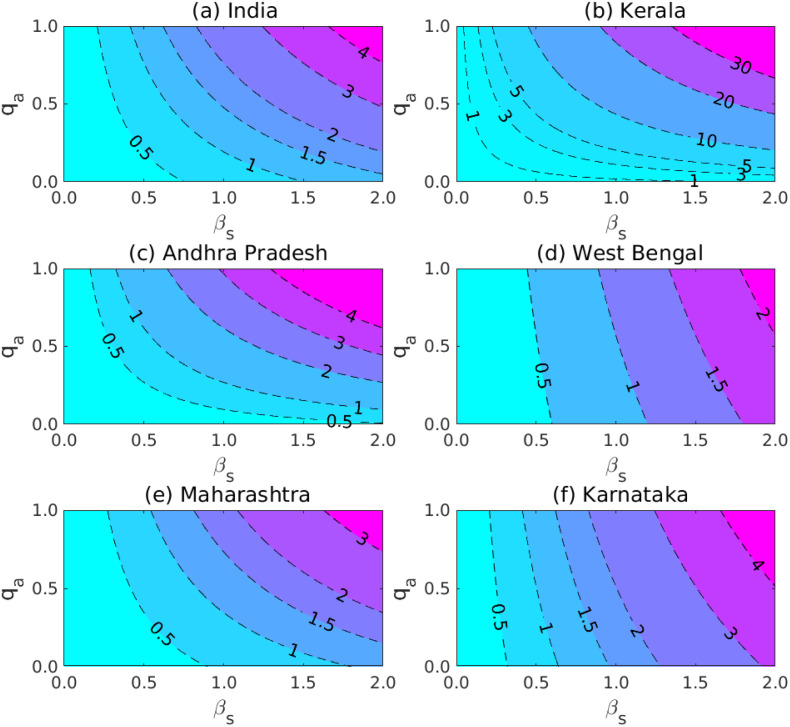
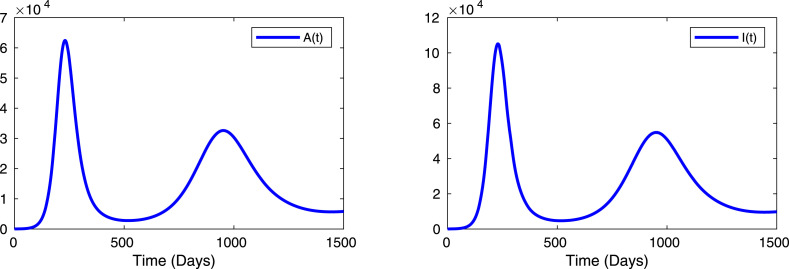
Mathematical modeling plays an important role to better understand the disease dynamics and designing strategies to manage quickly spreading infectious diseases in lack of an effective vaccine or specific antivirals. During this period, forecasting is of utmost priority for health care planning and to combat COVID-19 pandemic. In this study, we proposed and extended classical SEIR compartment model refined by contact tracing and hospitalization strategies to explain the COVID-19 outbreak. We calibrated our model with daily COVID-19 data for the five provinces of India namely, Kerala, Karnataka, Andhra Pradesh, Maharashtra, West Bengal and the overall India. To identify the most effective parameters we conduct a sensitivity analysis by using the partial rank correlation coefficients techniques. The value of those sensitive parameters were estimated from the observed data by least square method. We performed sensitivity analysis for R 0 to investigate the relative importance of the system parameters. Also, we computed the sensitivity indices for R 0 to determine the robustness of the model predictions to parameter values. Our study demonstrates that a critically important strategy can be achieved by reducing the disease transmission coefficient β s and clinical outbreak rate q a to control the COVID-19 outbreaks. Performed short-term predictions for the daily and cumulative confirmed cases of COVID-19 outbreak for all the five provinces of India and the overall India exhibited the steady exponential growth of some states and other states showing decays of daily new cases. Long-term predictions for the Republic of India reveals that the COVID-19 cases will exhibit oscillatory dynamics. Our research thus leaves the option open that COVID-19 might become a seasonal disease. Our model simulation demonstrates that the COVID-19 cases across India at the end of September 2020 obey a power law.

Keywords: Basic reproduction number; India; Model prediction; Power law; Sensitivity analysis.


Conflict of interest statement

The authors declare that they have no known competing financial interests or personal relationships that could have appeared to influence the work reported in this paper.

Figures

Fig. 1
Fig. 1
Schematic representation of the model. The schematic flow diagram represents the biological mechanism of the novel coronavirus (COVID-19) infection in India, which influences the formulation of the mathematical model (7). The mathematical model consists of six sub-populations: susceptible S(t), exposed E(t), asymptomatic A(t), symptomatic or clinically ill I(t), hospitalized or isolated H(t) and recovered R(t) individuals in a total population of N(t)=S(t) + E(t) + A(t) + I(t) + H(t) + R(t) individuals.
Fig. 2
Fig. 2
Power law growth. The figure represents the recurrence plots for the daily new coronavirus cases for five provinces of India, namely, Kerala, Andhra Pradesh, West Bengal, Maharashtra, Karnataka and the Republic of India. Solid blue curves are the best fit of the power law of the kind (10). The coefficient of determination (R2) for each provinces are shown in the inset. The trend of power law shows that the best fit curves are increasing for all the provinces of India as well as overall India.
Fig. 3
Fig. 3
Parameter Sensitivity. Partial rank correlation coefficients illustrating the dependence of symptomatic individuals I on each of the system parameters at the day 60 with p<0.02.
Fig. 4
Fig. 4
Model estimation based on observed data. Daily new confirmed positive coronavirus cases for India and five states of India, namely, Kerala, Andhra Pradesh, West Bengal, Maharashtra and Karnataka. Observed data are shown in red circles, whereas the blue curve is the best fitting curve of the model system (7). The parameter values are used for numerical simulation and listed in Table 2, Table 3. The initial population sizes used for numerical simulation are listed in Table 5.
Fig. 5
Fig. 5
Model estimation based on observed data. Daily cumulative confirmed coronavirus cases for India and five states of India, namely, Kerala, Andhra Pradesh, West Bengal, Maharashtra and Karnataka. Observed data points are shown in red circles, whereas the blue curve is the best fitting curve of the model system (7). The parameter values used for numerical simulation are listed in Table 2, Table 3. The initial population sizes used for numerical simulation are listed in Table 5. (For interpretation of the references to color in this figure legend, the reader is referred to the web version of this article.)
Fig. 6
Fig. 6
Transcritical bifurcation. The figure shows the transcritical bifurcation diagram of the system (7) with respect to the basic reproduction number R0. The stability of the system (7) interchange at the threshold R0=1. The parameters values are Λs=35000, qa=0.710, ξa=0.302, γi=0.201, ξh=0.114 and other parameters are listed in Table 2, Table 3. (For interpretation of the references to color in this figure legend, the reader is referred to the web version of this article.)
Fig. 7
Fig. 7
Model-Based Data-Driven short-term prediction. Model simulations shows the short term predictions for the five provinces of India, namely Kerala, Andhra Pradesh, West Bengal, Maharashtra, Karnataka and the Republic of India. The solid black curve represents the model predictions for the daily new infected coronavirus cases. The baseline parameter values are listed in Table 2 and rest of estimated parameters are listed in Table 3.
Fig. 8
Fig. 8
Model-Based Data-Driven short-term prediction. Model simulations shows the short term predictions for the five provinces of India, namely Kerala, Andhra Pradesh, West Bengal, Maharashtra, Karnataka and the Republic of India. The solid black curve represents the model predictions for the new infected cumulative coronavirus cases. The baseline parameter values are listed in Table 2 and rest of estimated parameters are listed in Table 3.
Fig. 9
Fig. 9
Normalized forward sensitivity indices ofR0. Result shows the normalized forward sensitivity indices of the basic reproduction number R0 for the five provinces of India, namely Kerala, Andhra Pradesh, West Bengal, Maharashtra, Karnataka and the Republic of India, with respect to each of the baseline parameter values using in Table 7.
Fig. 10
Fig. 10
Contour plots of basic reproduction numberR0. Contour plots of basic reproduction number R0 for the five different provinces of India and the Republic of India. Plot contours of R0 versus the disease transmission coefficient βs and the portion qa of exposed class after being clinically ill due to novel coronavirus. For (a) the Republic of India, (b) the province Kerala, (c) Andhra Pradesh, (d) West Bengal (e) Maharashtra and (f) Karnataka. The contour plots exhibits that the higher disease transmission probability of coronavirus disease will remarkably increase the basic reproduction number R0.
Fig. 11
Fig. 11
Long term dynamics. Long term dynamics for the coronavirus disease system (7) for the infectious individuals (asymptomatic and symptomatic populations). The value of the parameters used for the numerical simulation is given in Table 2, Table 3. The other parameters values are βs=0.879, γi=0.201, qa=0.710, ξa=0.302, ξh=0.114 and Λs=35000 with the initial conditions: S(0)=1600000, E(0)=250, A(0)=10, I(0)=1, H(0)=1, R(0)=0.

Similar articles

Cited by

References

    1. 2020. Coronavirus disease (COVID-19) outbreak situation.https://www.who.int/emergencies/diseases/novel-coronavirus -2019.
    1. Zhu N. A novel coronavirus from patients with pneumonia in china, 2019. N Engl J Med. 2019;382:727–733. - PMC - PubMed
    1. Fuk-Woo C.J. Novel coronavirus indicating person-to-person transmission: a study of a family cluster. Lancet. 2019;395(2020):514–523. - PMC - PubMed
    1. Cohen J., Normile D. New SARS-like virus in China triggers alarm. Science. 2020;367:234–235. - PubMed
    1. Tang B., Wang X., Li Q., Bragazzi N.L., Tang S., Xiao Y. Estimation of the transmission risk of the 2019-ncov and its implication for public health interventions. J Clin Med. 2020;9(2):462. - PMC - PubMed

LinkOut - more resources