

Using deep neural networks and interpretability methods to identify gene expression patterns that predict radiomic features and histology in non-small cell lung cancer
- PMID: 33977113
- PMCID: PMC8105647
- DOI: 10.1117/1.JMI.8.3.031906
Using deep neural networks and interpretability methods to identify gene expression patterns that predict radiomic features and histology in non-small cell lung cancer
Abstract
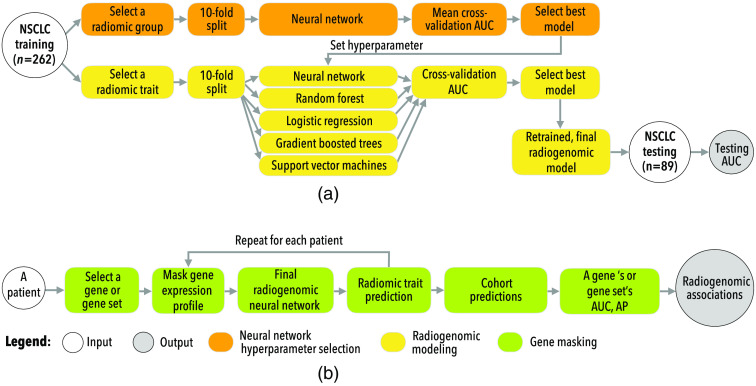
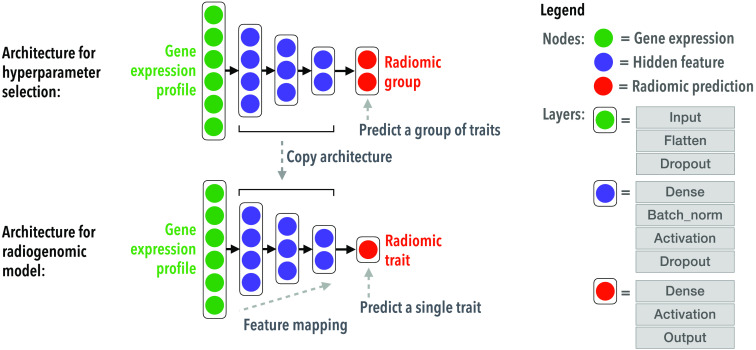
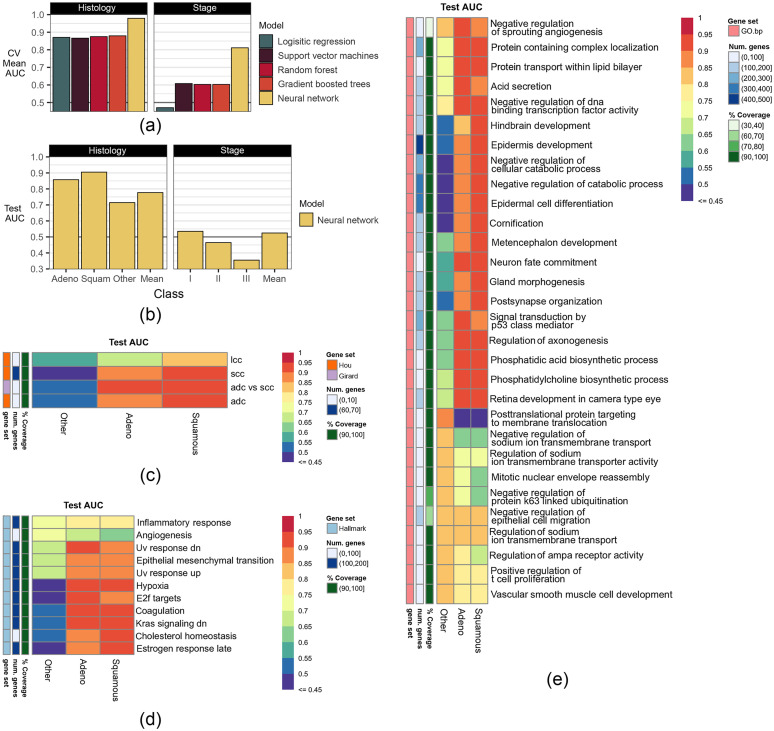
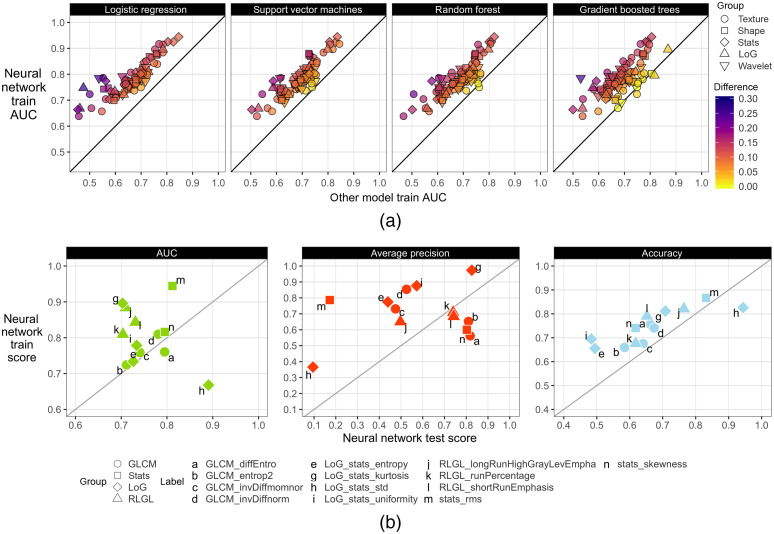
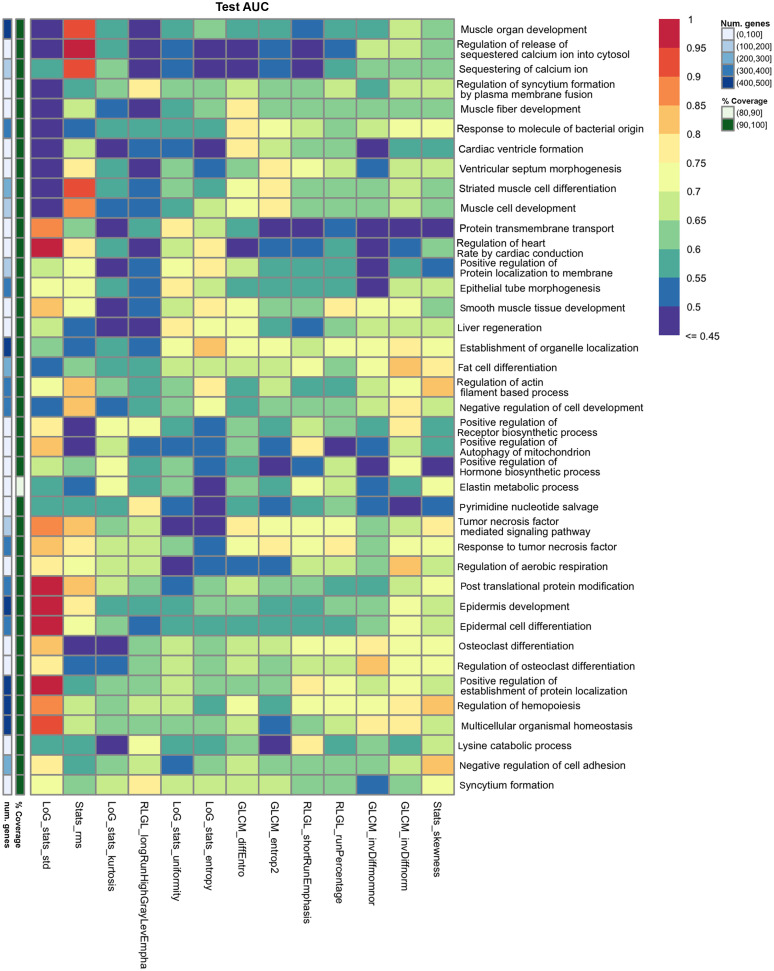
Purpose: Integrative analysis combining diagnostic imaging and genomic information can uncover biological insights into lesions that are visible on radiologic images. We investigate techniques for interrogating a deep neural network trained to predict quantitative image (radiomic) features and histology from gene expression in non-small cell lung cancer (NSCLC). Approach: Using 262 training and 89 testing cases from two public datasets, deep feedforward neural networks were trained to predict the values of 101 computed tomography (CT) radiomic features and histology. A model interrogation method called gene masking was used to derive the learned associations between subsets of genes and a radiomic feature or histology class [adenocarcinoma (ADC), squamous cell, and other]. Results: Overall, neural networks outperformed other classifiers. In testing, neural networks classified histology with area under the receiver operating characteristic curves (AUCs) of 0.86 (ADC), 0.91 (squamous cell), and 0.71 (other). Classification performance of radiomics features ranged from 0.42 to 0.89 AUC. Gene masking analysis revealed new and previously reported associations. For example, hypoxia genes predicted histology ( ). Previously published gene signatures for classifying histology were also predictive in our model ( ). Gene sets related to the immune or cardiac systems and cell development processes were predictive ( ) of several different radiomic features. AKT signaling, tumor necrosis factor, and Rho gene sets were each predictive of tumor textures. Conclusions: This work demonstrates neural networks' ability to map gene expressions to radiomic features and histology types in NSCLC and to interpret the models to identify predictive genes associated with each feature or type.
Keywords: deep learning; gene expression; model interpretability; non-small cell lung cancer; radiogenomics.
© 2021 Society of Photo-Optical Instrumentation Engineers (SPIE).
Figures
Similar articles
-
Radiomics-Based Features for Prediction of Histological Subtypes in Central Lung Cancer.Front Oncol. 2021 Apr 29;11:658887. doi: 10.3389/fonc.2021.658887. eCollection 2021. Front Oncol. 2021. PMID: 33996583 Free PMC article.
-
Differentiating Peripherally-Located Small Cell Lung Cancer From Non-small Cell Lung Cancer Using a CT Radiomic Approach.Front Oncol. 2020 Apr 22;10:593. doi: 10.3389/fonc.2020.00593. eCollection 2020. Front Oncol. 2020. PMID: 32391274 Free PMC article.
-
Exploratory Study to Identify Radiomics Classifiers for Lung Cancer Histology.Front Oncol. 2016 Mar 30;6:71. doi: 10.3389/fonc.2016.00071. eCollection 2016. Front Oncol. 2016. PMID: 27064691 Free PMC article.
-
Radiogenomics in brain, breast, and lung cancer: opportunities and challenges.J Med Imaging (Bellingham). 2021 May;8(3):031907. doi: 10.1117/1.JMI.8.3.031907. Epub 2021 Jun 18. J Med Imaging (Bellingham). 2021. PMID: 34164563 Free PMC article. Review.
-
Methods for identifying emergent concepts in deep neural networks.Patterns (N Y). 2023 Jun 9;4(6):100761. doi: 10.1016/j.patter.2023.100761. eCollection 2023 Jun 9. Patterns (N Y). 2023. PMID: 37409048 Free PMC article. Review.
Cited by
-
Radiogenomics: Hunting Down Liver Metastasis in Colorectal Cancer Patients.Cancers (Basel). 2021 Nov 5;13(21):5547. doi: 10.3390/cancers13215547. Cancers (Basel). 2021. PMID: 34771709 Free PMC article. Review.
-
The effect of harmonization on the variability of PET radiomic features extracted using various segmentation methods.Ann Nucl Med. 2024 Jul;38(7):493-507. doi: 10.1007/s12149-024-01923-7. Epub 2024 Apr 4. Ann Nucl Med. 2024. PMID: 38575814 Free PMC article.
-
Automated Prediction of Neoadjuvant Chemoradiotherapy Response in Locally Advanced Cervical Cancer Using Hybrid Model-Based MRI Radiomics.Diagnostics (Basel). 2023 Dec 19;14(1):5. doi: 10.3390/diagnostics14010005. Diagnostics (Basel). 2023. PMID: 38201314 Free PMC article.
-
Introduction to Special Issue Imaging in Cancer Diagnosis.Tomography. 2024 Jan 15;10(1):101-104. doi: 10.3390/tomography10010009. Tomography. 2024. PMID: 38250955 Free PMC article.
-
Synergies of Radiomics and Transcriptomics in Lung Cancer Diagnosis: A Pilot Study.Diagnostics (Basel). 2023 Feb 15;13(4):738. doi: 10.3390/diagnostics13040738. Diagnostics (Basel). 2023. PMID: 36832225 Free PMC article.
References
Grants and funding
LinkOut - more resources
Full Text Sources
Other Literature Sources
