

Variability in image quality and radiation dose within and across 97 medical facilities
- PMID: 33977114
- PMCID: PMC8105613
- DOI: 10.1117/1.JMI.8.5.052105
Variability in image quality and radiation dose within and across 97 medical facilities
Abstract
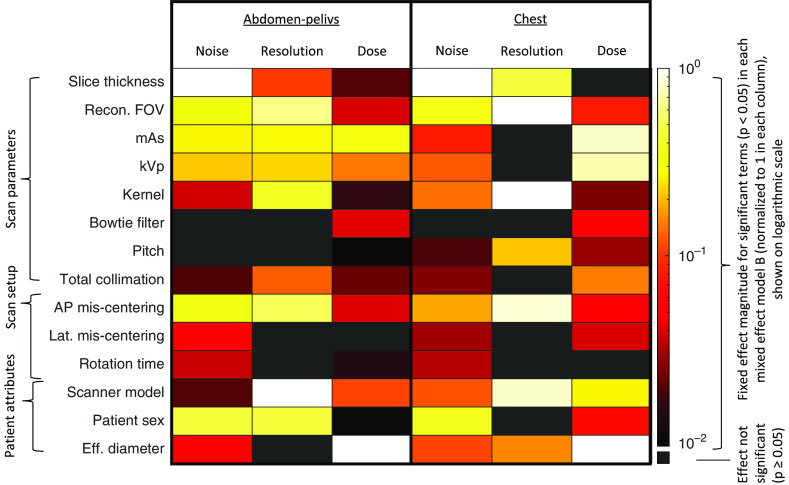
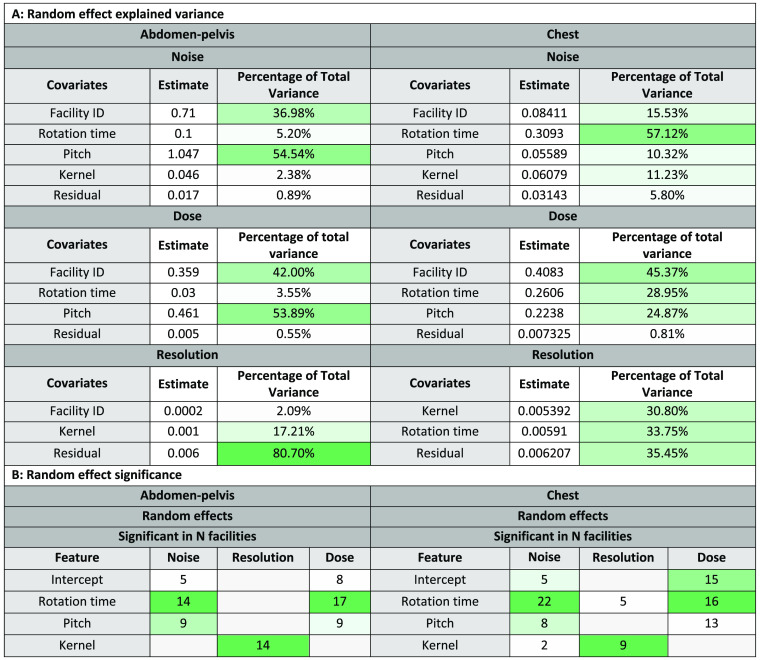
Purpose: To characterize variability in image quality and radiation dose across a large cohort of computed tomography (CT) examinations and identify the scan factors with the highest influence on the observed variabilities. Approach: This retrospective institutional-review-board-exempt investigation was performed on 87,629 chest and abdomen-pelvis CT scans acquired for 97 facilities from 2018 to 2019. Images were assessed in terms of noise, resolution, and dose metrics (global noise, frequency in which modulation transfer function is at 0.50, and volumetric CT dose index, respectively). The results were fit to linear mixed-effects models to quantify the variabilities as affected by scan parameters and settings and patient characteristics. A list of factors, ranked by -value with , was ascertained for each of the six mixed effects models. A type III -value test was used to assess the influence of facility. Results: Across different facilities, image quality and dose were significantly different ( ), with little correlation between their mean magnitudes and consistency (Pearson's correlation ). Scanner model, slice thickness, recon field-of-view and kernel, mAs, kVp, patient size, and centering were the most influential factors. The two body regions exhibited similar rankings of these factors for noise (Spearman's correlation ) and dose (Spearman's correlation ) but not for resolution (Spearman's correlation ). Conclusions: Clinical CT scans can vary in image quality and dose with broad implications for diagnostic utility and radiation burden. Average scan quality was not correlated with interpatient scan-quality consistency. For a given facility, this variability can be quite large, with magnitude differences across facilities. The knowledge of the most influential factors per body region may be used to better manage these variabilities within and across facilities.
Keywords: Image quality; computed tomography; patient-specific; radiation dose.
© 2021 Society of Photo-Optical Instrumentation Engineers (SPIE).
Figures
Similar articles
-
Performance of a deep learning-based CT image denoising method: Generalizability over dose, reconstruction kernel, and slice thickness.Med Phys. 2022 Feb;49(2):836-853. doi: 10.1002/mp.15430. Epub 2022 Jan 19. Med Phys. 2022. PMID: 34954845
-
Technical Note: Evaluation of a 160-mm/256-row CT scanner for whole-heart quantitative myocardial perfusion imaging.Med Phys. 2016 Aug;43(8):4821. doi: 10.1118/1.4957389. Med Phys. 2016. PMID: 27487900
-
Characteristic image quality of a third generation dual-source MDCT scanner: Noise, resolution, and detectability.Med Phys. 2015 Aug;42(8):4941-53. doi: 10.1118/1.4923172. Med Phys. 2015. PMID: 26233220
-
Synthetic CT: simulating low dose single and dual energy protocols from a dual energy scan.Med Phys. 2011 Oct;38(10):5551-62. doi: 10.1118/1.3633895. Med Phys. 2011. PMID: 21992373
-
CT head-scan dosimetry in an anthropomorphic phantom and associated measurement of ACR accreditation-phantom imaging metrics under clinically representative scan conditions.Med Phys. 2013 Aug;40(8):081917. doi: 10.1118/1.4815964. Med Phys. 2013. PMID: 23927331
Cited by
-
Oncology-specific radiation dose and image noise reference levels in adult abdominal-pelvic CT.Clin Imaging. 2023 Jan;93:52-59. doi: 10.1016/j.clinimag.2022.10.016. Epub 2022 Nov 7. Clin Imaging. 2023. PMID: 36375364 Free PMC article.
-
Special Section Guest Editorial: Computed tomography (CT) at 50 years.J Med Imaging (Bellingham). 2021 Sep;8(5):052101. doi: 10.1117/1.JMI.8.5.052101. Epub 2021 Oct 29. J Med Imaging (Bellingham). 2021. PMID: 34738026 Free PMC article.
-
Robust automated method of spatial resolution measurement in radiotherapy CT simulation images.J Appl Clin Med Phys. 2025 Mar;26(3):e70006. doi: 10.1002/acm2.70006. Epub 2025 Feb 13. J Appl Clin Med Phys. 2025. PMID: 39946267 Free PMC article.
-
Radiation Dose Reduction in Cancer Imaging with New-Model CT Scanners: A Quality of Care Evaluation.Cancers (Basel). 2025 May 29;17(11):1815. doi: 10.3390/cancers17111815. Cancers (Basel). 2025. PMID: 40507296 Free PMC article.
-
An image quality assessment index based on image features and keypoints for X-ray CT images.PLoS One. 2024 Jul 11;19(7):e0304860. doi: 10.1371/journal.pone.0304860. eCollection 2024. PLoS One. 2024. PMID: 38990930 Free PMC article.
References
LinkOut - more resources
Full Text Sources
Other Literature Sources
