. 2021 Apr 15;3(2):fcab081.
doi: 10.1093/braincomms/fcab081. eCollection 2021.

Terminal Schwann cells at the human neuromuscular junction

Affiliations

Terminal Schwann cells at the human neuromuscular junction

Abrar Alhindi et al. Brain Commun. .

Abstract

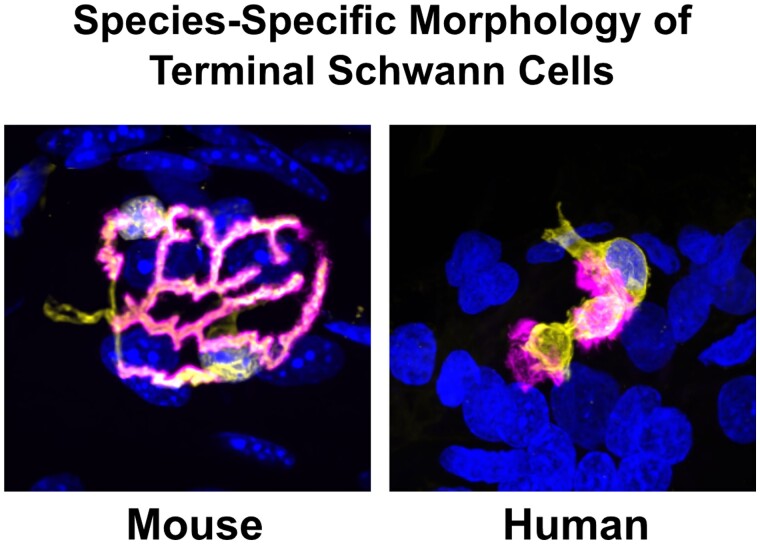
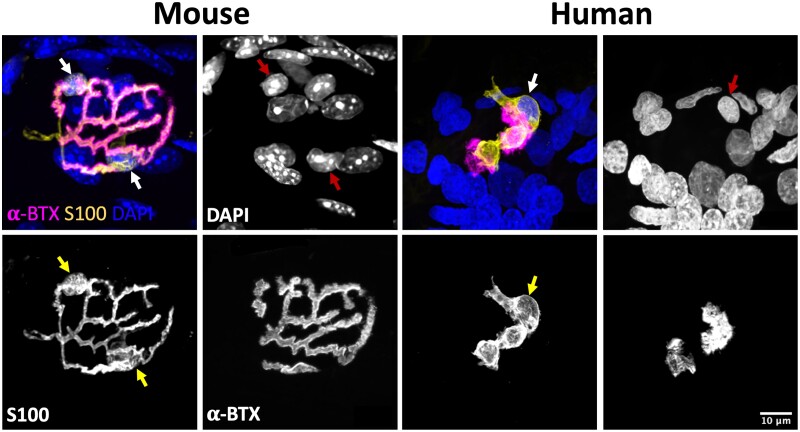
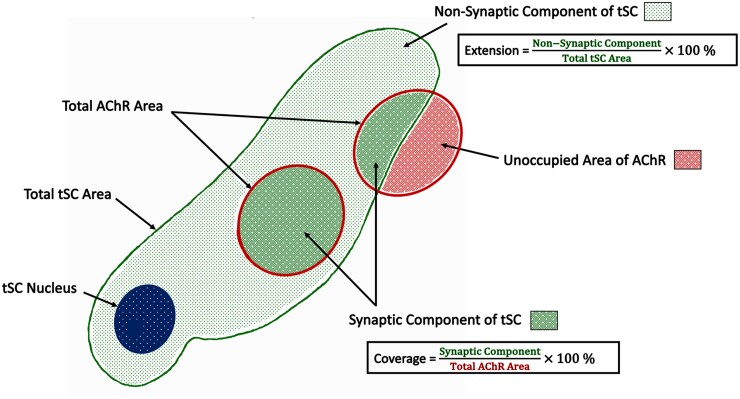
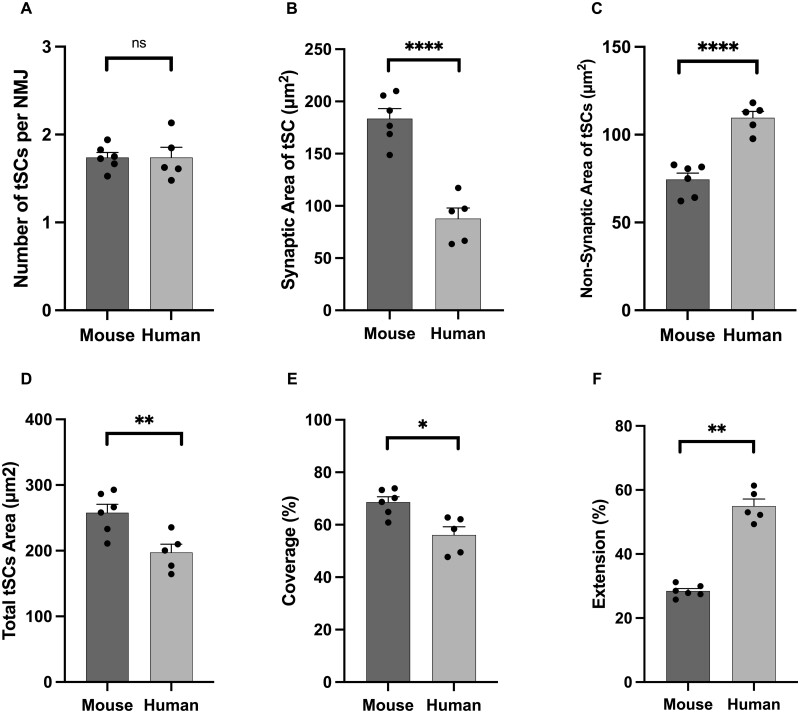
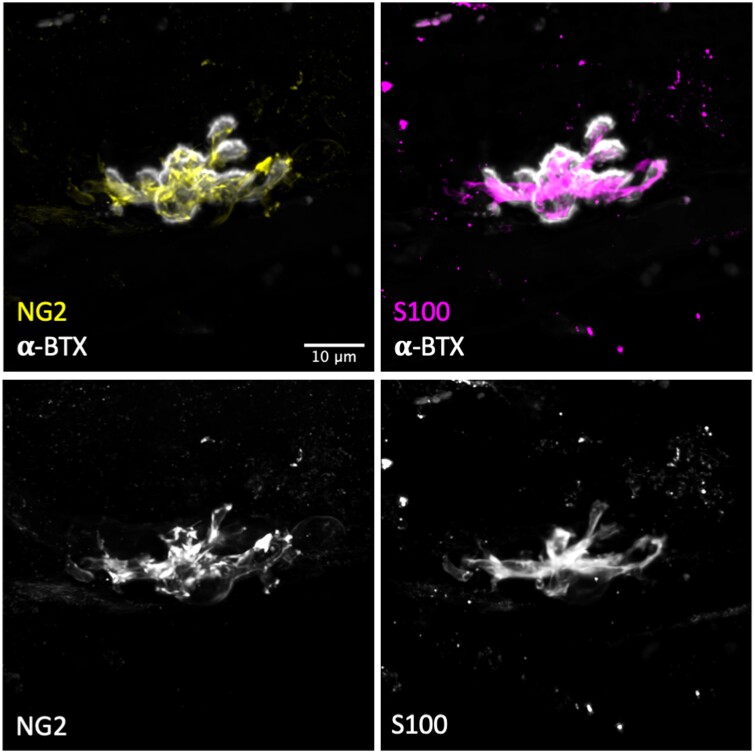
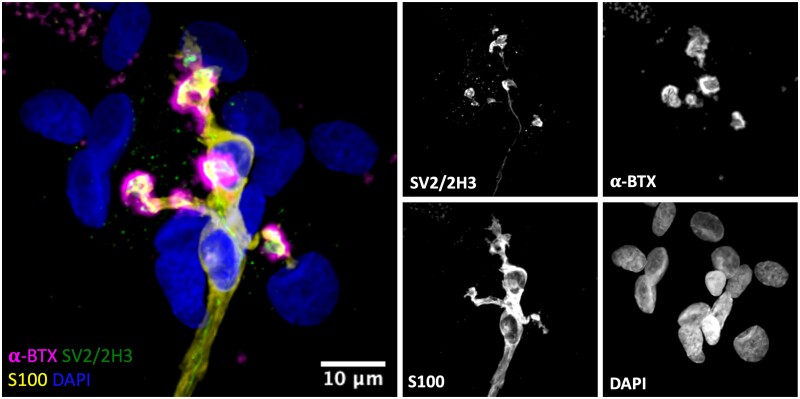
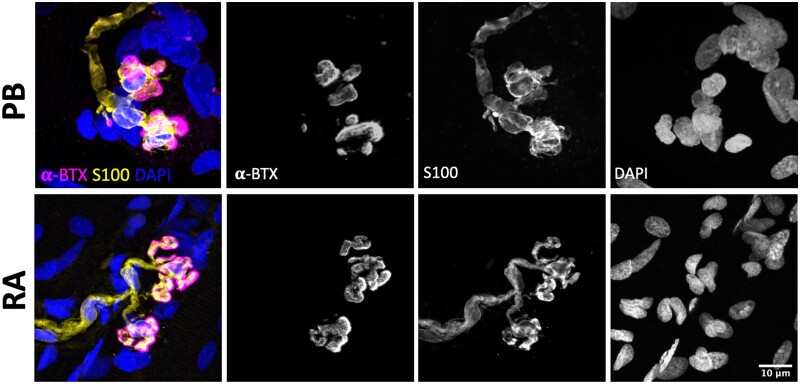
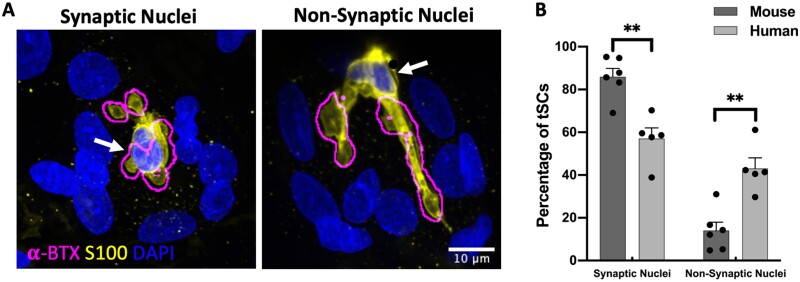
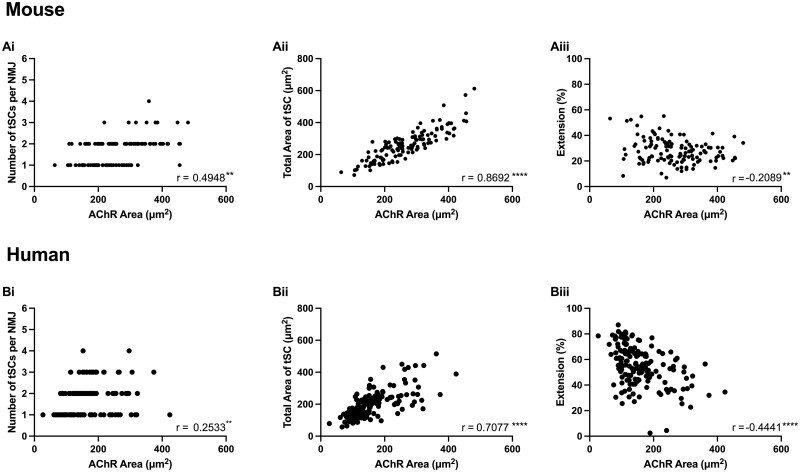
Terminal Schwann cells are non-myelinating glial cells localized to the neuromuscular junction. They play an important role in regulating many aspects of neuromuscular junction form and function, in health and during disease. However, almost all previous studies of mammalian terminal Schwann cells have used rodent models. Despite a growing awareness of differences in the cellular and molecular anatomy of rodent and human neuromuscular junctions, it remains unclear as to whether these differences also extend to the terminal Schwann cells. Here, we have adapted immunohistochemical protocols to facilitate visualization and comparative morphometric analyses of terminal Schwann cells at the human and mouse neuromuscular junction. We labelled terminal Schwann cells in the peroneus brevis muscle in six adult mice and five humans with antibodies against S100 protein. All human neuromuscular junctions were associated with at least one terminal Schwann cell, consistent with findings from other species, with an average of ∼1.7 terminal Schwann cells per neuromuscular junction in both humans and mice. In contrast, human terminal Schwann cells were significantly smaller than those of mice (P ≤ 0.01), in keeping with differences in overall synaptic size. Human terminal Schwann cell cytoplasm extended significantly beyond the synaptic boundaries of the neuromuscular junction, whereas terminal Schwann cells in mice were largely restricted to the synapse. Moreover, there was a significant difference in the location of terminal Schwann cell nuclei (P ≤ 0.01), with human terminal Schwann cells having their nuclear compartment located beyond the perimeter of the synapse more than the mouse. Taken together, these findings demonstrate that terminal Schwann cells at the human neuromuscular junction have notable differences in their morphology and synaptic relationships compared to mice. These fundamental differences need to be considered when translating the findings of both neuromuscular junction biology and pathology from rodents to humans.

Keywords: NMJ-morph; human; mouse; neuromuscular junction; terminal Schwann cell.


Figures

Graphical Abstract
Graphical Abstract
Figure 1
Figure 1
Terminal Schwann cells at the mouse and human neuromuscular junction. Representative confocal micrographs of mouse and human NMJs. Merged images show tSCs (yellow), AChRs (magenta) and nuclei (blue). tSC nuclei (red arrows) are identified by the surrounding halo of S100 cytoplasm (yellow arrows). Note how mouse tSCs closely mirror their corresponding AChR profiles; human tSCs show much less congruence, including non-synaptic cytoplasm that does not directly overlie the motor endplate. Terminal Schwann cells (tSCs) labelled with S100 (yellow); acetylcholine receptors (AChRs) labelled with α-BTX (magenta); nuclear staining with DAPI (blue). Scale bar = 10 µm across all the images.
Figure 2
Figure 2
Morphometric analysis of terminal Schwann cells. Schematic diagram. In addition to basic measurements of area and perimeter, several ‘markers of congruence’ were also defined. The total area of the terminal Schwann cell was sub-divided into a ‘synaptic component’ (directly overlying the AChRs) and a ‘non-synaptic component’ (extending beyond the AChRs). These measurements were then used to derive the percentage ‘extension’ of the terminal Schwann cells (beyond the AChRs) and the percentage ‘coverage’ of the AChRs (by the terminal Schwann cells). See also Table 1.
Figure 3
Figure 3
Species-specific differences in terminal Schwann cell morphology. Comparative analysis revealed characteristic differences in overall tSC morphology. Although the number of tSCs (per NMJ) was similar in both species (A), human tSCs were significantly smaller than those of mice (D). Characteristic differences were also noted in the spatial relationship between tSC and motor endplate (‘markers of congruence’ – B, C, E, F), with human tSCs having less ‘coverage’ of the AChRs (∼50% human cf. ∼70% mouse; panel E) but greater ‘extension’ beyond them (∼60% human cf. ∼30% mouse; panel F). Bar charts are mean ± SEM; each data point represents an individual muscle (human PB; N = 5, mouse PB; N = 6; a minimum of 17 NMJs per muscle; in total n = 126 mouse NMJs; n = 151 human NMJs). Unpaired t-test for parametric variables; Mann–Whitney test for non-parametric variables. *P ≤ 0.05, **P ≤ 0.01, ****P ≤ 0.0001.
Figure 4
Figure 4
S100 is a reliable marker for human tSCs. Representative confocal micrographs of human tSCs from the PB muscle with double immunolabelling to show co-localization of anti NG2 (yellow) and anti-S100 (magenta), confirming that S100 is an accurate marker for human tSCs. Both markers (S100-magenta) and (NG2-yellow) showed similar staining patterns and revealed similar tSC morphology. S100 staining was found to be more intense and more evenly distributed within the cell (particularly within the tSC cytoplasm). Acetylcholine receptors (AChRs) labelled with α-BTX (grey). Scale bar = 10 µm across all images.
Figure 5
Figure 5
Close congruence between motor nerve terminal and tSCs at the human NMJ. Representative confocal micrograph of a human NMJ from the PB muscle. Triple labelling of the basic cellular components of the NMJ; skeletal muscle fibre (AChRs; magenta), motor nerve terminals (green) and tSCs (yellow). The micrograph demonstrates a typical ‘healthy’ NMJ—the endplate is fully innervated, and there is close congruence between the nerve terminals and tSCs. The merged image shows terminal Schwann cells (tSCs) labelled with antibodies against S100 (yellow), nerve terminals labelled with antibodies against 2H3 and SV2 (green), acetylcholine receptors (AChRs) labelled with α-BTX (magenta), and nuclear staining with DAPI (blue). Scale bar = 10 µm.
Figure 6
Figure 6
Consistent tSC morphology across different human muscles. Representative confocal micrographs of human NMJs obtained from PB (peroneus brevis; top panels) and RA (rectus abdominus; bottom panels). PB muscle samples were harvested from patients undergoing lower limb amputation; RA muscle biopsies were obtained from patients undergoing abdominal surgery. tSCs had a very similar appearance in both muscles, suggesting that the morphology reported in PB samples was not related to body region, patient pathology, and/or sampling technique. Merged images show terminal Schwann cells (tSCs) labelled with S100 (yellow), acetylcholine receptors (AChRs) labelled with α-BTX (magenta), and nuclear staining with DAPI (blue). Scale bar = 10 µm across all images.
Figure 7
Figure 7
Location and placement of nuclei in human terminal Schwann cells. (A) Representative micrographs of human NMJs illustrating ‘synaptic’ and ‘non-synaptic’ placement of tSC nuclei (yellow: tSC/S100, blue: nuclei/DAPI). The ‘Find Edges’ function in ImageJ/FIJI was applied to the magenta channel (AChRs/alpha-BTX) to define the boundaries of the AChRs (methods acquired from Carrasco et al.23). The location of tSC nuclei is indicated by the white arrows. (B) Although the vast majority of mouse tSCs had a ‘synaptic’ placement of their nuclei (∼80%), human tSCs revealed a more even balance of ‘synaptic’ (∼60%) and ‘non-synaptic’ (∼40%) nuclei. Note also the ‘annular’ arrangement of myonuclei around the human NMJ. Bar charts are mean ± SEM; each data point represents an individual muscle; mouse: N = 6; n = 214 tSCs; human: N = 5; n = 247 tSCs. Mann–Whitney test for non-parametric variables. **P ≤ 0.01. Scale bar = 10 µm in both images.
Figure 8
Figure 8
Relationship between NMJ size and terminal Schwann cell morphology. Correlation analyses from both mouse (upper panels) and human (lower panels) NMJs. A significant, albeit modest, correlation was observed between NMJ size (AChR area) and tSC number in both mice (Ai) and humans (Bi). However, a stronger correlation was present between NMJ size and tSC area in both species (Aii and Bii). Also, an increase in AChR area was associated with a reduction in tSCs cytoplasmic extension (Aiii and Biii). Each data point represents a single NMJ and its tSCs (n = 126 mouse NMJs; n = 151 human NMJs). Pearson and Spearman correlation coefficients (r) for parametric and non-parametric variables, respectively. **P ≤ 0.01; ****P ≤ 0.0001.

Similar articles

Cited by

References

    1. Griffin JW, Thompson WJ.. Biology and pathology of nonmyelinating schwann cells. Glia. 2008;56(14):1518–1531. - PubMed
    1. Alvarez-Suarez P, Gawor M, Prószyński TJ.. Perisynaptic schwann cells - The multitasking cells at the developing neuromuscular junctions. Semin Cell Dev Biol. 2020;104:31–38. - PubMed
    1. Darabid H, Arbour D, Robitaille R.. Glial cells decipher synaptic competition at the mammalian neuromuscular junction. J Neurosci. 2013;33(4):1297–1313. - PMC - PubMed
    1. Darabid H, St-Pierre-See A, Robitaille R.. Purinergic-dependent glial regulation of synaptic plasticity of competing terminals and synapse elimination at the neuromuscular junction. Cell Rep. 2018;25(8):2070–2082.e6. - PubMed
    1. Winlow W, Usherwood PNR.. Ultrastructural studies of normal and degenerating mouse neuromuscular junctions. J Neurocytol. 1975;4(4):377–394. - PubMed

LinkOut - more resources