

Comparison of multiple tractography methods for reconstruction of the retinogeniculate visual pathway using diffusion MRI
- PMID: 33978265
- PMCID: PMC8288095
- DOI: 10.1002/hbm.25472
Comparison of multiple tractography methods for reconstruction of the retinogeniculate visual pathway using diffusion MRI
Abstract
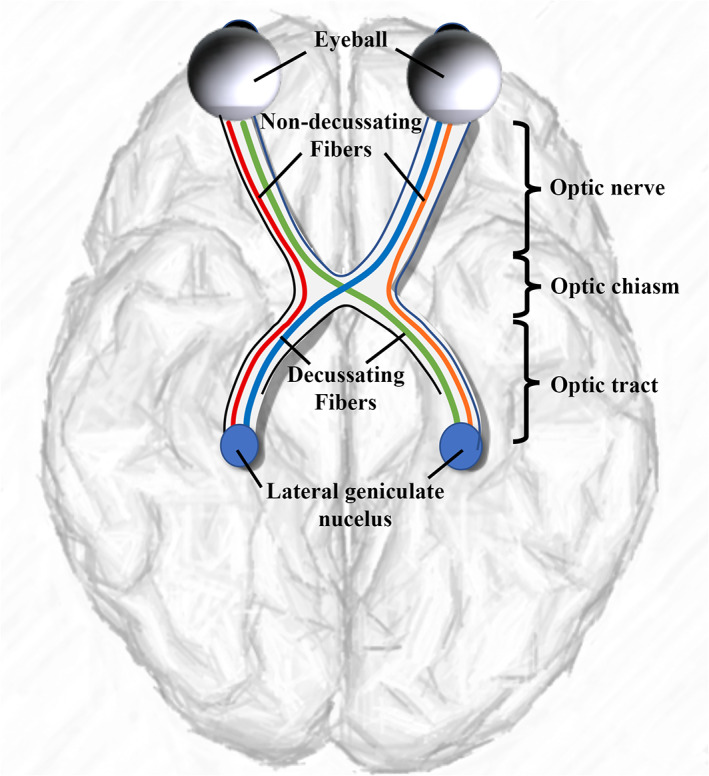
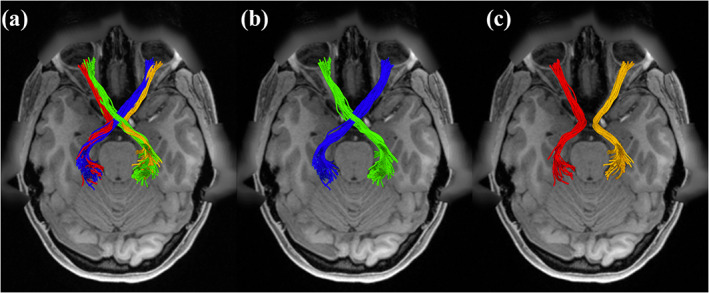
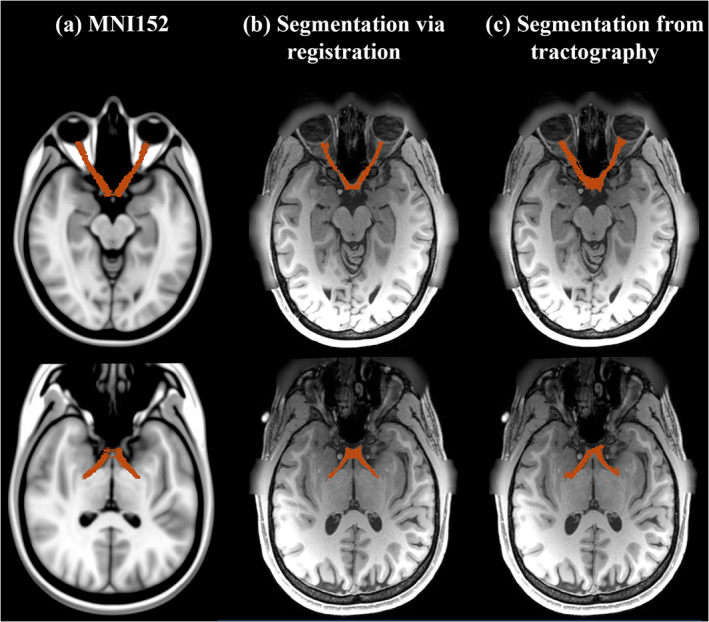
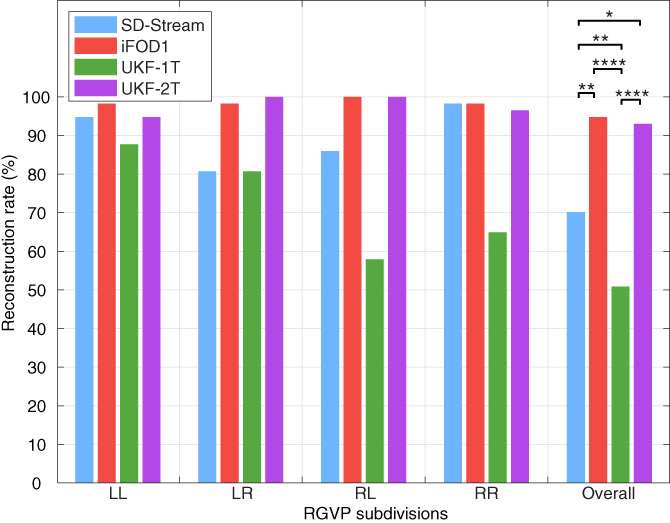
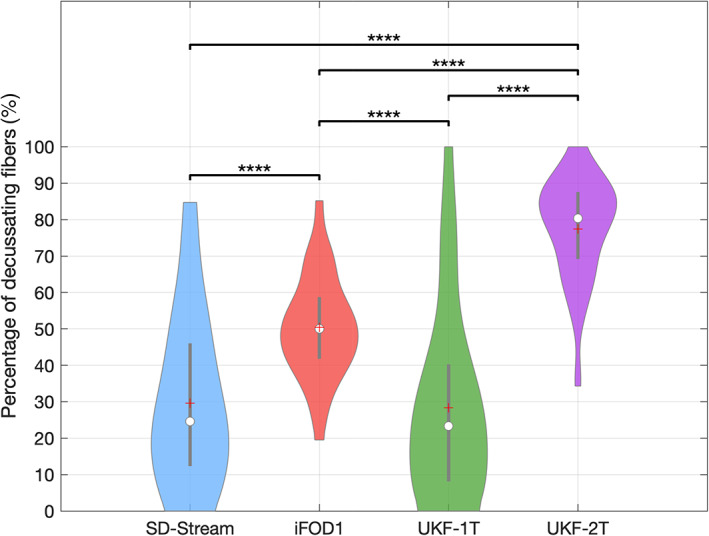
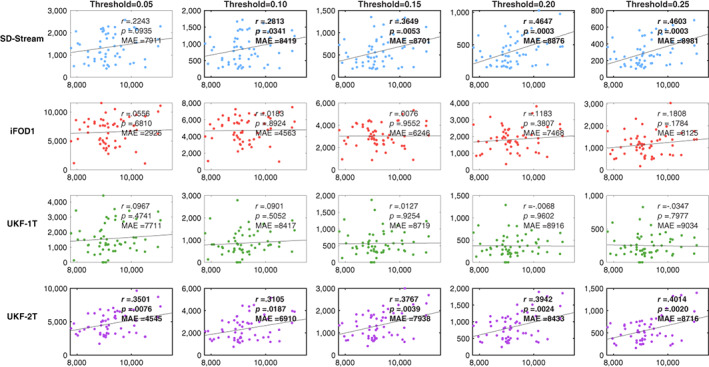
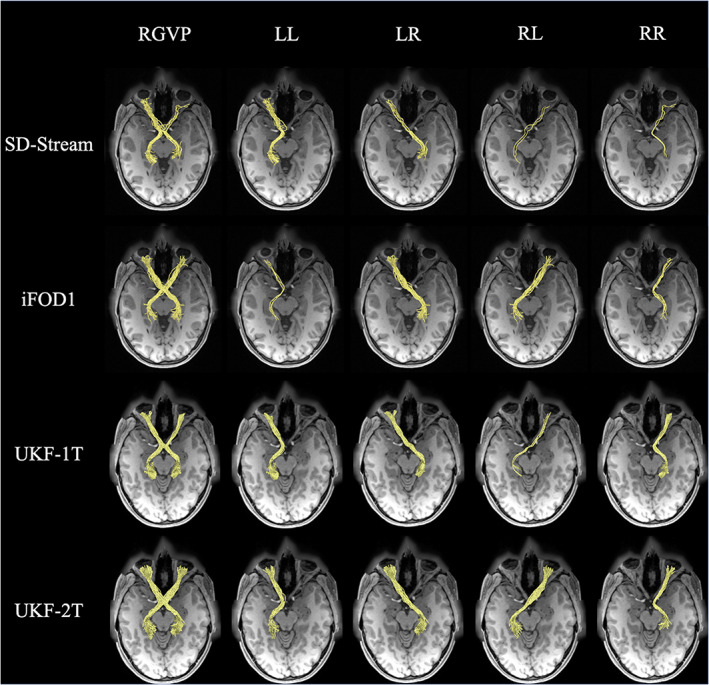
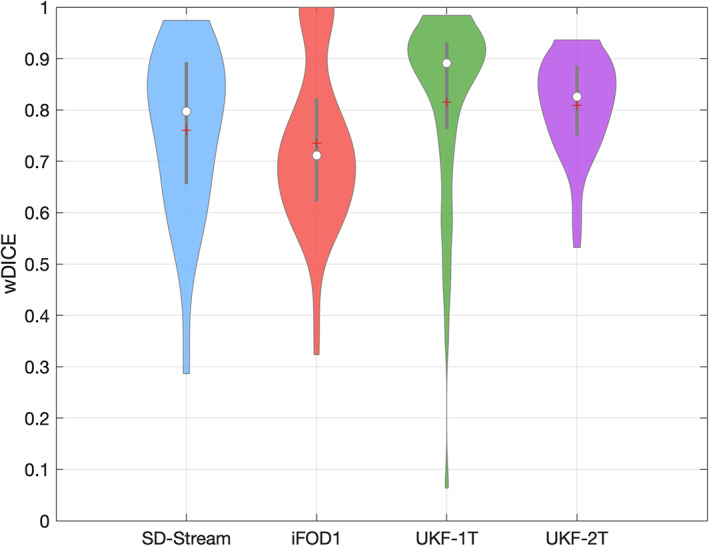
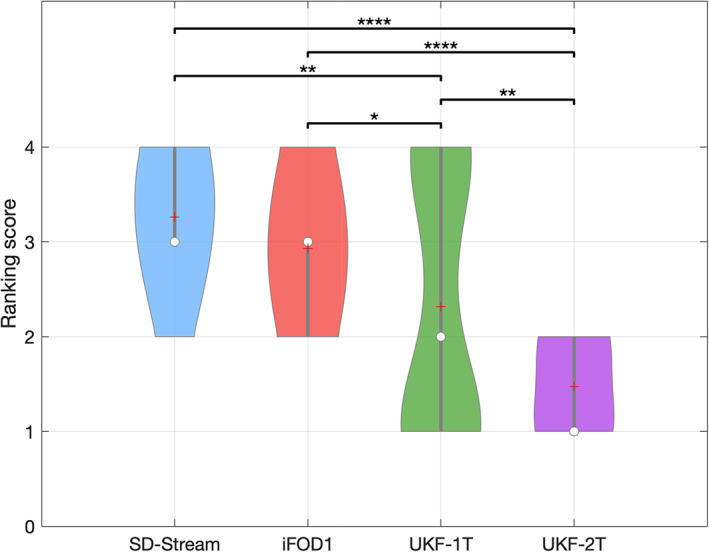
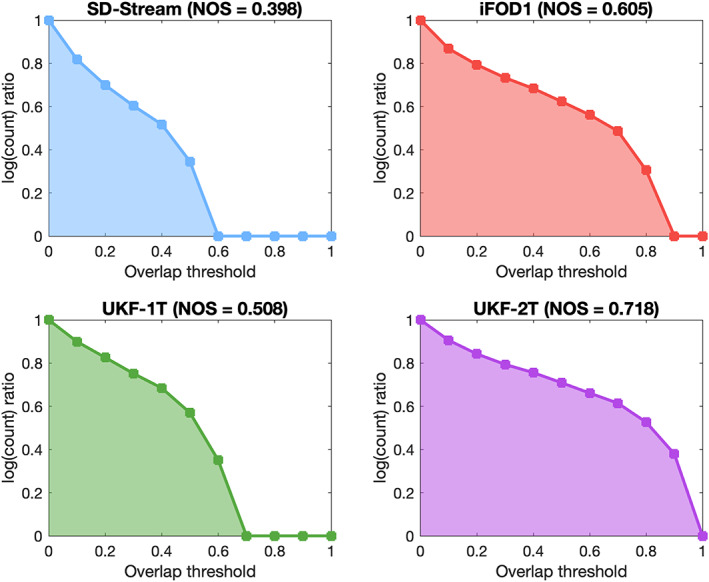
The retinogeniculate visual pathway (RGVP) conveys visual information from the retina to the lateral geniculate nucleus. The RGVP has four subdivisions, including two decussating and two nondecussating pathways that cannot be identified on conventional structural magnetic resonance imaging (MRI). Diffusion MRI tractography has the potential to trace these subdivisions and is increasingly used to study the RGVP. However, it is not yet known which fiber tracking strategy is most suitable for RGVP reconstruction. In this study, four tractography methods are compared, including constrained spherical deconvolution (CSD) based probabilistic (iFOD1) and deterministic (SD-Stream) methods, and multi-fiber (UKF-2T) and single-fiber (UKF-1T) unscented Kalman filter (UKF) methods. Experiments use diffusion MRI data from 57 subjects in the Human Connectome Project. The RGVP is identified using regions of interest created by two clinical experts. Quantitative anatomical measurements and expert anatomical judgment are used to assess the advantages and limitations of the four tractography methods. Overall, we conclude that UKF-2T and iFOD1 produce the best RGVP reconstruction results. The iFOD1 method can better quantitatively estimate the percentage of decussating fibers, while the UKF-2T method produces reconstructed RGVPs that are judged to better correspond to the known anatomy and have the highest spatial overlap across subjects. Overall, we find that it is challenging for current tractography methods to both accurately track RGVP fibers that correspond to known anatomy and produce an approximately correct percentage of decussating fibers. We suggest that future algorithm development for RGVP tractography should take consideration of both of these two points.
Keywords: cranial nerve; diffusion magnetic resonance imaging; human Connectome project; retinogeniculate visual pathway; tractography.
© 2021 The Authors. Human Brain Mapping published by Wiley Periodicals LLC.
Figures
Similar articles
-
Tractography-Based Automated Identification of Retinogeniculate Visual Pathway With Novel Microstructure-Informed Supervised Contrastive Learning.Hum Brain Mapp. 2024 Dec 1;45(17):e70071. doi: 10.1002/hbm.70071. Hum Brain Mapp. 2024. PMID: 39564727 Free PMC article.
-
Anatomical assessment of trigeminal nerve tractography using diffusion MRI: A comparison of acquisition b-values and single- and multi-fiber tracking strategies.Neuroimage Clin. 2020;25:102160. doi: 10.1016/j.nicl.2019.102160. Epub 2020 Jan 8. Neuroimage Clin. 2020. PMID: 31954337 Free PMC article.
-
Reconstructing the somatotopic organization of the corticospinal tract remains a challenge for modern tractography methods.Hum Brain Mapp. 2023 Dec 1;44(17):6055-6073. doi: 10.1002/hbm.26497. Epub 2023 Oct 4. Hum Brain Mapp. 2023. PMID: 37792280 Free PMC article.
-
Validation of an automated tractography method for the optic radiations as a biomarker of visual acuity in neurofibromatosis-associated optic pathway glioma.Exp Neurol. 2018 Jan;299(Pt B):308-316. doi: 10.1016/j.expneurol.2017.06.004. Epub 2017 Jun 3. Exp Neurol. 2018. PMID: 28587872 Review.
-
Tractography and the connectome in neurosurgical treatment of gliomas: the premise, the progress, and the potential.Neurosurg Focus. 2020 Feb 1;48(2):E6. doi: 10.3171/2019.11.FOCUS19785. Neurosurg Focus. 2020. PMID: 32006950 Free PMC article. Review.
Cited by
-
Tractometry of Human Visual White Matter Pathways in Health and Disease.Magn Reson Med Sci. 2024 Jul 1;23(3):316-340. doi: 10.2463/mrms.rev.2024-0007. Epub 2024 Jun 12. Magn Reson Med Sci. 2024. PMID: 38866532 Free PMC article. Review.
-
Computational approaches for the reconstruction of optic nerve fibers along the visual pathway from medical images: a comprehensive review.Front Neurosci. 2023 May 26;17:1191999. doi: 10.3389/fnins.2023.1191999. eCollection 2023. Front Neurosci. 2023. PMID: 37304011 Free PMC article. Review.
-
Multishell Diffusion MR Tractography Yields Morphological and Microstructural Information of the Anterior Optic Pathway: A Proof-of-Concept Study in Patients with Leber's Hereditary Optic Neuropathy.Int J Environ Res Public Health. 2022 Jun 5;19(11):6914. doi: 10.3390/ijerph19116914. Int J Environ Res Public Health. 2022. PMID: 35682499 Free PMC article.
-
Cerebello-Cerebral Pathways Contribute to Written Word Production.Neurobiol Lang (Camb). 2025 Aug 14;6:nol.a.10. doi: 10.1162/nol.a.10. eCollection 2025. Neurobiol Lang (Camb). 2025. PMID: 40860526 Free PMC article.
-
Quality and efficiency of a semi-automatic anatomy-based method for tractography of associative white matter fascicles in brain tumor patients, a case series.Neurosurg Rev. 2025 Mar 26;48(1):326. doi: 10.1007/s10143-025-03488-z. Neurosurg Rev. 2025. PMID: 40138086
References
-
- Alexander, A. L. , Hasan, K. M. , Lazar, M. , Tsuruda, J. S. , & Parker, D. L. (2001). Analysis of partial volume effects in diffusion‐tensor MRI. Magnetic Resonance in Medicine: An Official Journal of the International Society for Magnetic Resonance in Medicine, 45(5), 770–780. - PubMed
-
- Alexander, D. C. (2005). Multiple‐fiber reconstruction algorithms for diffusion MRI. Annals of the New York Academy of Sciences, 1064, 113–133. - PubMed
-
- Allen, B. , Schmitt, M. A. , Kushner, B. J. , & Rokers, B. (2018). Retinothalamic White Matter abnormalities in amblyopia. Investigative Ophthalmology & Visual Science, 59(2), 921–929. - PubMed
-
- Altıntaş, Ö. , Gümüştaş, S. , Cinik, R. , Anık, Y. , Özkan, B. , & Karabaş, L. (2017). Correlation of the measurements of optical coherence tomography and diffuse tension imaging of optic pathways in amblyopia. International Ophthalmology, 37(1), 85–93. - PubMed
-
- Aquilina, K. , Daniels, D. J. , Spoudeas, H. , Phipps, K. , Gan, H.‐W. , & Boop, F. A. (2015). Optic pathway glioma in children: Does visual deficit correlate with radiology in focal exophytic lesions? Child's Nervous System: ChNS: Official Journal of the International Society for Pediatric Neurosurgery, 31(11), 2041–2049. - PubMed
Publication types
MeSH terms
Grants and funding
LinkOut - more resources
Full Text Sources
Other Literature Sources
