. 2021 Jun 1;125(6):2408-2431.
doi: 10.1152/jn.00591.2020. Epub 2021 May 12.

Inferring thalamocortical monosynaptic connectivity in vivo

Affiliations

Inferring thalamocortical monosynaptic connectivity in vivo

Yi Juin Liew et al. J Neurophysiol. .

Abstract

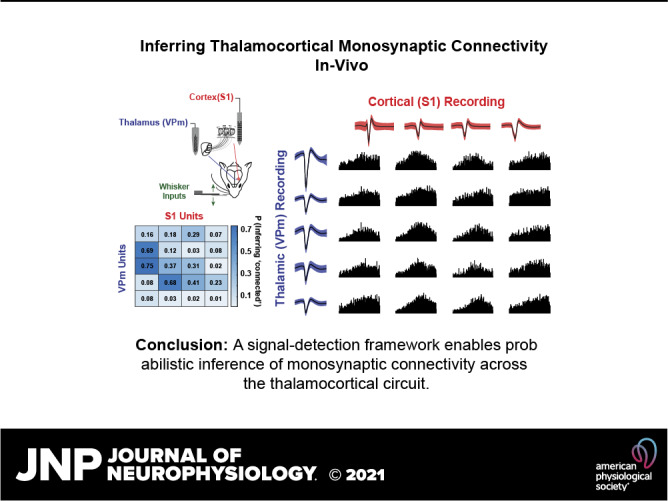
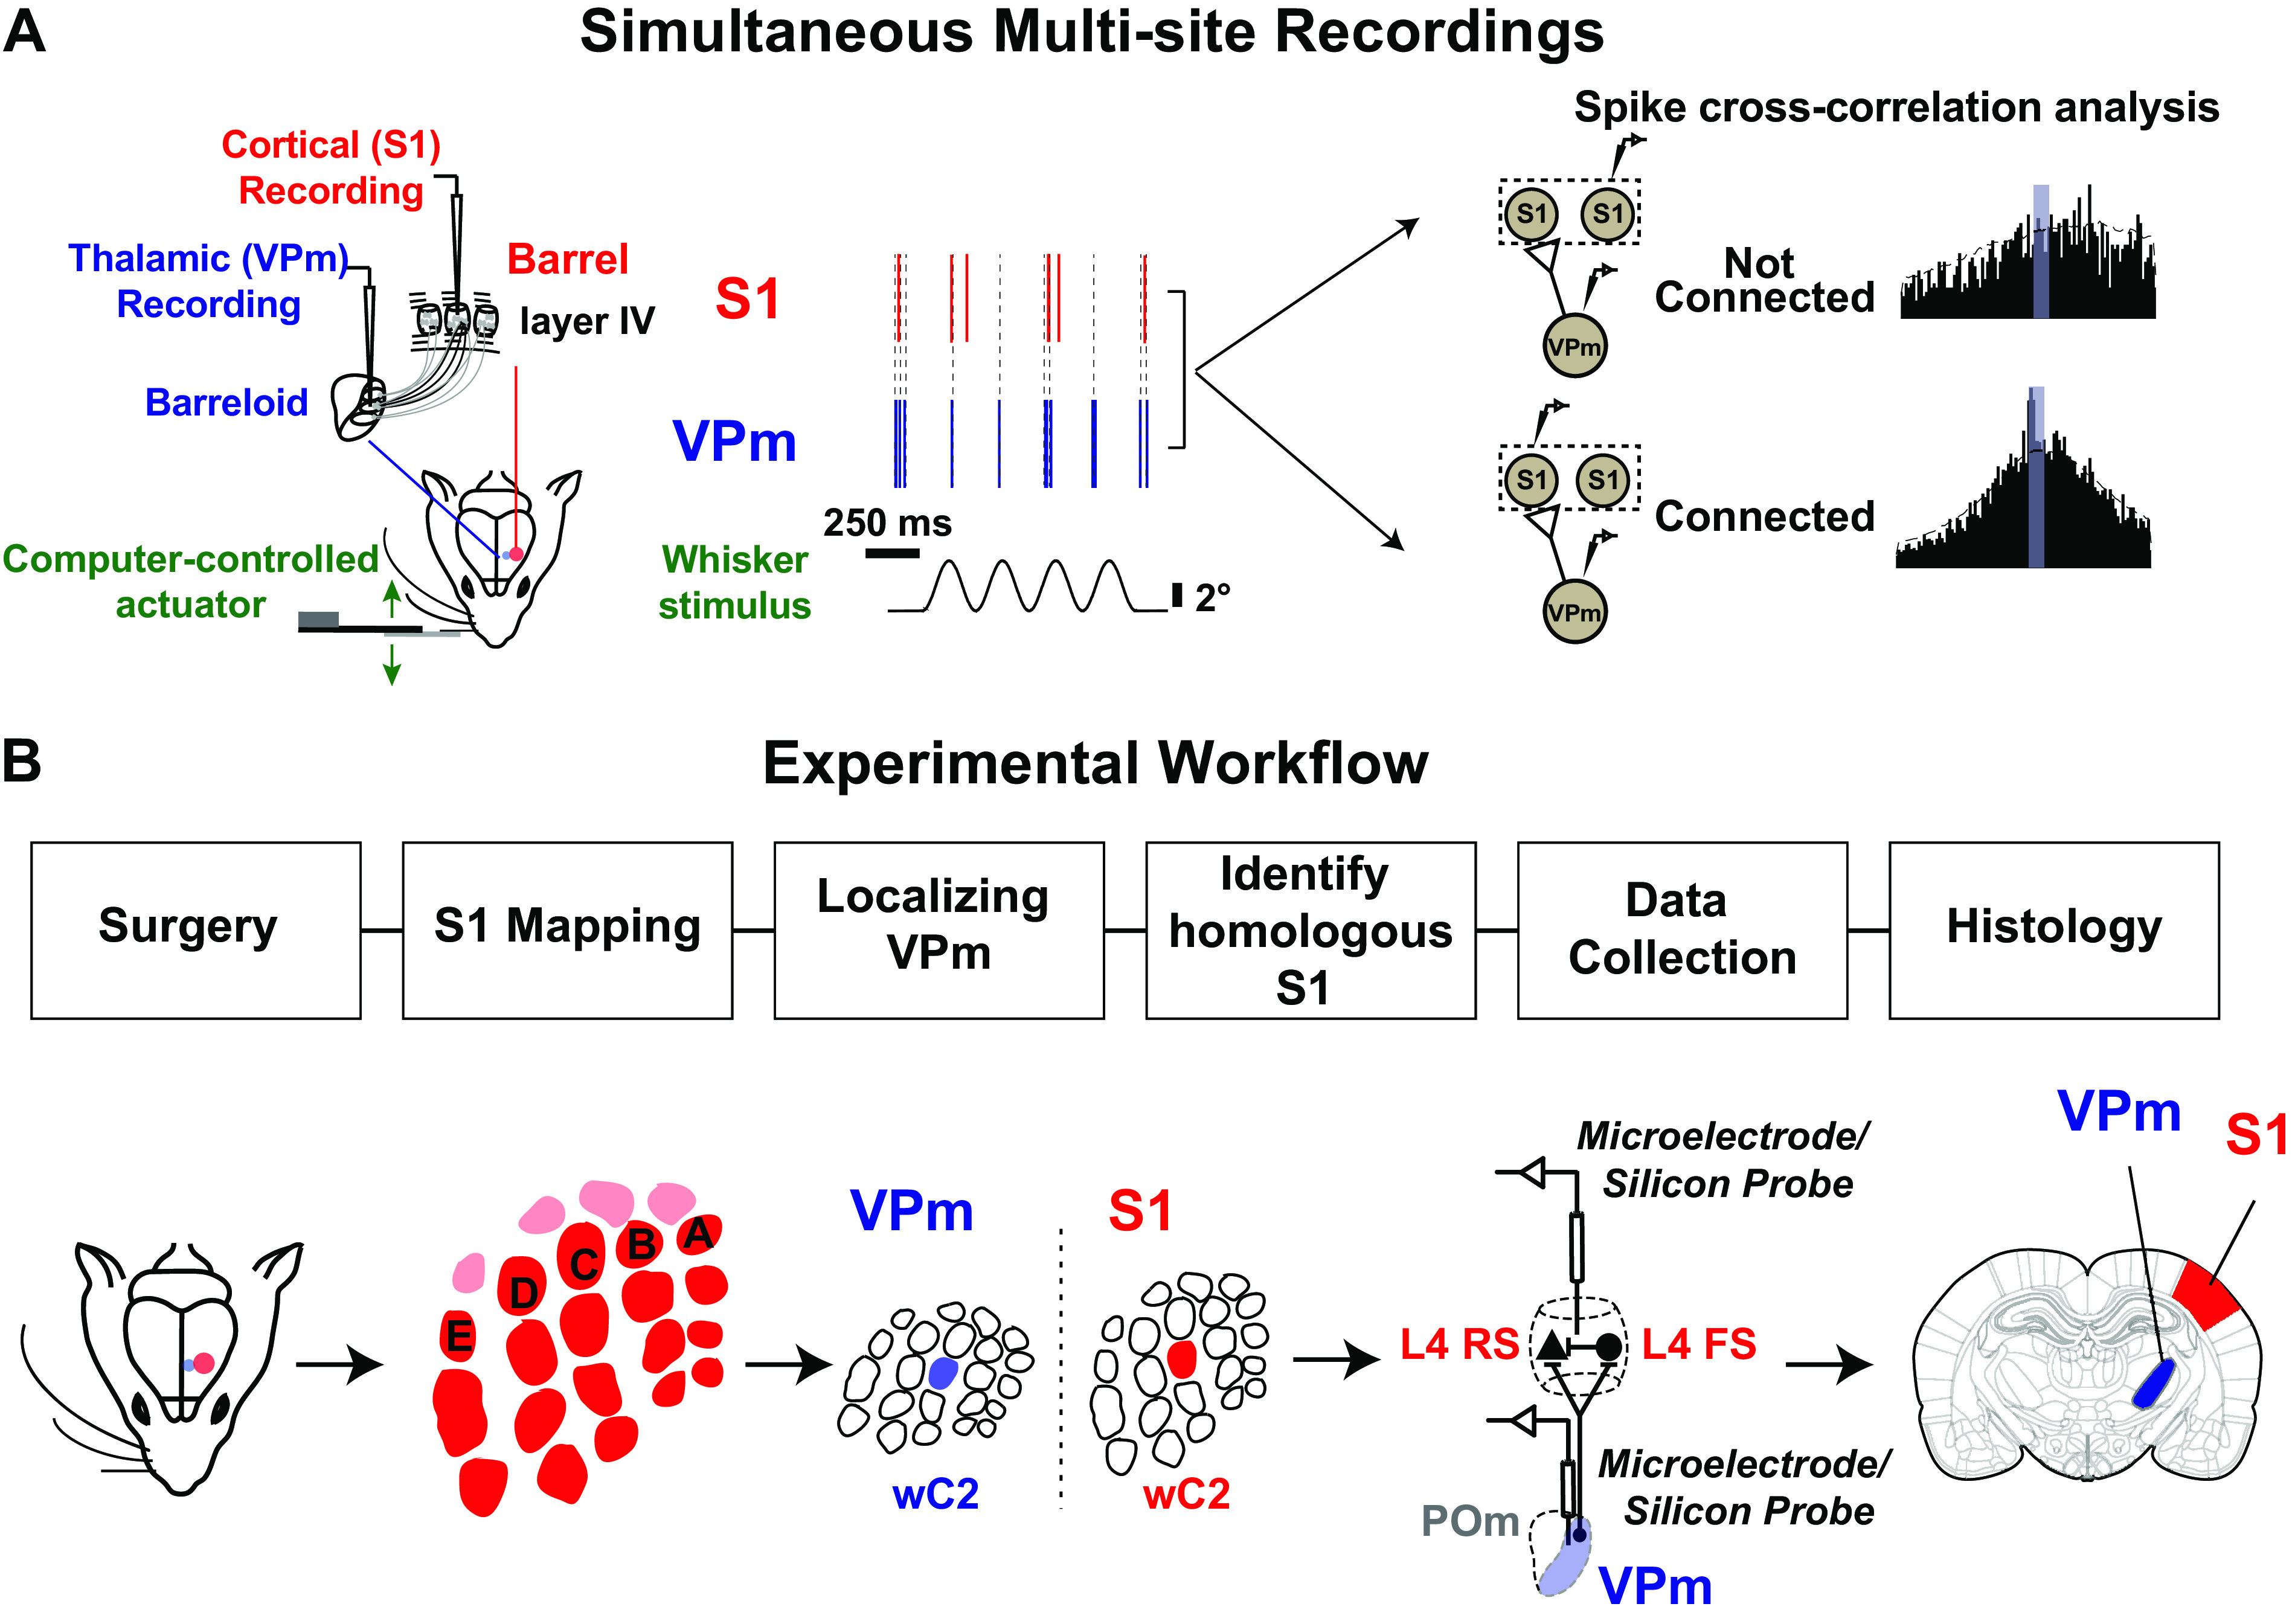
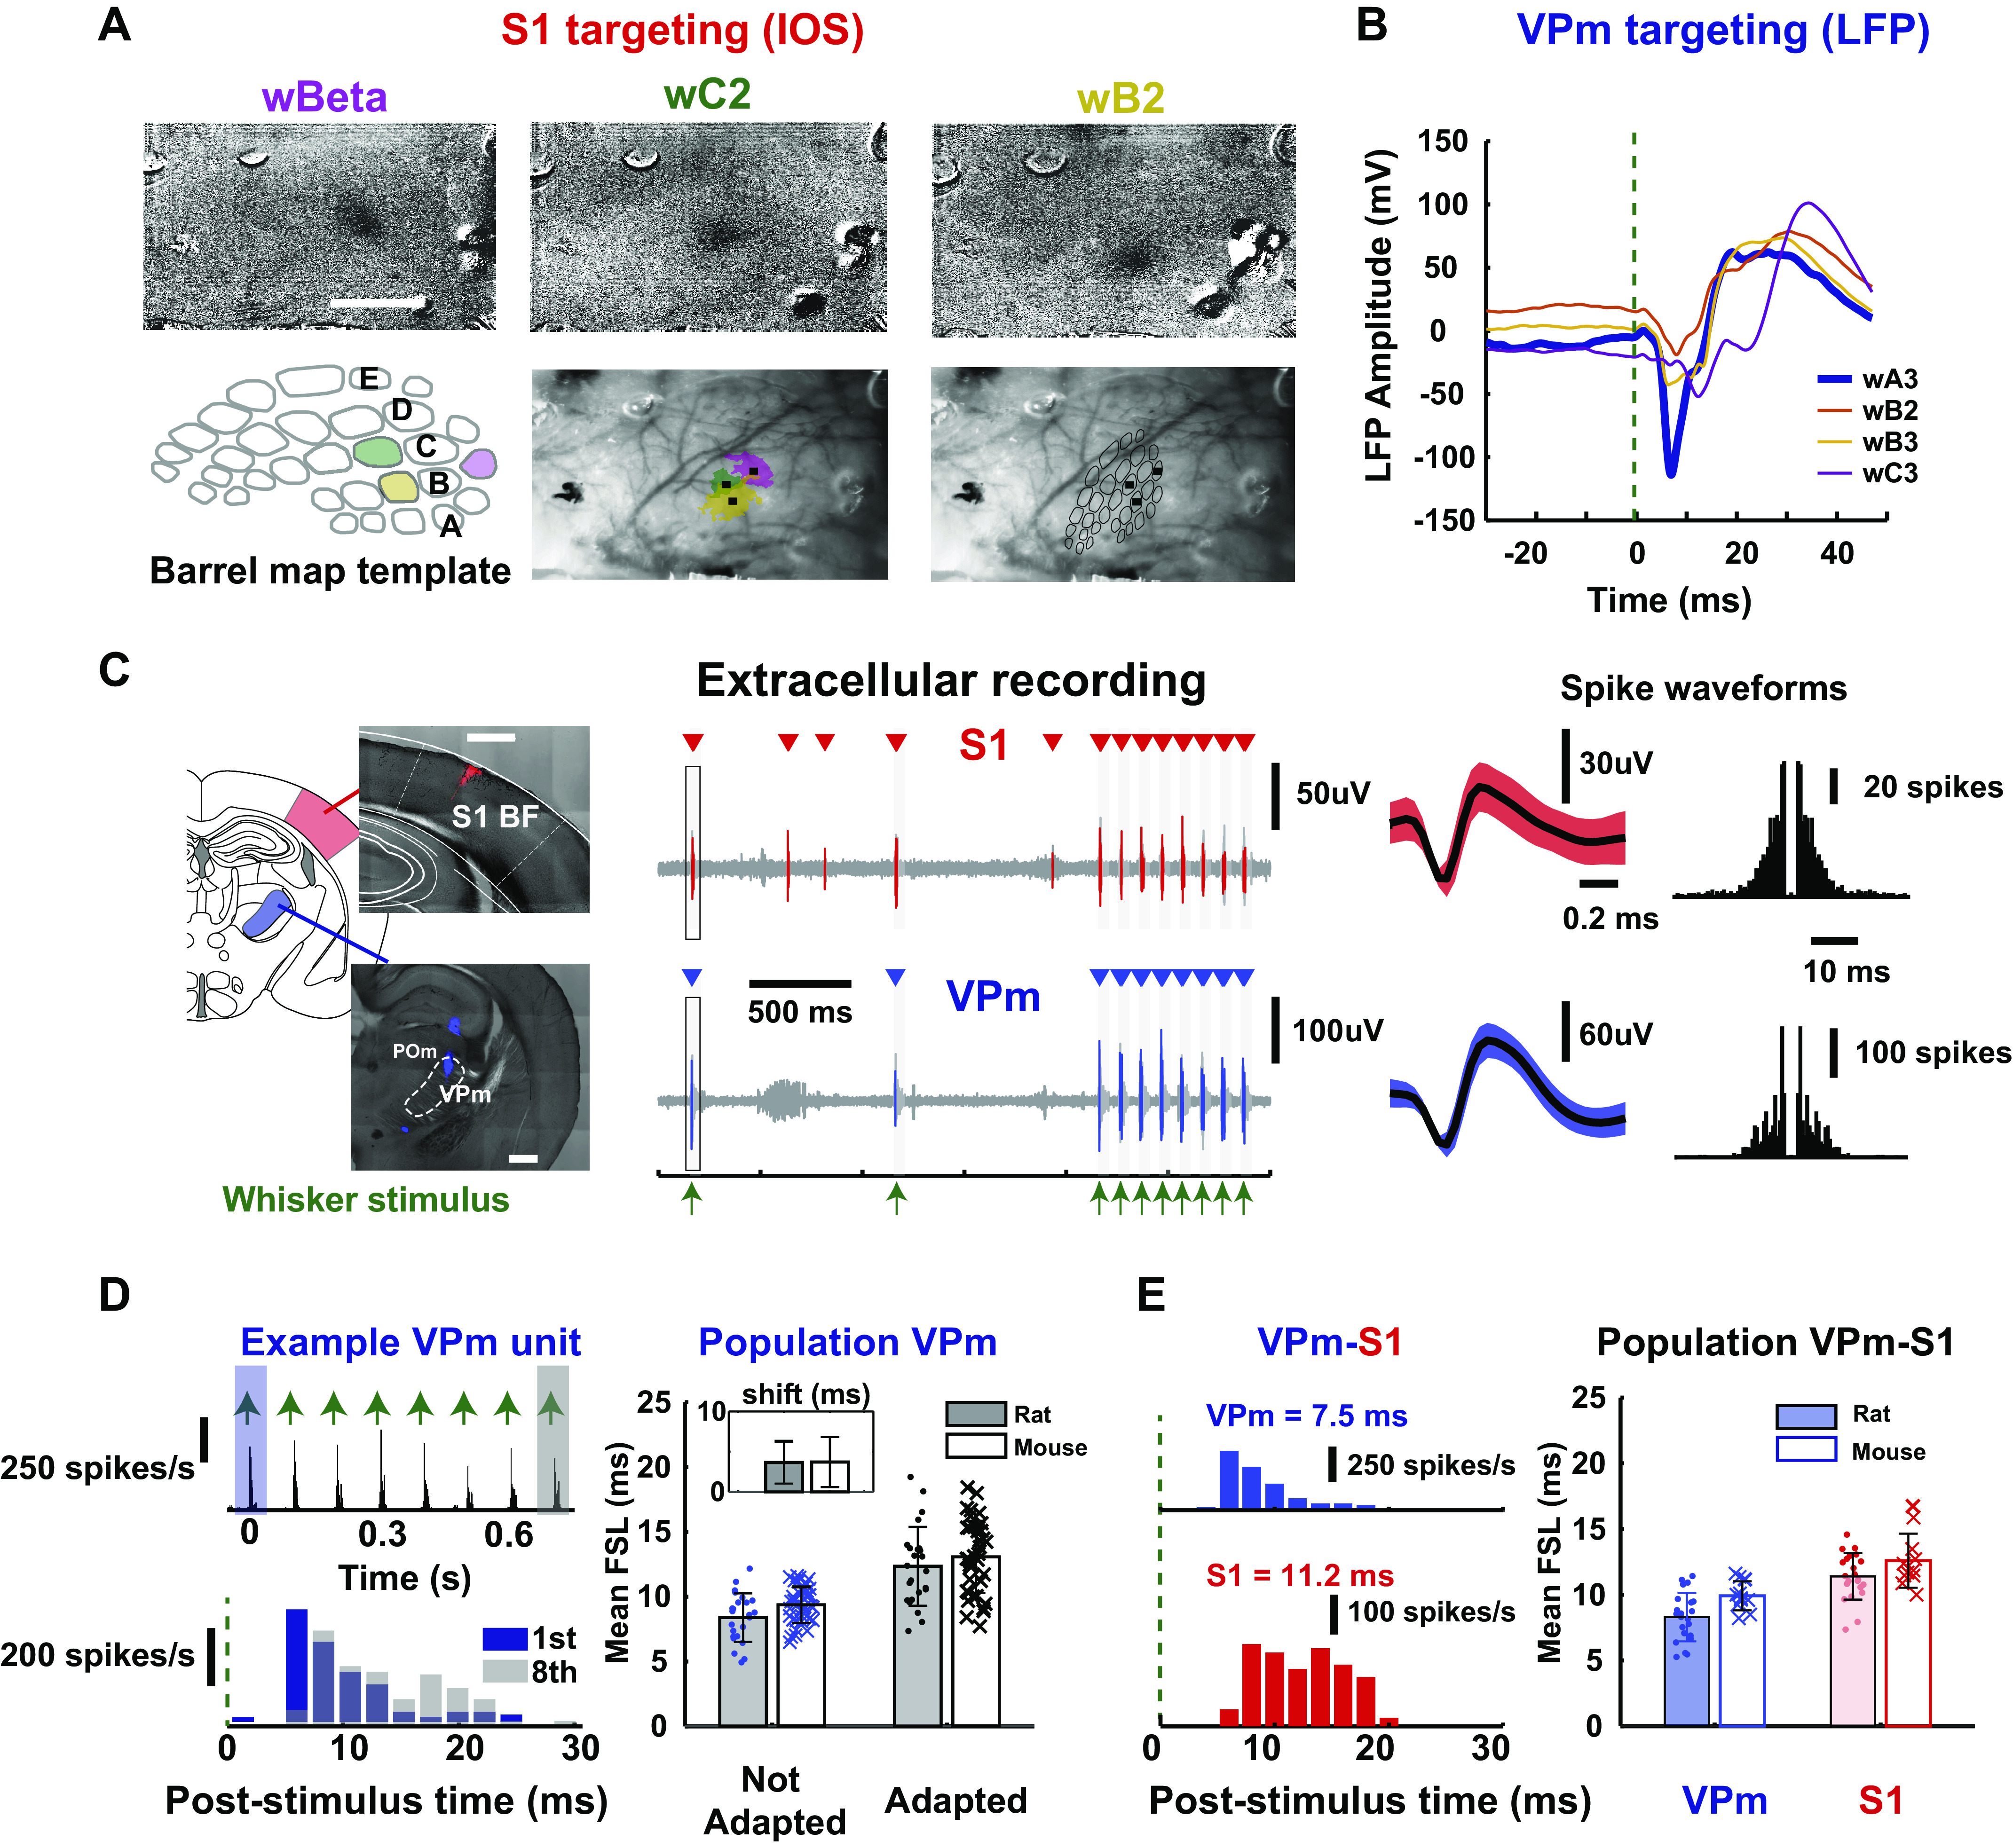
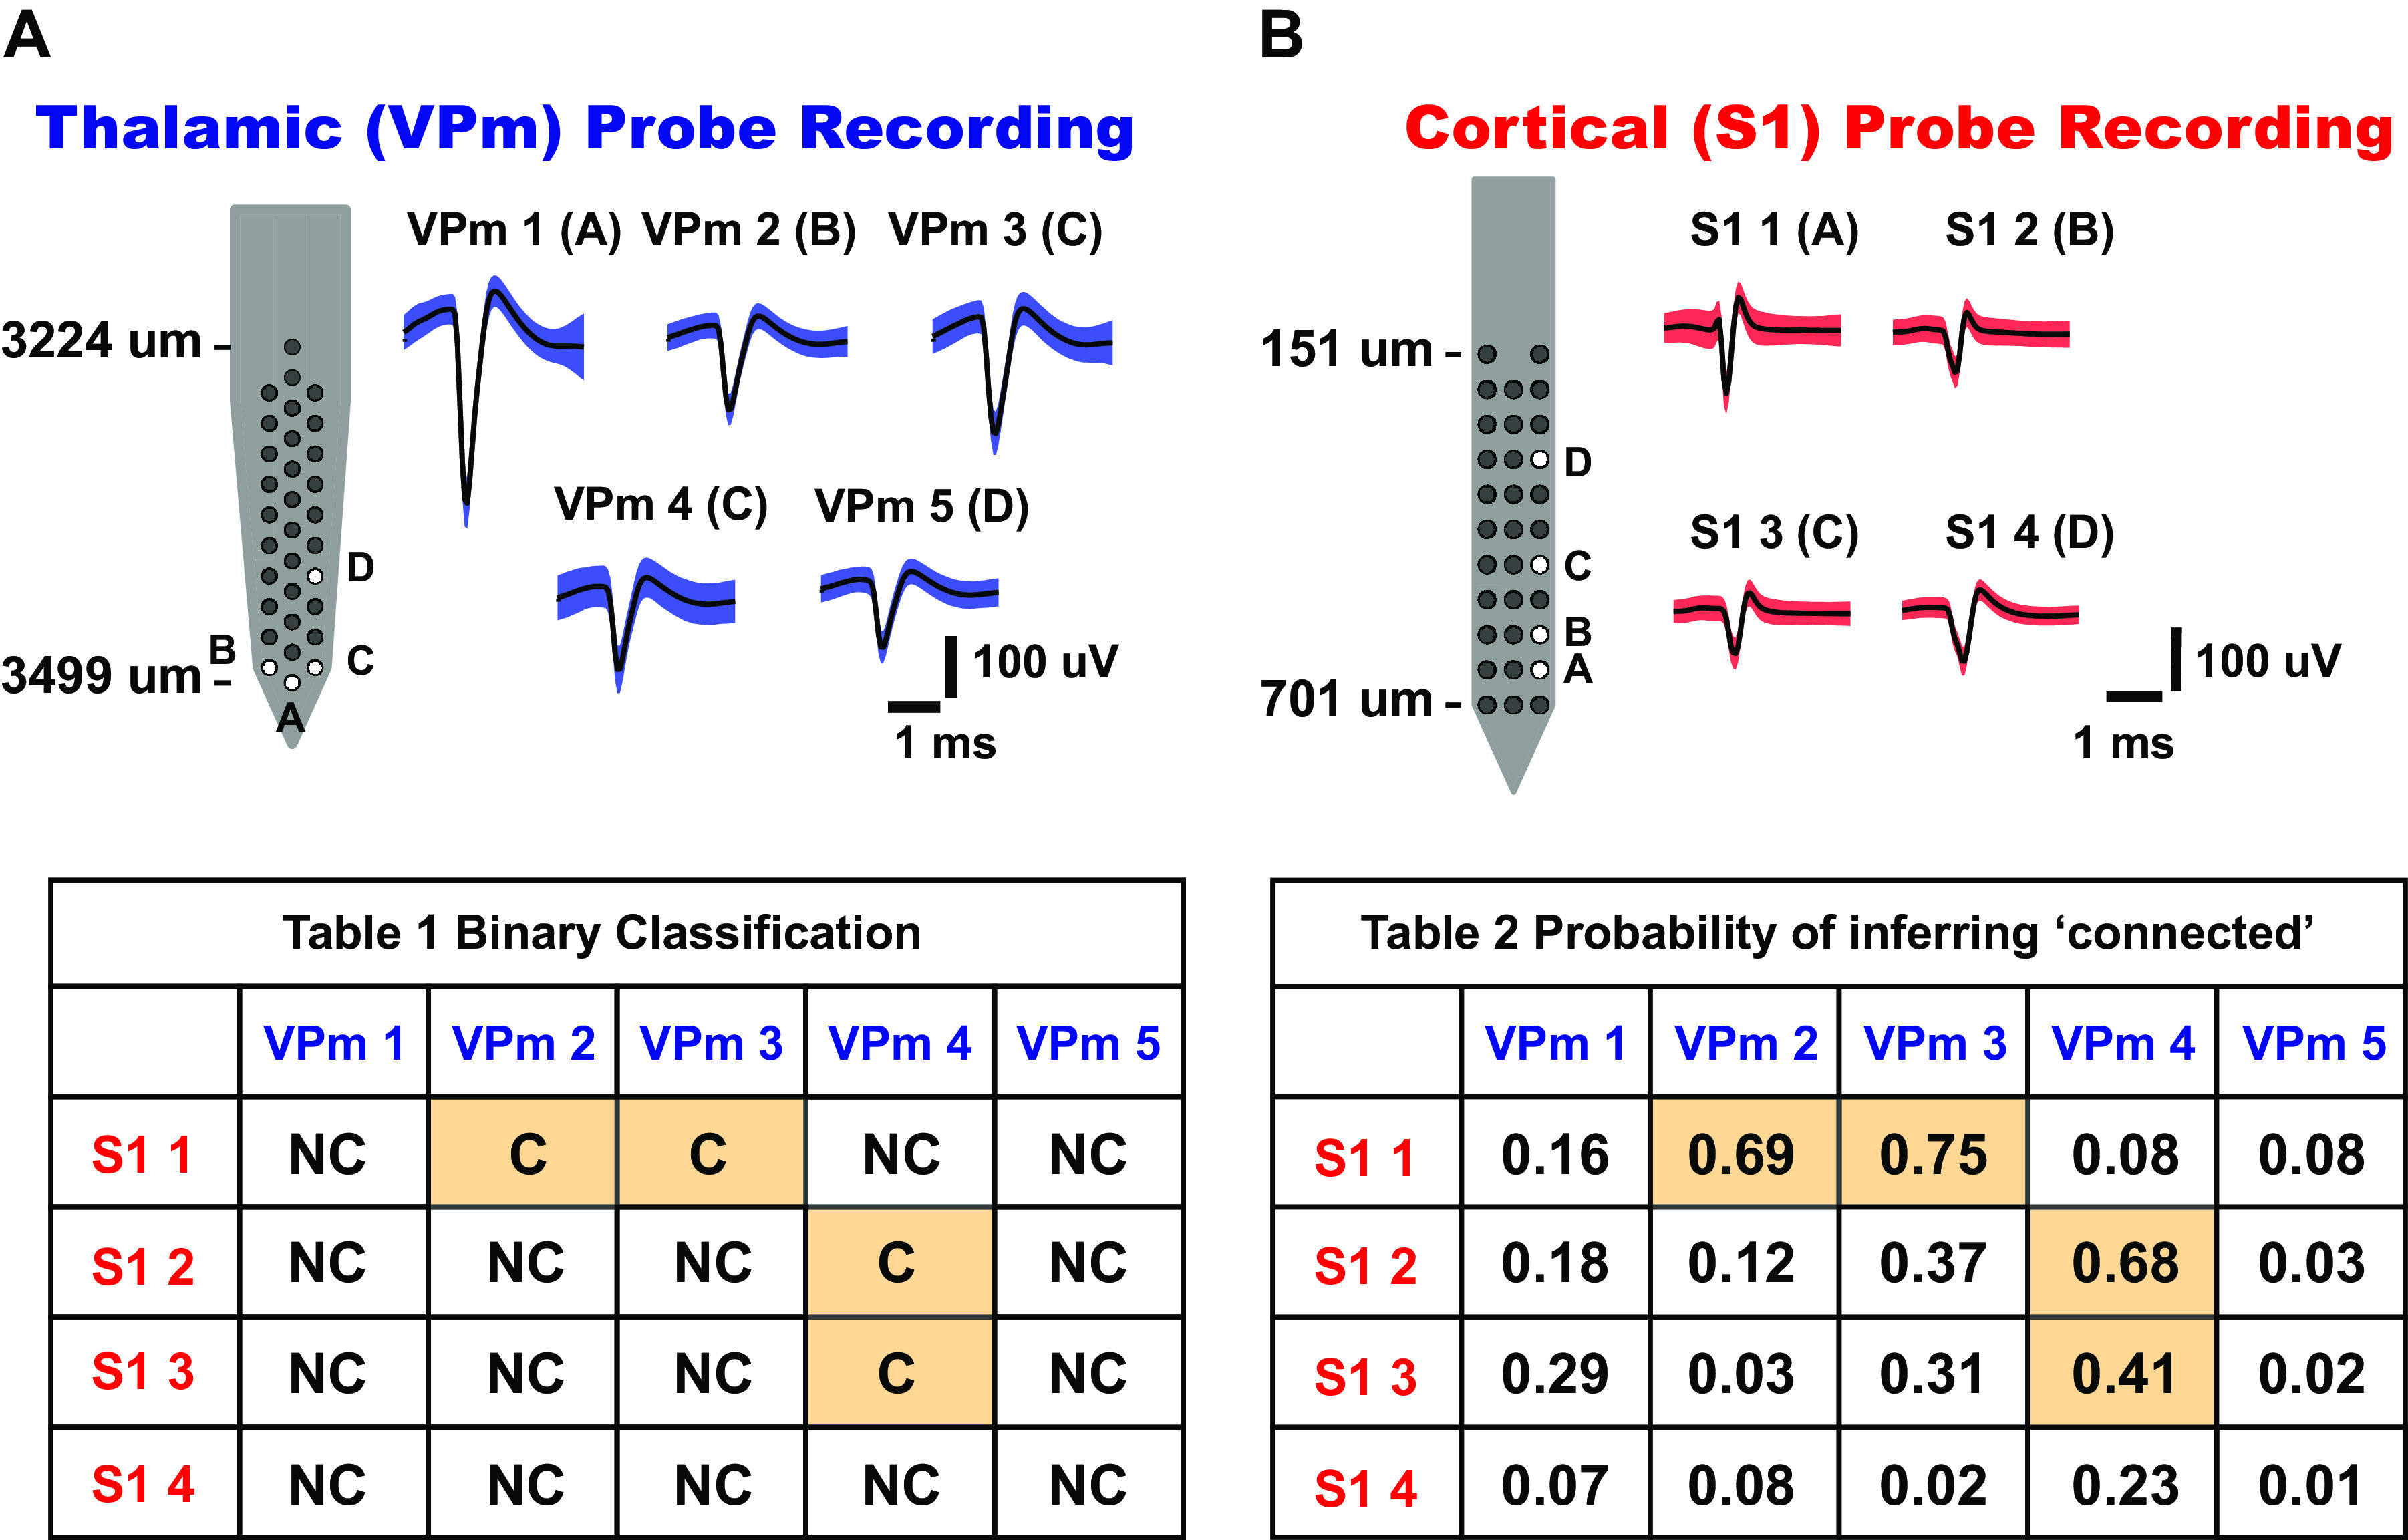
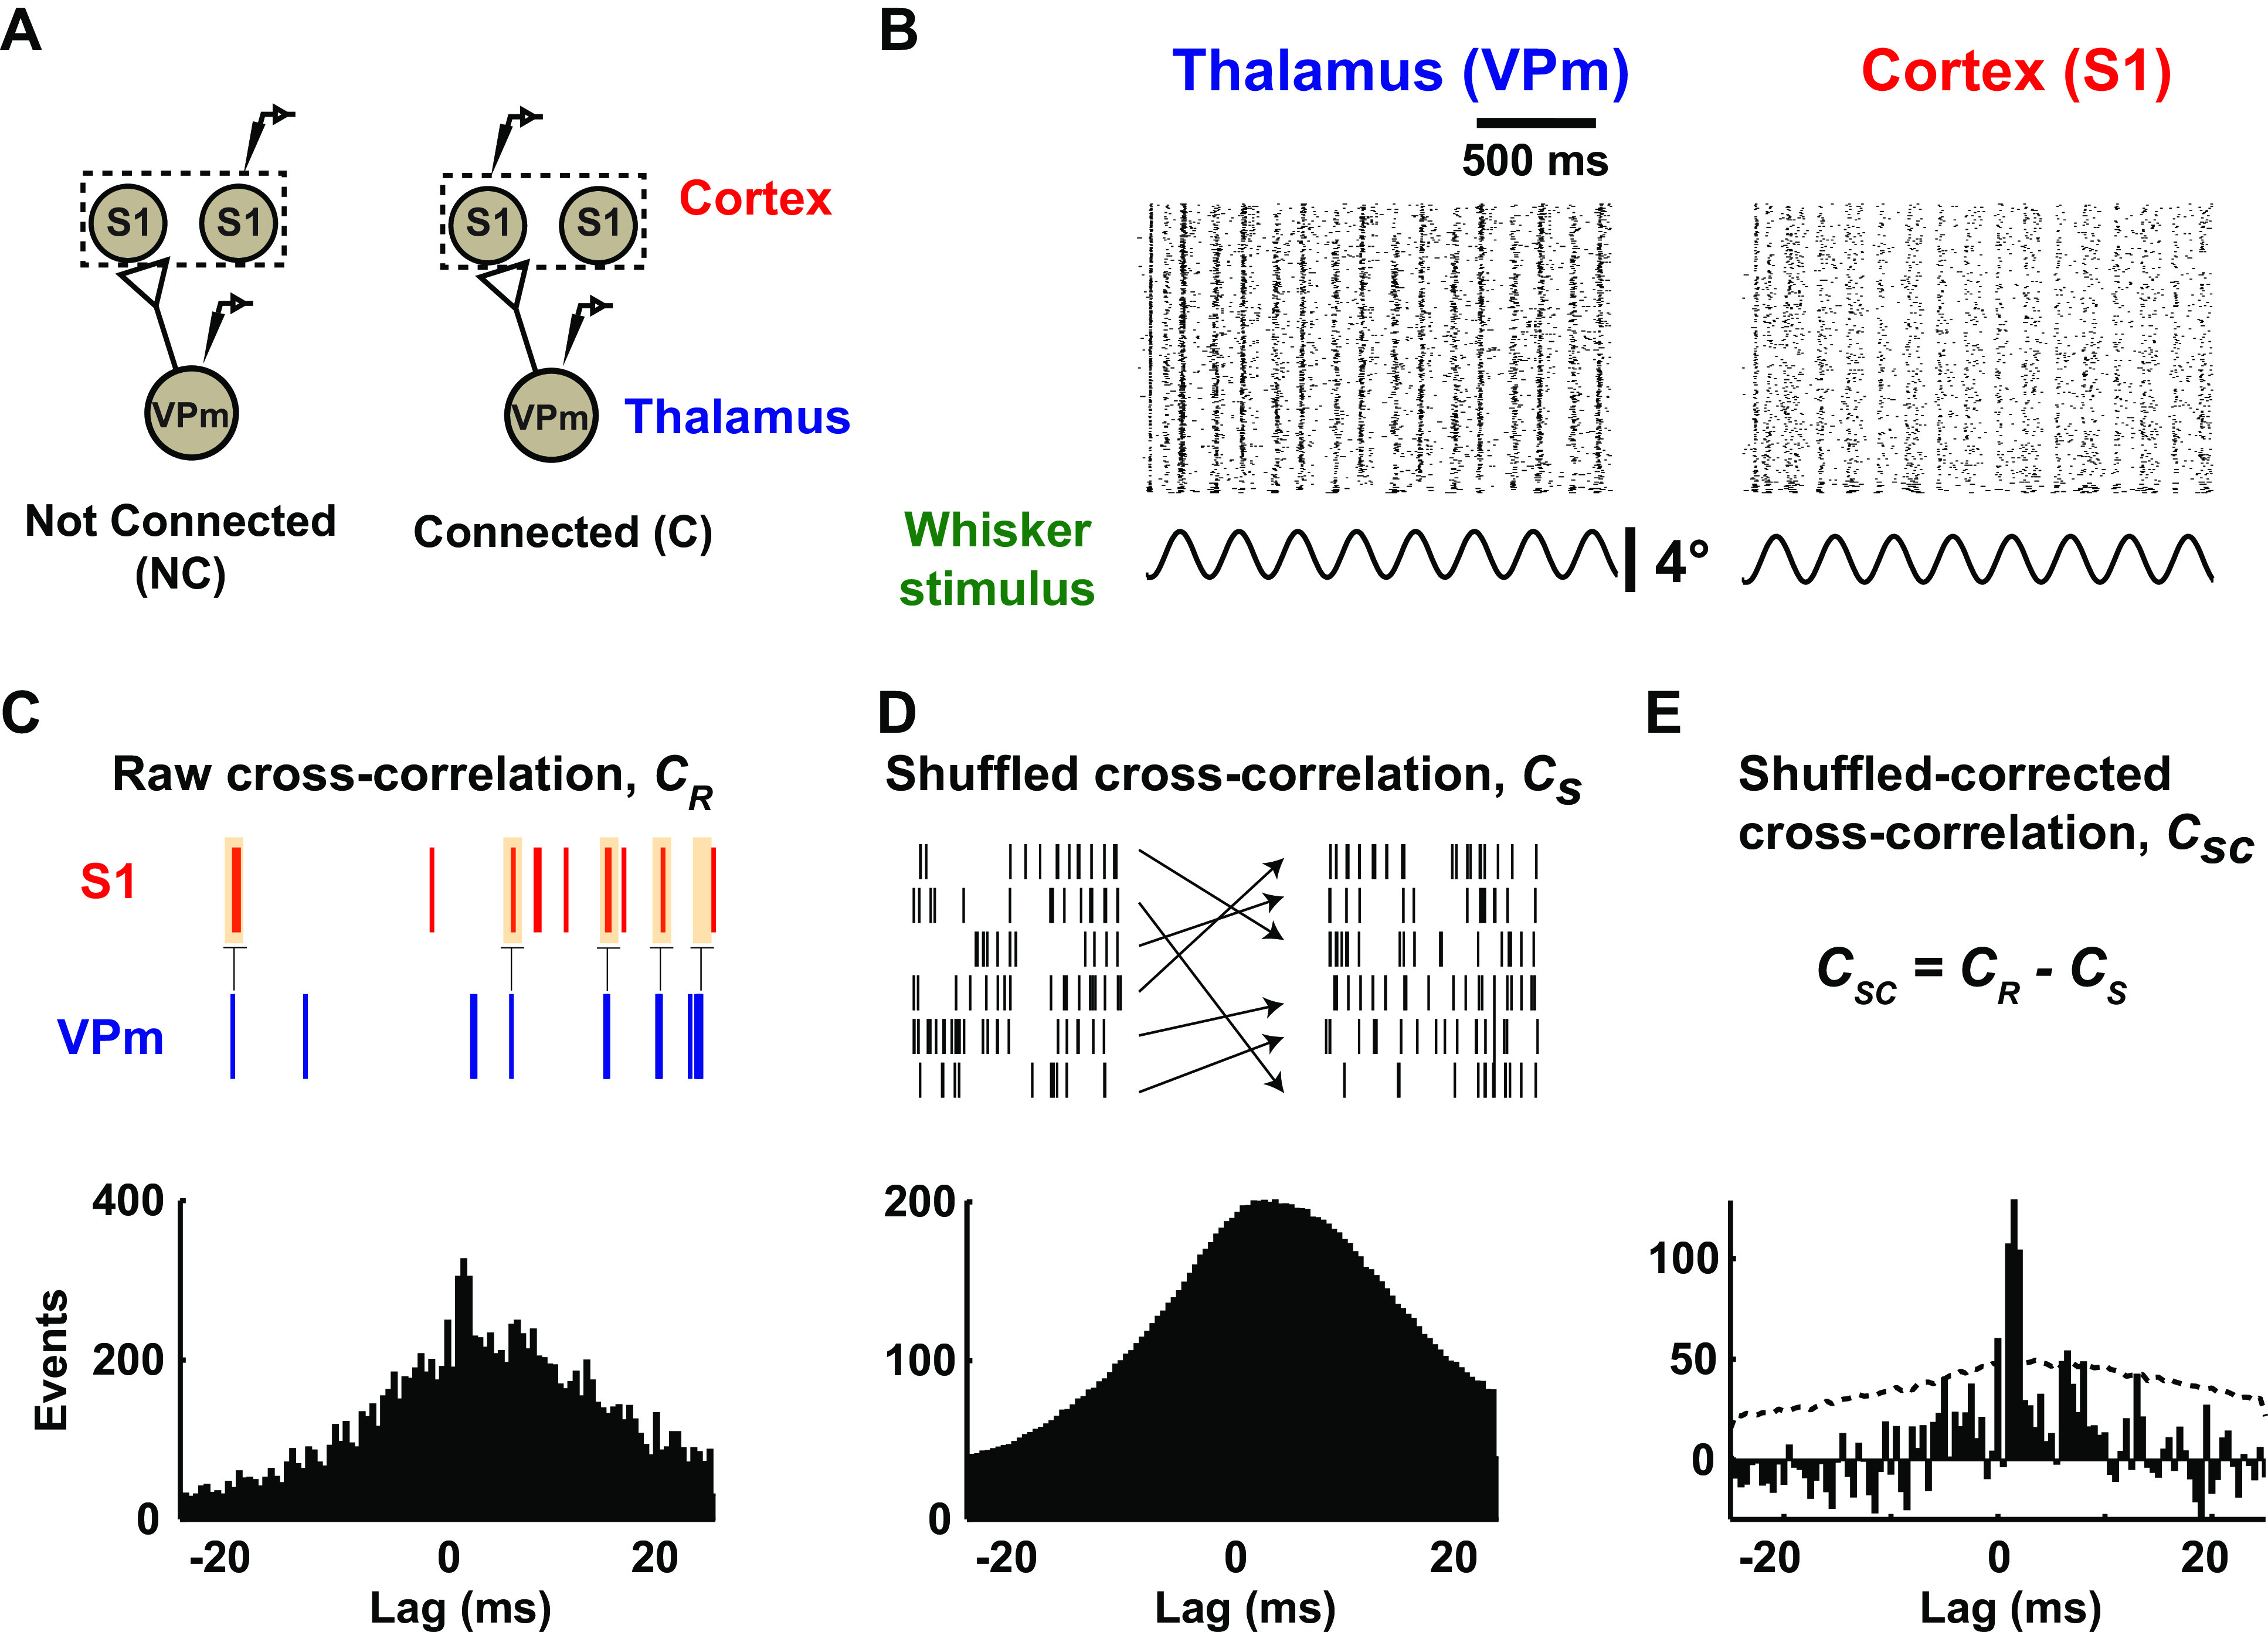
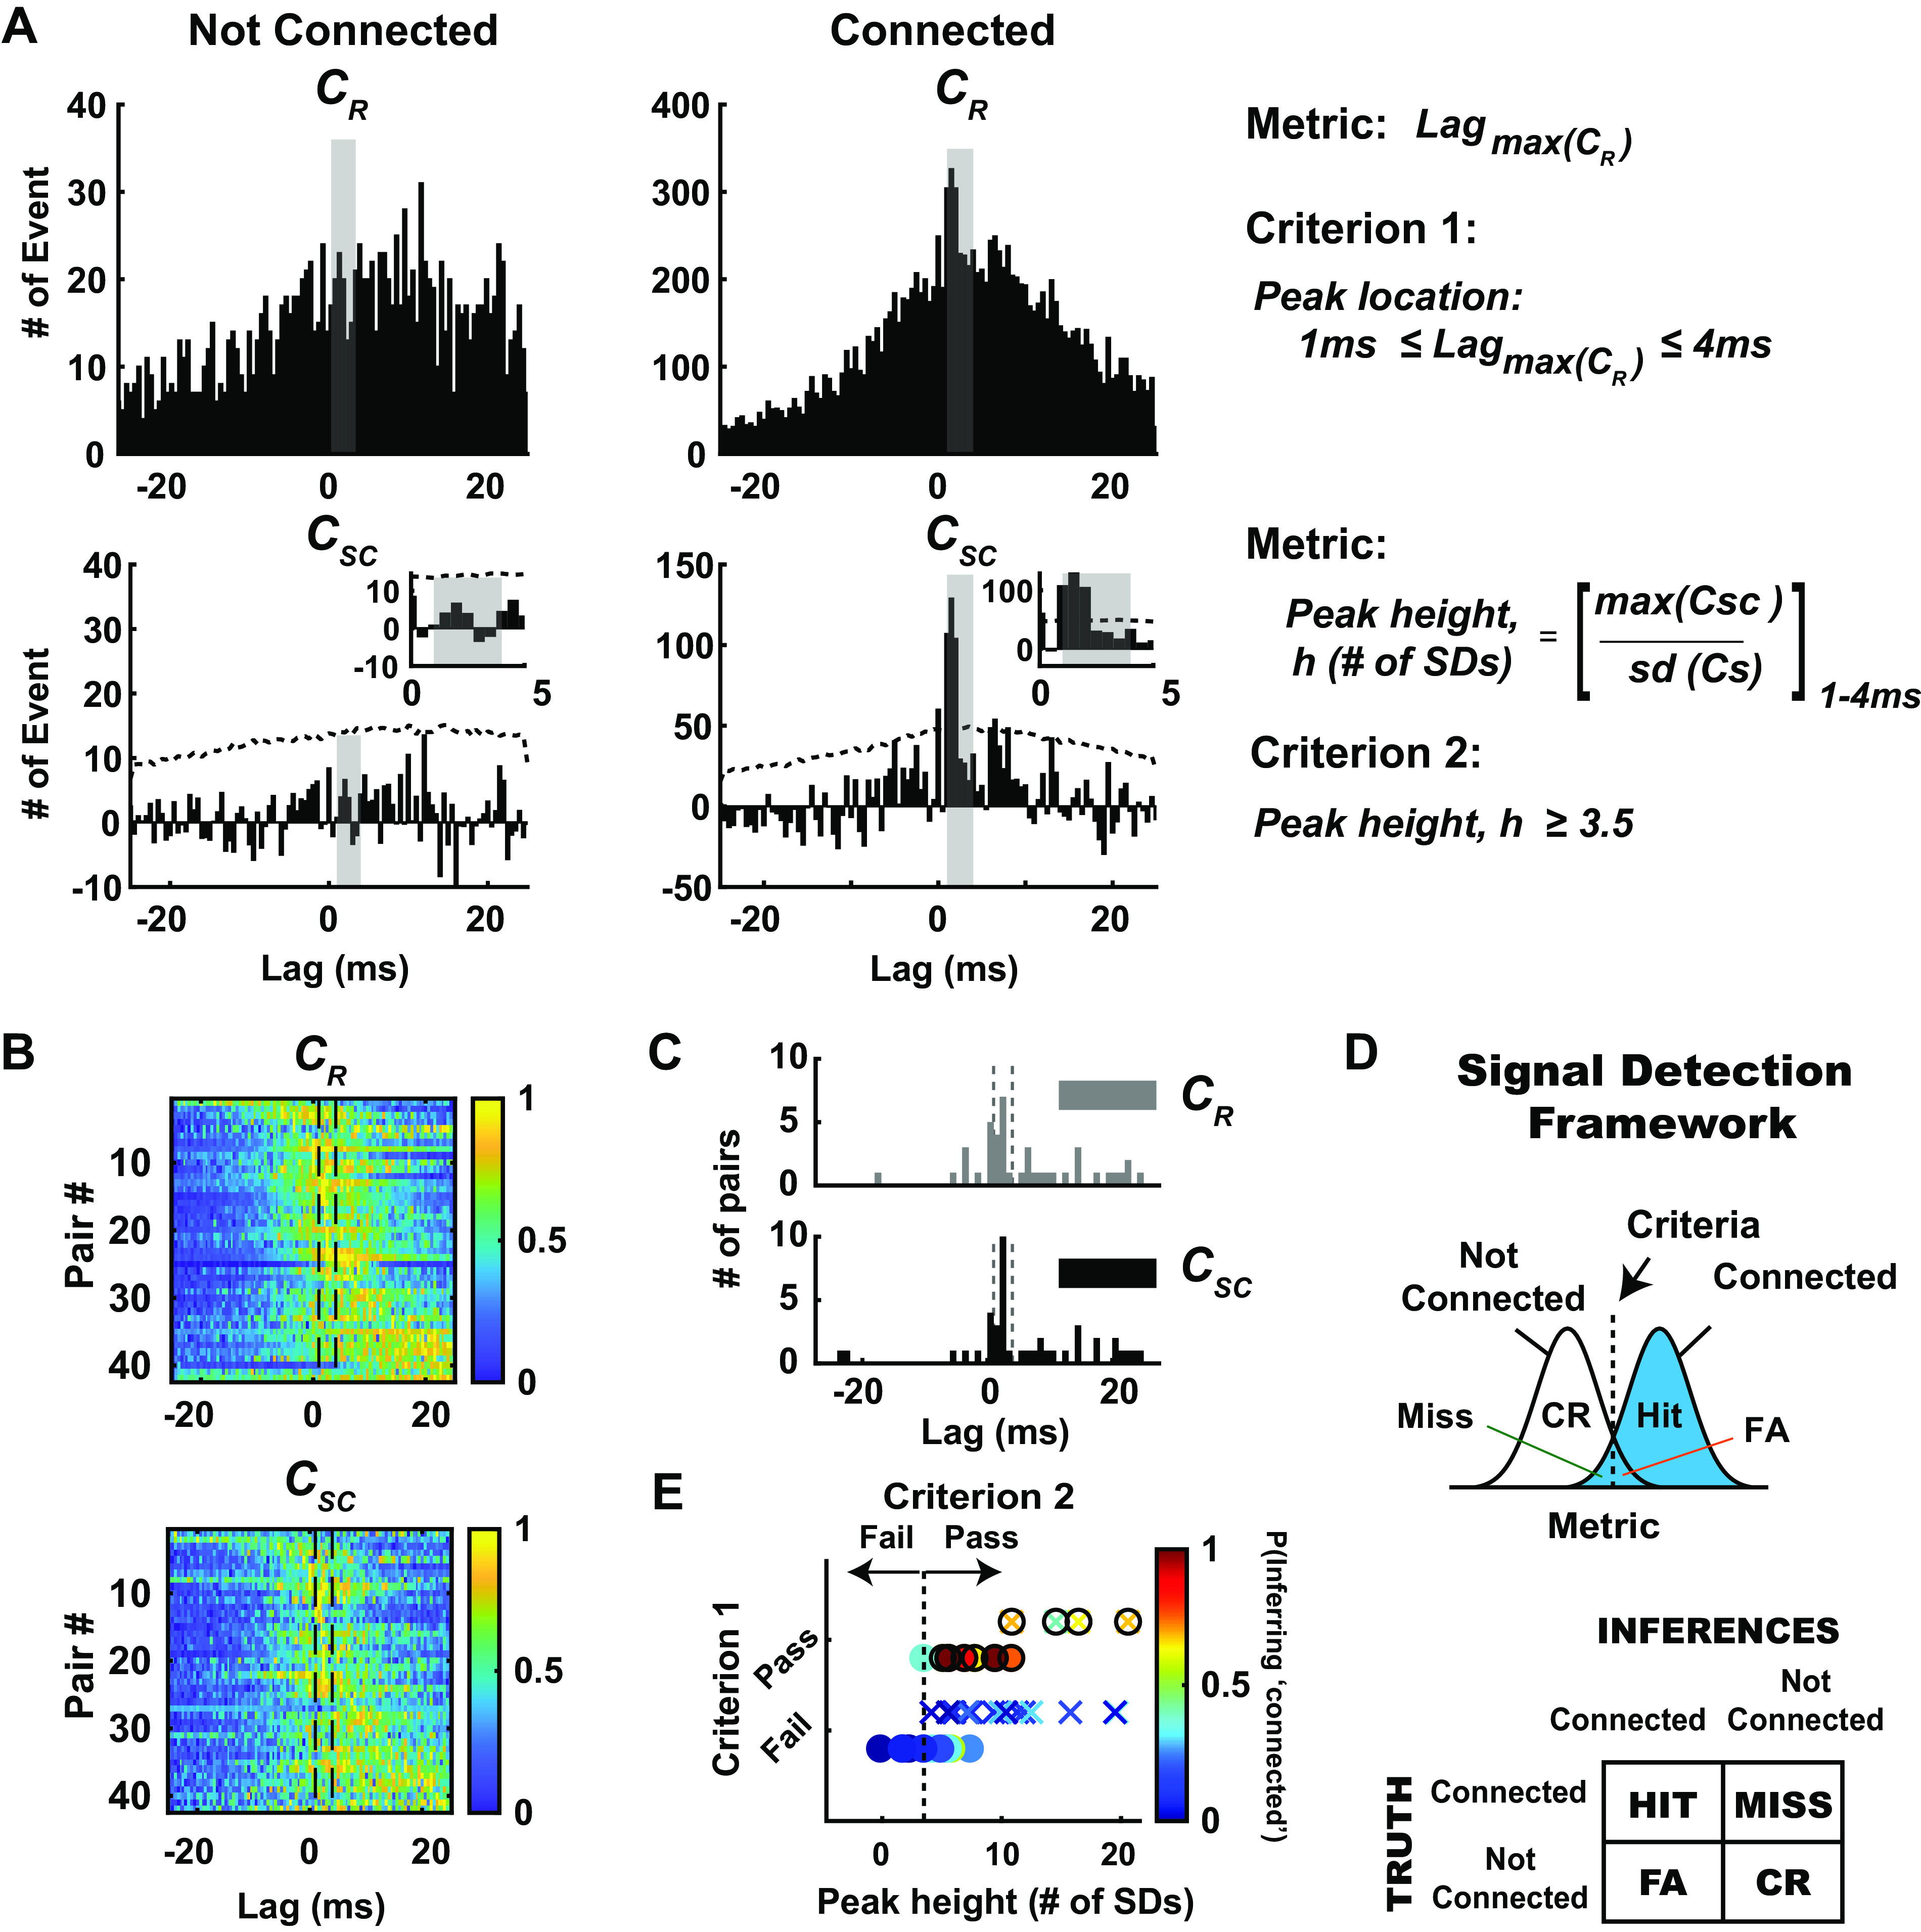
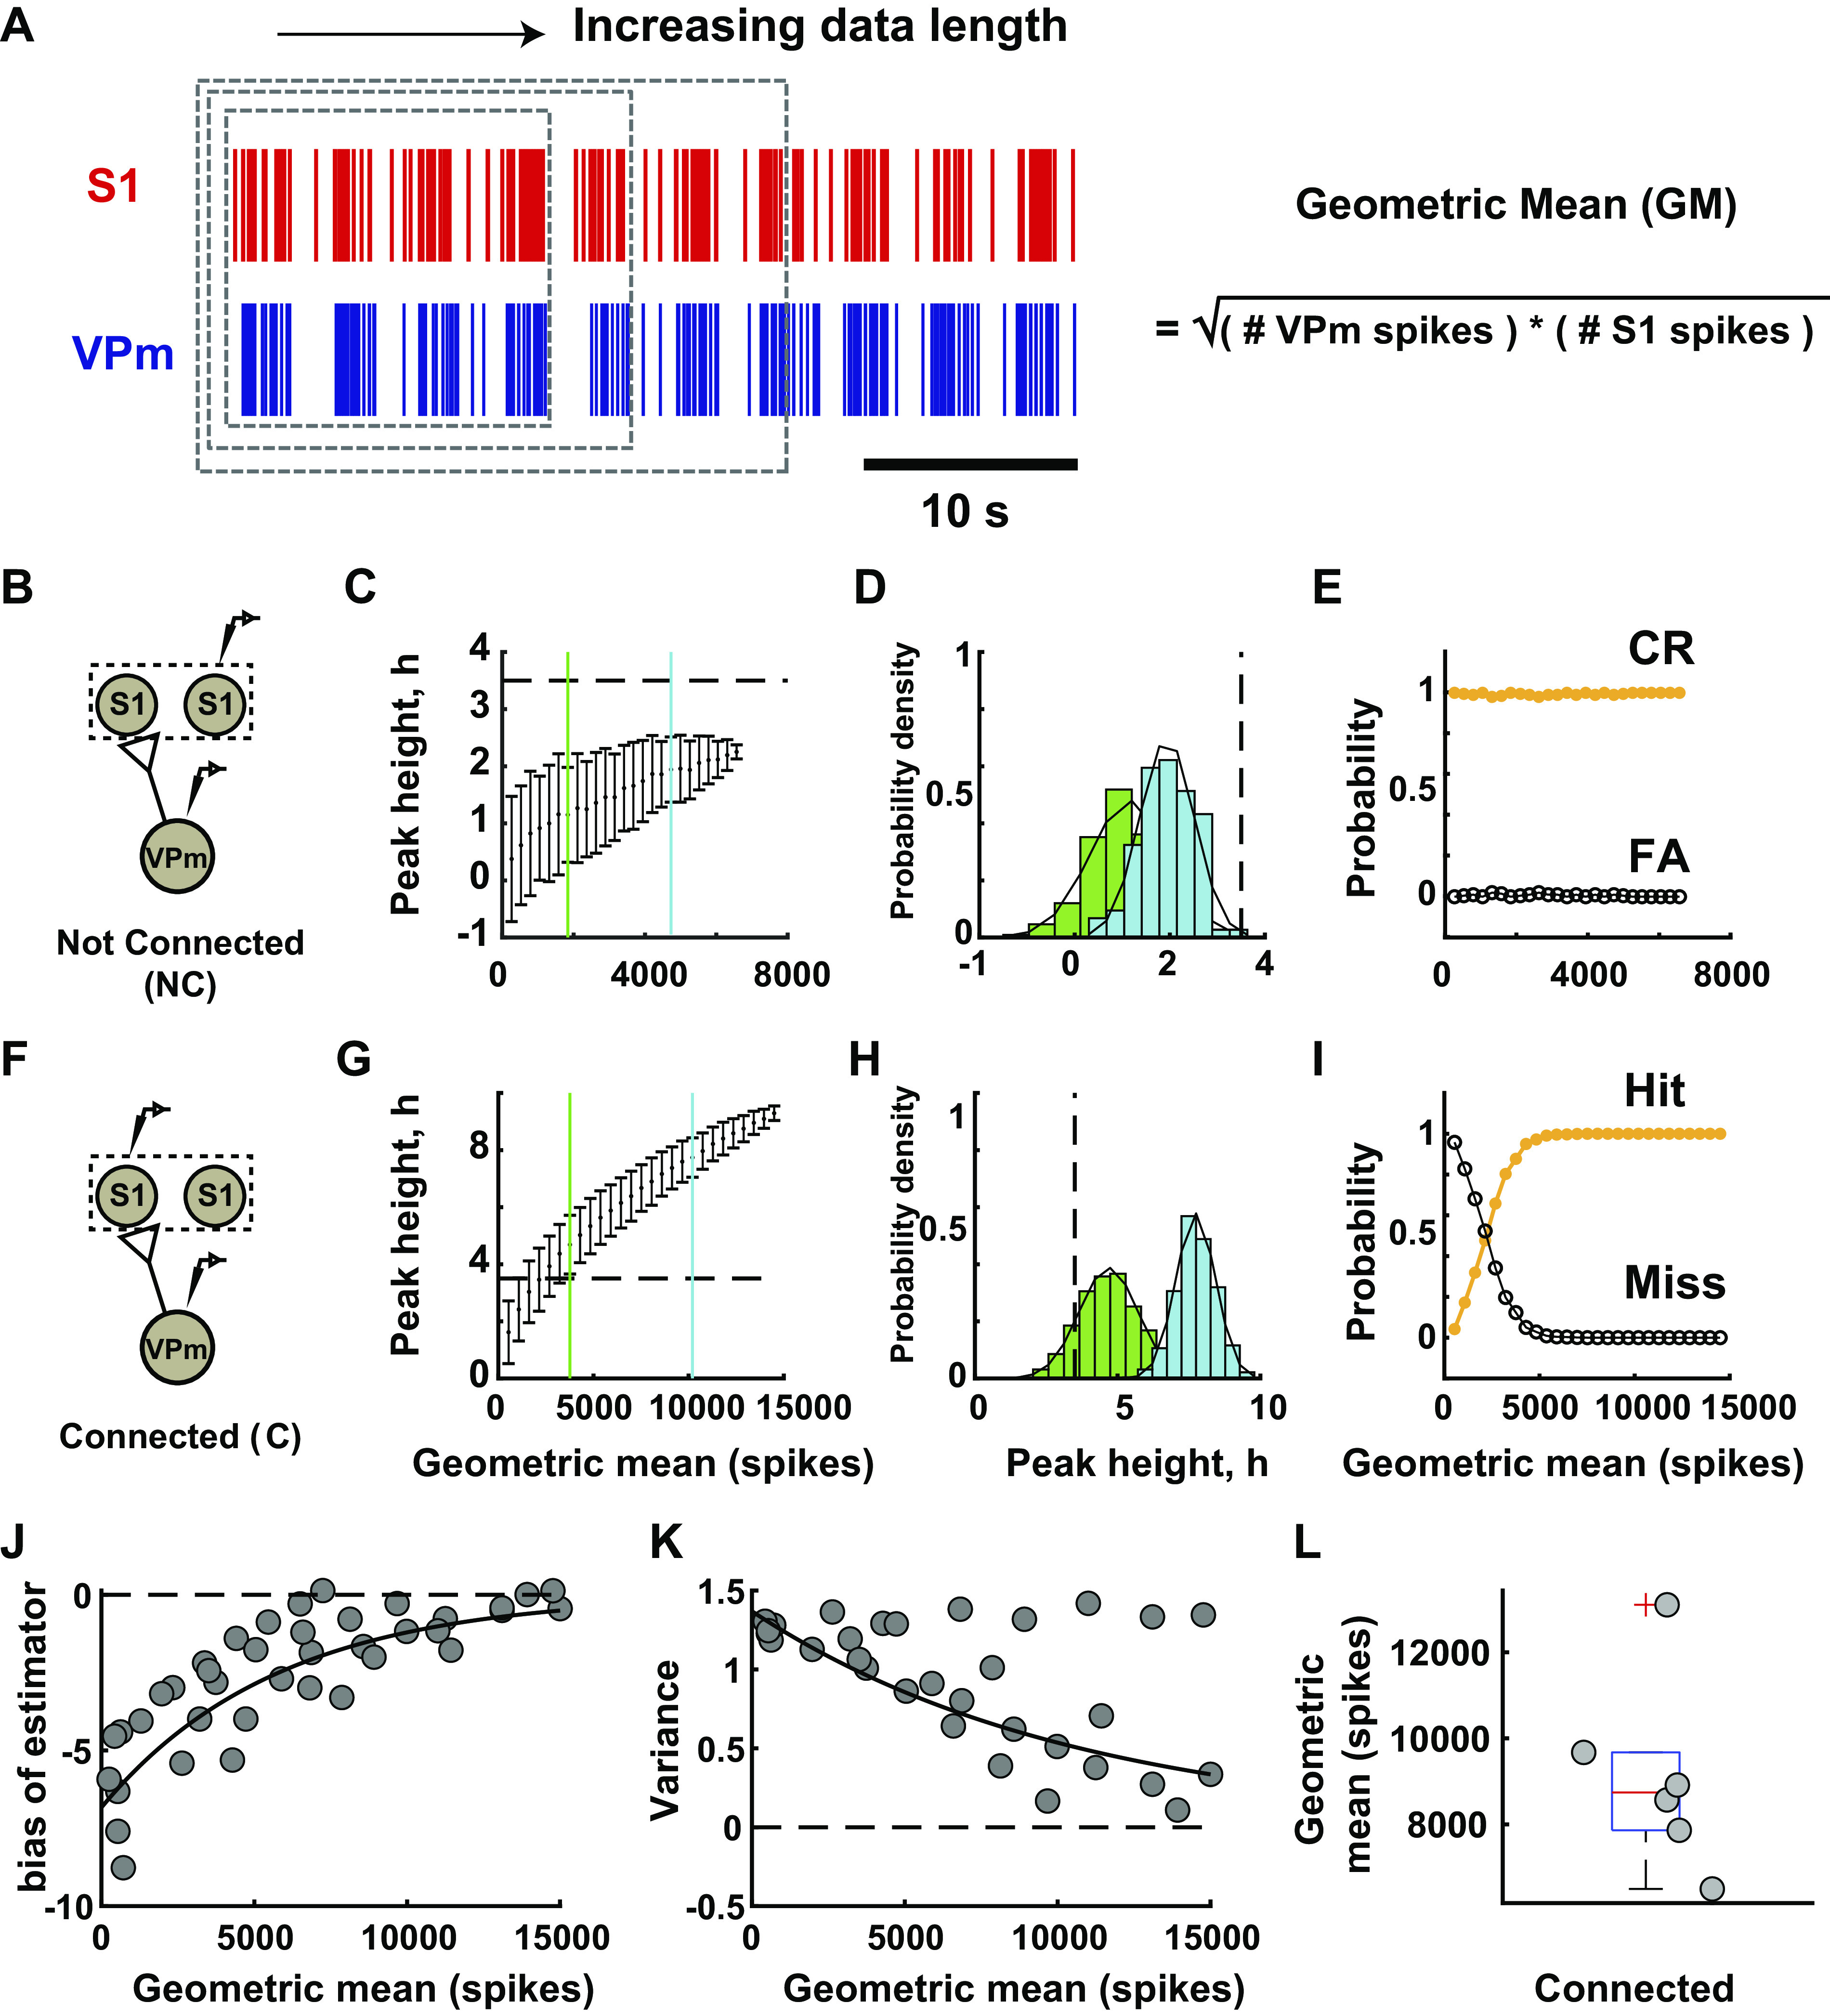
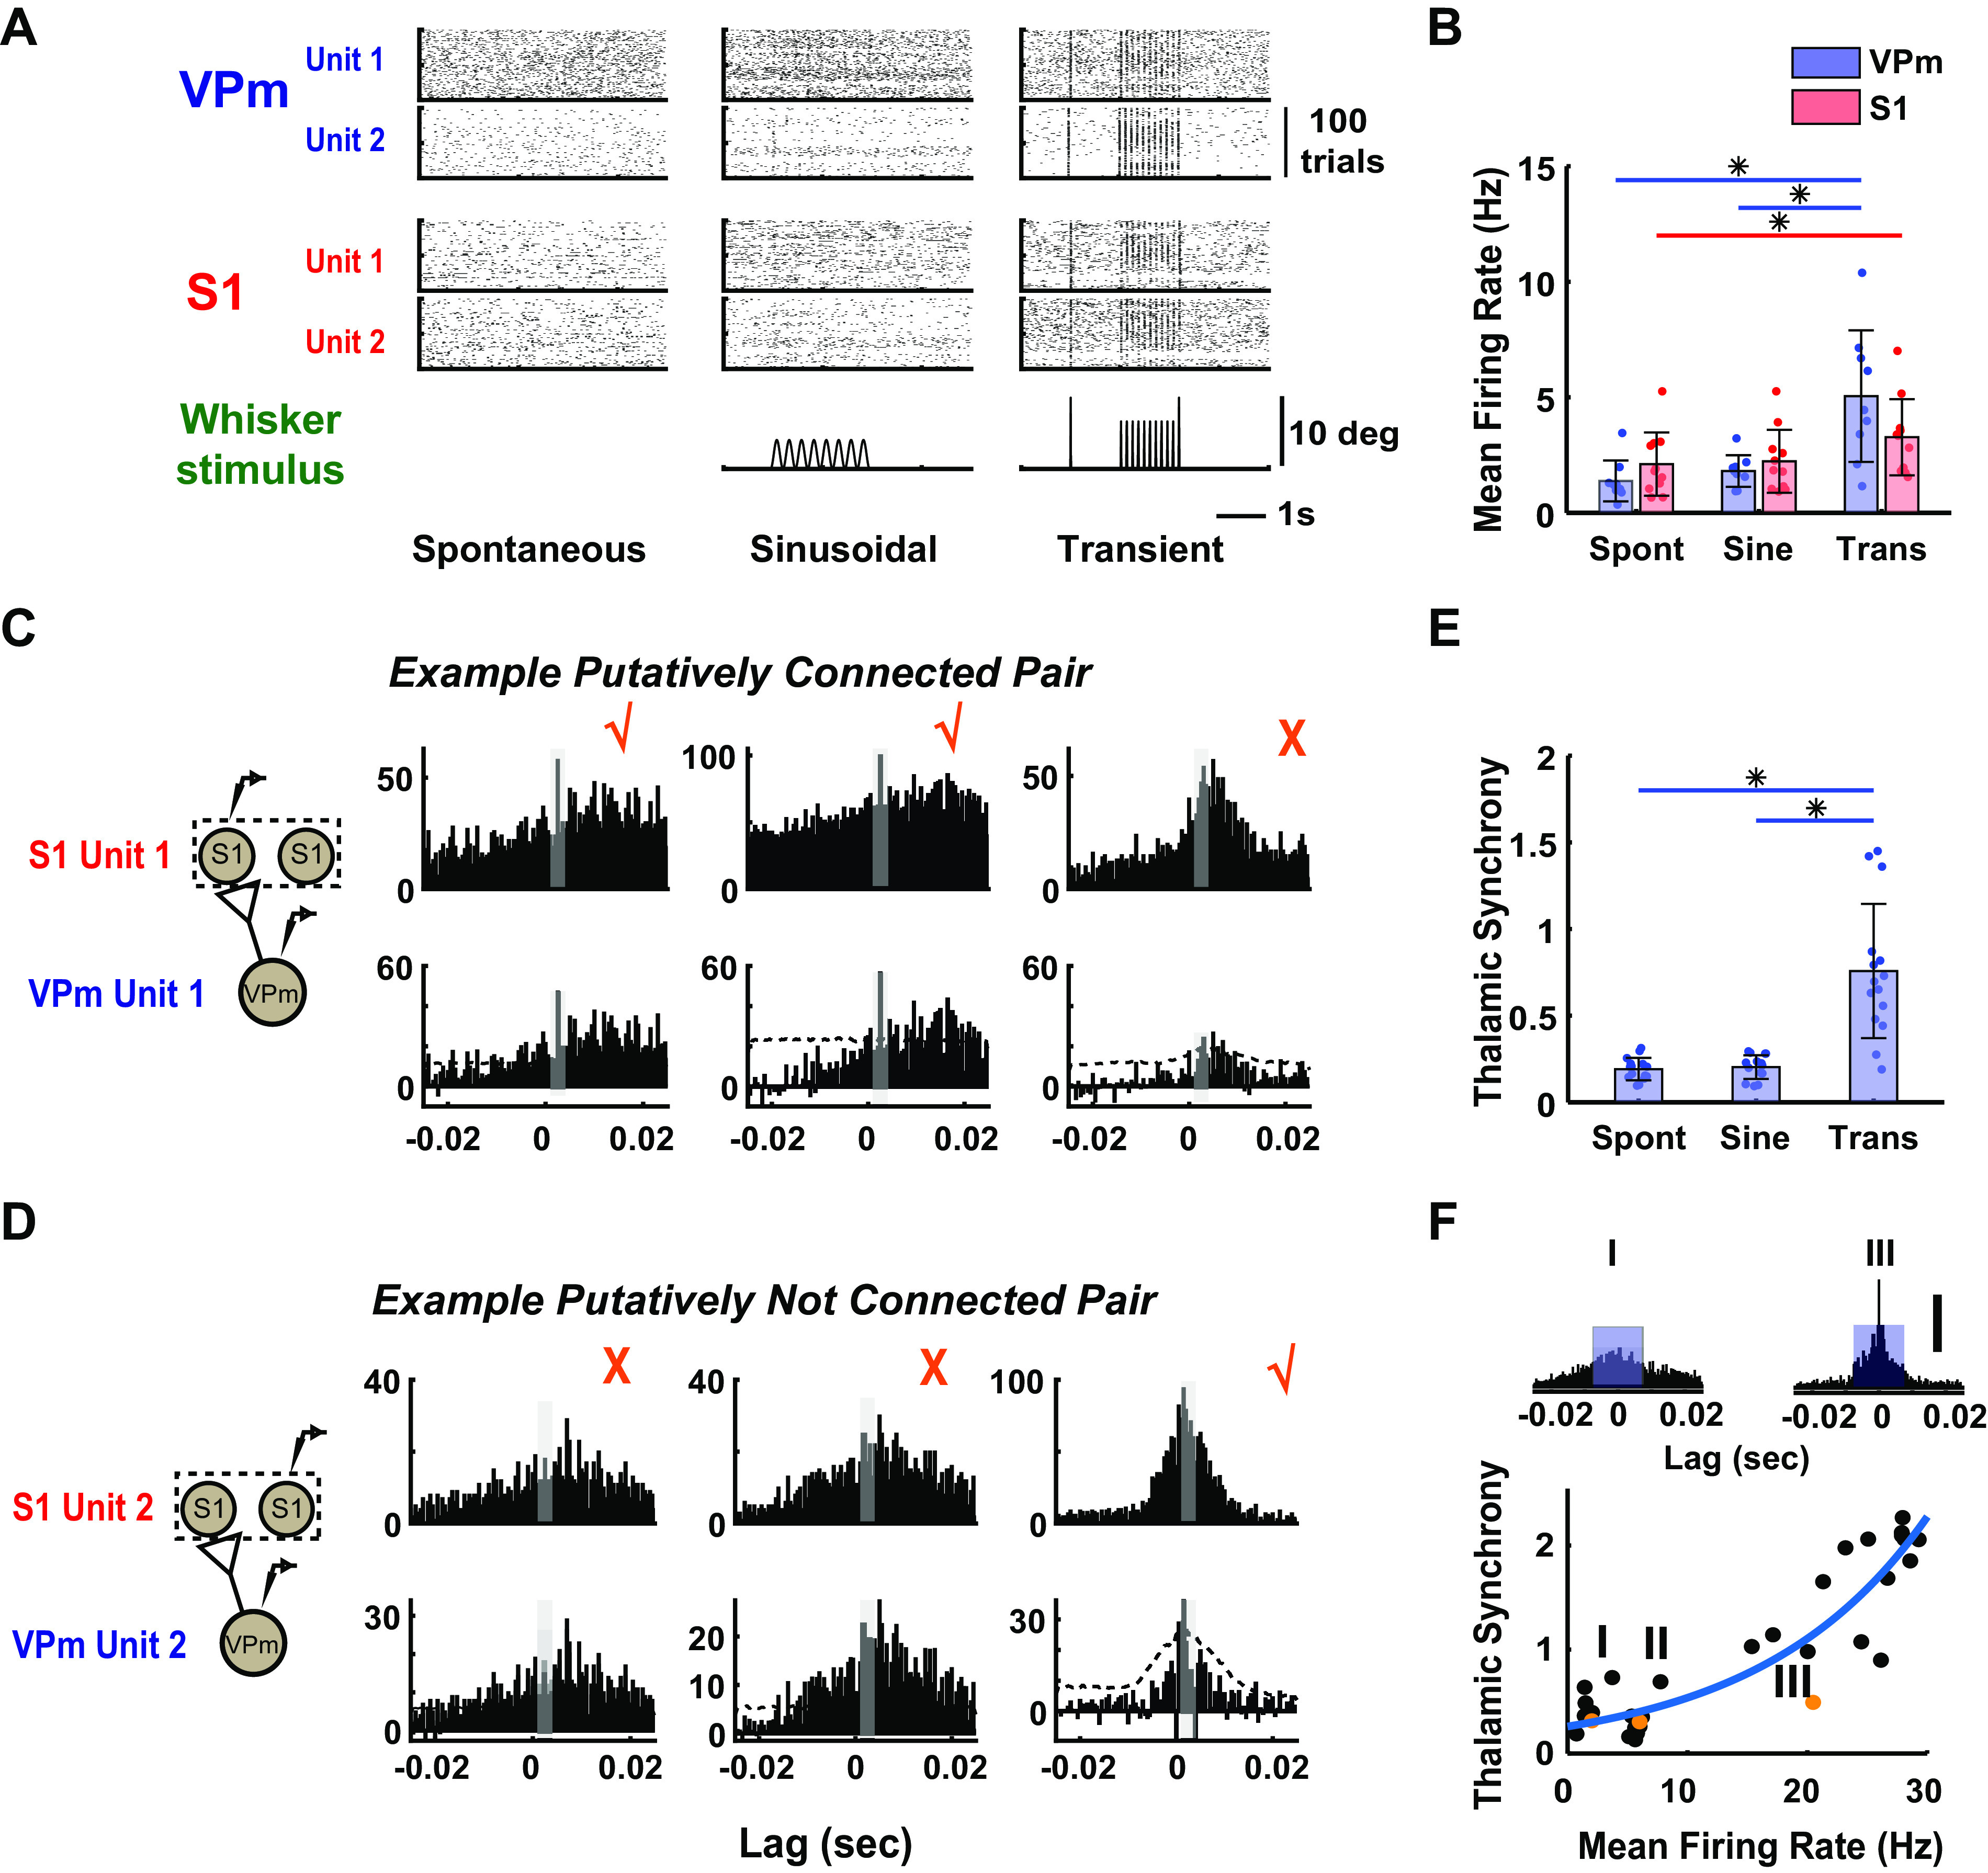
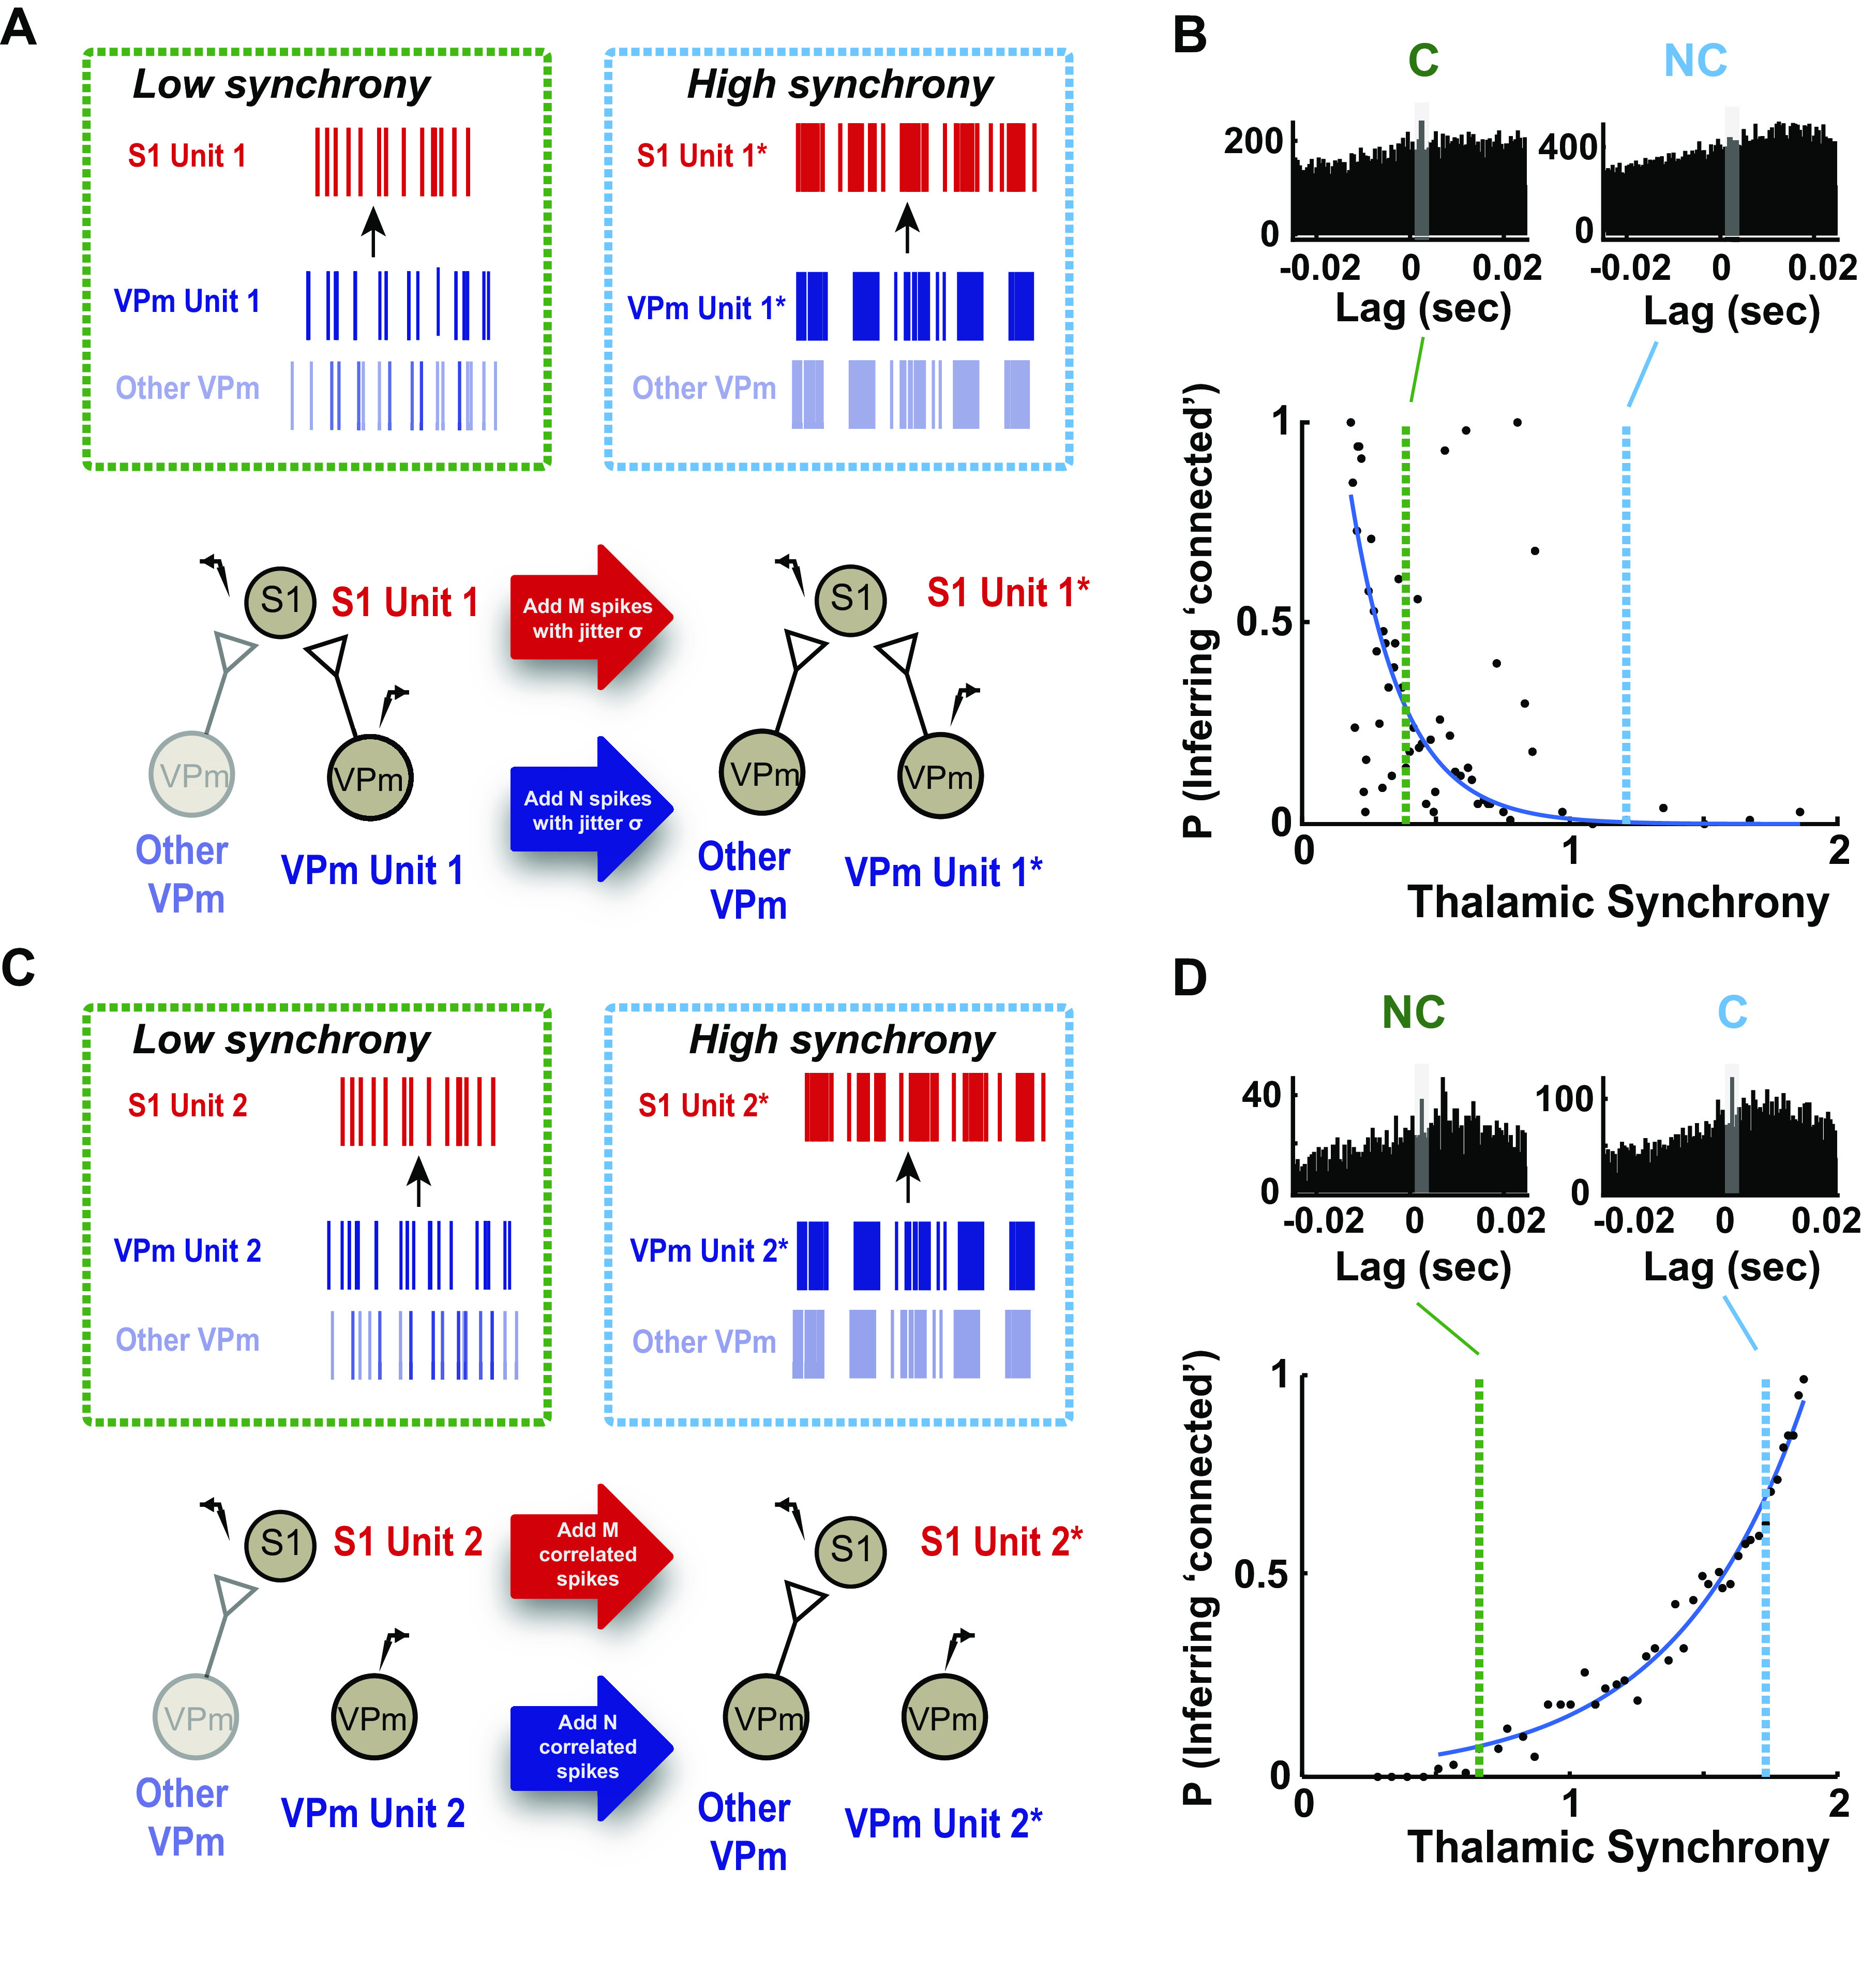
As the tools to simultaneously record electrophysiological signals from large numbers of neurons within and across brain regions become increasingly available, this opens up for the first time the possibility of establishing the details of causal relationships between monosynaptically connected neurons and the patterns of neural activation that underlie perception and behavior. Although recorded activity across synaptically connected neurons has served as the cornerstone for much of what we know about synaptic transmission and plasticity, this has largely been relegated to ex vivo preparations that enable precise targeting under relatively well-controlled conditions. Analogous studies in vivo, where image-guided targeting is often not yet possible, rely on indirect, data-driven measures, and as a result such studies have been sparse and the dependence upon important experimental parameters has not been well studied. Here, using in vivo extracellular single-unit recordings in the topographically aligned rodent thalamocortical pathway, we sought to establish a general experimental and computational framework for inferring synaptic connectivity. Specifically, attacking this problem within a statistical signal detection framework utilizing experimentally recorded data in the ventral-posterior medial (VPm) region of the thalamus and the homologous region in layer 4 of primary somatosensory cortex (S1) revealed a trade-off between network activity levels needed for the data-driven inference and synchronization of nearby neurons within the population that results in masking of synaptic relationships. Here, we provide a framework for establishing connectivity in multisite, multielectrode recordings based on statistical inference, setting the stage for large-scale assessment of synaptic connectivity within and across brain structures.NEW & NOTEWORTHY Despite the fact that all brain function relies on the long-range transfer of information across different regions, the tools enabling us to measure connectivity across brain structures are lacking. Here, we provide a statistical framework for identifying and assessing potential monosynaptic connectivity across neuronal circuits from population spiking activity that generalizes to large-scale recording technologies that will help us to better understand the signaling within networks that underlies perception and behavior.

Keywords: causality; cross correlation; inference; signal detection; thalamocortical circuit.


Conflict of interest statement

No conflicts of interest, financial or otherwise, are declared by the authors.

Figures

None
Graphical abstract
Figure 1.
Figure 1.
Experimental approach used to estimate monosynaptic connectivity between somatotopically organized areas of the rodent somatosensory pathway. A: simultaneous single-unit extracellular recordings were performed in the ventral posteromedial nucleus (VPm) of the thalamus and in layer IV of primary somatosensory cortex (S1) in anesthetized rodents. Recordings were targeted to topographically aligned barreloids in VPm and barrel column in S1. Weak stimulation was applied to the whisker corresponding to the recorded barreloid/barrel column to elicit nonsynchronous spiking. Putative monosynaptic connections between pairs of neurons were inferred with cross correlation analysis. B: experimental procedures used to establish paired recordings involve 1) animal preparation including surgeries; 2) S1 mapping; 3) identification of the whisker corresponding to the recorded barreloid; 4) targeting corresponding S1 barrel column and layer IV; 5) data collection for assessing monosynaptic connectivity by generating spikes via whisker stimulation; repeating steps 3, 4, and 5 for recording additional pairs; and 6) histology. FS, fast-spiking unit; L4, layer 4; POm, posteromedial nucleus; RS, regular-spiking unit; wC2, C2 whisker.
Figure 2.
Figure 2.
Targeting topographical alignment in vivo. A: primary somatosensory cortex (S1) targeting: Location of S1 barrels was determined with intrinsic imaging (IOS) in mice. The 3 images at top are images acquired in response to separate single punctate deflections of the beta whisker (wBeta), the C2 whisker (wC2), and the B2 whisker (wB2). A barrel template was compared with the optical image of the brain surface through the thinned skull and fitted based on the location of the centroid of barrels to provide guidance for electrode placement. B: ventral posteromedial nucleus (VPm) targeting: example mean local field potential (LFP) amplitude of evoked response (shown by downward deflection after stimulus onset) for 4 stimulated whiskers in mice. Note the largest and fastest response to the A3 vibrissa and the comparatively weak responses to the adjacent B2, B3, and C3 vibrissae, lending support for VPm localization. C, left: histological slice showed electrode tracks marked with fluorescent dyes (see Postmortem Histology) on coronal brain sections targeting VPm (bottom) and S1 layer IV (top) in a mouse. Center: example raw voltage traces from extracellular recordings performed simultaneously in VPm and S1 layer IV during sensory stimulation in a rat. Mean waveforms of isolated single units from each recording site are shown (shaded region indicates 1 standard deviation of spike amplitude) Right: spike autocorrelograms of each unit in a rat. D, left: example adapting response of a single thalamic unit from a rat, showing mean first spike latency in response to first and last pulses of a 8-Hz pulsatile, ongoing stimulus (first pulse: 5.18 ms, last pulse: 10.7 ms). Right: population adapting response for thalamic units recorded in rats and mice [first pulse (rats): 8.39 ± 1.87 ms, last pulse (rats): 12.3 ± 3.04 ms, n = 24 neurons, N = 12 rats; first pulse (mice): 9.37 ± 1.39 ms, last pulse (mice): 13.1 ± 2.78 ms, n = 39 neurons, N = 4 mice]. Inset: all thalamic units that we recorded showed latency shift < 20 ms [latency shift (rats) = 3.65 ± 2.62 ms, n = 24 neurons, N = 12 rats; latency shift (mice) = 3.71 ± 3.11 ms, n = 39 neurons, N = 4 mice], suggesting that they were thalamic VPm units. E, left: example peristimulus time histogram (PSTH, 2-ms bin size) for a thalamic and a cortical unit in the 30-ms window following punctate (600°/s) whisker stimulus (indicated by green dashed line at t = 0). We computed mean first spike latency (FSL), defined as average latency of first spike in 30-ms response windows after stimulus presentation for each unit (VPm: 7.5 ms, S1: 11.2 ms). Right: population mean FSL for all simultaneously recorded thalamic and cortical units in rats and mice [VPm (rats): 8.30 ±1.84 ms, S1 (rats): 11.40 ± 1.77 ms, n = 22 neurons, N = 12 rats; VPm (mice): 9.80 ± 1.31 ms, n = 9 neuron; S1 (mice): 12.6 ± 2.06 ms, n =11 neurons, N = 1 mouse). BF, barrel field.
Figure 5.
Figure 5.
Connectivity matrix for topographically aligned, simultaneous multisite recordings. A: thalamic[ventral posteromedial nucleus (VPm)] probe recording. Five whisker-responsive thalamic units were isolated from 32-channel silicon probe sites, labeled A–D. Mean waveforms of single units are shown on right (shaded region indicates 1 standard deviation of spike amplitude) (n = 5 neurons). B: cortical [primary somatosensory cortex (S1)] probe recording. Four whisker-responsive units, putatively from layer IV barrel cortex, were isolated from 32-channel silicon probe sites, labeled A–D. Mean waveforms of units are shown on right (shaded region indicates 1 standard deviation of spike amplitude) (n = 4 neurons). Table 1 shows binary outcomes of the monosynaptic connectivity inference based on criteria 1 and 2 of cross correlation analysis. Table 2 shows the connectivity matrix tabulating the probability of inferring a putative monosynaptic connection using the bootstrapping method for each thalamocortical pair in Table 1 (bootstrap iteration = 1,000). C, connected; NC, not connected.
Figure 3.
Figure 3.
Monosynaptic connectivity inference using cross correlation analysis. A: inferring monosynaptic connectivity from extracellular recordings performed in topographically aligned thalamocortical regions in vivo resulted in binary consequences. A pair of neurons can be putatively classified as connected or not connected, as shown in the schematic. S1, primary somatosensory cortex; VPm, ventral posteromedial nucleus. B: raster plots showing whisker-evoked spiking response under low-velocity sinusoidal stimulation (mean velocity: 25°/s) for a representative example from thalamus and cortex in a rat. C: all cross correlograms were computed using VPm spike train as a reference. Occurrences of cortical spikes were measured at various time lags (25-ms window before and after a thalamic spike, with 0.5-ms step size; see methods). D: stimulus-driven cross correlograms were constructed between the original reference VPm spike trains and the trial-shuffled cortical spike trains. E: shuffled-corrected cross correlograms were generated by subtracting the mean of shuffled cross correlograms (averaged from 1,000 iterations) from the raw cross correlograms. Dotted gray lines denote 3.5 standard deviation of the shuffled distribution.
Figure 4.
Figure 4.
Evaluation of monosynaptic connection inference in the context of a signal detection framework. A: in the context of signal detection framework, we defined 2 distinct metrics and criteria to classify neuronal pairs into connected and not-connected distribution. Shown here are representative example pairs from each condition. Top: note the qualitative difference in raw cross correlograms (CR), one with broad and distributed spikes in cross correlogram (left) and another with sharp peaks (right) in 1–4 ms time lags (shaded gray). The first metric is the maximum peak of the raw cross correlogram (CR), and criterion 1 was fulfilled if the maximum peak of the raw cross correlograms was within 1–4 ms lag. Bottom: after correcting for stimulus-driven correlations, we further quantified the significance of the peaks detected in raw cross correlogram. Hence, the second metric used here is the peak height within the window of interest (1–4 ms bin), measured as maximum peak value in shuffled-corrected cross correlogram (CSC), normalized to the number of standard deviations (SDs) with respect to the shuffled distribution. Criterion 2 was fulfilled if the peak exceeded 3.5 SDs of the shuffled distribution. B: as expected, the majority of simultaneously recorded thalamocortical pairs exhibited peak correlation after 0 time lag (n = 42 pairs; rats: 22, mice: 20). Histograms show the number of events in each bin of raw cross correlograms (top) and shuffled-corrected cross correlograms (bottom), sorted by latency of maximum peak in the cross correlograms. Data were normalized to maximum peak, and the colors in each row show the number of events for an individual pair, normalized to maximum peak. C: distribution of the lags of the peak location in the raw and shuffled-corrected correlograms across all recorded pairs. Note that the peak locations for raw and shuffled-corrected correlograms were largely the same, shifted only by 1–2 bin size (0.5-ms bin). D: within this framework, 4 possible outcomes are possible: hit: connected and inferred to be connected; miss: connected but inferred to be not connected; false alarm (FA): not connected but inferred to be connected; correct rejection (CR): not connected and inferred to be not connected. E: in this context, we found that 11/42 pairs have putative monosynaptic connection (denoted by filled circles) and 31/42 pairs. Pairs were not connected (n = 22 pairs, N = 12 rats; n = 20 pairs, N = 1 mouse). Note that criterion 1 was a binary classification: pairs having peak locations from their raw cross correlograms within the 1–4 ms lag pass criterion 1, and those that do not fail criterion 1. For criterion 2, the dashed vertical line represents 3.5 SDs for the peak height metric: pairs having peak height above this criterion line pass criterion 2. Only pairs that passed both criteria 1 and 2 were classified as connected [anything to the right of the vertical dashed line in E (top row)], and the rest were classified as not connected. For each recorded pair, probability of inferring monosynaptic connection (i.e., probability of bootstrapped data satisfying criteria 1 and 2) is depicted with a color bar. Note that 1,000 iterations were performed for each data set.
Figure 6.
Figure 6.
Data length dependence effect on monosynaptic connection inference. A: data length dependence effect on connectivity inference was evaluated with a subsampling method. Data length was measured in terms of geometric mean number of spikes, which was calculated by taking the square root of the product of total ventral posteromedial nucleus (VPm) and primary somatosensory cortex (S1) spikes. Random subsampling of the data set was performed in the unit of trials with 1,000 iterations for each condition. B: representative example pair of neurons from not-connected distribution in a rat. C: mean and standard deviation of peak height from cross correlogram were computed for each subsample of not-connected example. Blue line, short-data length condition (GM: 1,837 spikes); green line, long-data length condition (GM: 4,730 spikes). D: distribution of peak height after bootstrapping for 2 data lengths labeled in part I. E: probability of outcome for this example. CR, correct reject; FA, false alarm. F–I: similar to B–E but for connected example in a rat [blue (GM): 3,760 spikes, hit rate 87.7%, miss rate 12.3%; green (GM): 10,201 spikes, hit and miss rates 100%, 0%] (also see Supplemental Fig. S5; see https://doi.org/10.6084/m9.figshare.14393582.v1). J: bootstrap estimator of bias for each data length. Scatterplot of population data for connected pairs (n = 6 pairs, N = 3 rats). Solid line, exponential fit (R2 = 0.76). K: variance of peak height at each data length for pairs shown in J. Solid line, 1st-order polynomial fit (R2 = 0.62%). L: geometric mean for all connected pairs (median: 8,741 spikes, n = 6 pairs, N = 3 rats).
Figure 7.
Figure 7.
Thalamic synchrony effect on monosynaptic connection inference. A: raster plots from simultaneously recorded thalamic and cortical units under spontaneous (no stimulus; Spont), sinusoidal stimulus (mean velocity: 25°/s; Sine), and transient inputs (1,200°/s; Trans) in a mouse. S1, primary somatosensory cortex; VPm, ventral posteromedial nucleus. B: mean firing rates of thalamus (VPm, blue) and cortex (S1, red) of neuronal pairs were quantified across all 3 stimulus conditions. VPm: spontaneous: 1.38 ± 0.89 Hz, sinusoidal: 2.11 ± 1.37 Hz, transient: 5.05 ± 2.85 Hz; mean ± SE (n = 9 neurons); S1: spontaneous: 2.11 ± 1.37 Hz, sinusoidal: 2.23 ± 1.36 Hz, transient: 3.27 ± 1.65 Hz (n = 11 neurons, N = 1 mouse) (*P < 0.05, Wilcoxon signed-rank test with Bonferroni correction). C: monosynaptic connectivity inference for 1 representative example of connected thalamocortical pair from mouse. Checkmark symbols indicate that the pair is being classified as putatively connected; cross symbols indicate that the pair is being classified as not connected. D: same as C but for not-connected example. E: thalamic synchrony was computed across 3 stimulus conditions, calculated as number of synchronous events between 2 thalamic units that occur within central window (±7.5 ms). (*P < 0.05, Wilcoxon signed-rank test with Bonferroni correction). Spontaneous: 0.20 ± 0.07; sinusoidal: 0.19 ± 0.06; transient: 0.76 ± 0.39; mean ± SE (n = 9 neurons, 15 pairs, N = 1 mouse). F, top: raw spike cross correlograms for the 2 VPm units shown in A (top) in spontaneous and transient stimulus conditions. (I, spontaneous; III, transient). Blue box on each cross correlogram represents the central window (±7.5 ms) used for thalamic synchrony computation. Scale bar represents 100 spikes in cross correlograms. Bottom: the relationship between thalamic synchrony and mean firing rate of respective thalamic pairs was quantified across various stimulus conditions, including spontaneous, sinusoidal, and transient stimuli with 6 different velocities (n = 5 neurons, 10 pairs, N = 1 mouse). Orange symbols represent thalamic synchrony across 3 stimulus conditions for example thalamic pair (I, spontaneous; II, sinusoidal; III, transient). Blue line shows exponential fit of the relationship.
Figure 8.
Figure 8.
Potential errors in connectivity inference due to thalamic synchrony. A: schematic shows conditions for 2 different synchrony levels, low and high. As thalamic synchrony increases, both thalamic and cortical units showed an increase in firing rate accompanied by highly synchronous spiking in the local ventral posteromedial nucleus (VPm) population. To approximate this effect, we gradually added synchronous spikes in VPm and primary somatosensory cortex (S1). We matched the firing rate of thalamic (N spikes) and cortical cells (M spikes), using experimental data, and introduced the same amount of jitter (σ) associated with a specific thalamic synchrony level to both spike trains. B: the effects of increase in synchronous firing on the monosynaptic connectivity inference were examined with a probabilistic measure. Our simulation showed that with increasing thalamic synchrony, the probability of satisfying the criterion for monosynaptic connection decreased. Two example raw cross correlograms, corresponding to low and high synchrony level, showed that a connected (C) pair (green, P = 0.3 at synchrony level of 0.25) could be misclassified as not connected at a higher synchrony level (light blue, P = 0.05 at synchrony level of 1.2). C: same as A but for an example not-connected (NC) thalamocortical pair. We gradually increased the thalamic and cortical firing by introducing synchronous spikes from a neighboring connected pair (denoted as N correlated spikes for thalamic and M correlated spikes for cortical cell). We found that the probability of error rapidly increased with thalamic synchrony (probability of satisfying criterion 1 exceeds 0.5 as thalamic synchrony reaches 1.5). D: the probability of incorrectly inferring connectivity significantly increased with increasing synchrony. Two example raw cross correlograms at the corresponding thalamic synchrony level showed that a not-connected pair could be misclassified as connected at a higher synchrony level. Note the emergence of monosynaptic peaks in raw cross correlograms with increased synchrony.

Similar articles

Cited by

References

    1. Jouhanneau JS, Poulet JF. Multiple two-photon targeted whole-cell patch-clamp recordings from monosynaptically connected neurons in vivo. Front Synaptic Neurosci 11: 15, 2019. doi:10.3389/fnsyn.2019.00015. - DOI - PMC - PubMed
    1. Kodandaramaiah SB, Flores FJ, Holst GL, Singer AC, Han X, Brown EN, Boyden ES, Forest CR. Multi-neuron intracellular recording in vivo via interacting autopatching robots. eLife 7: e24656, 2018. doi:10.7554/eLife.24656. - DOI - PMC - PubMed
    1. Stoy WA, Kolb I, Holst GL, Liew Y, Pala A, Yang B, Boyden ES, Stanley GB, Forest CR. Robotic navigation to subcortical neural tissue for intracellular electrophysiology in vivo. J Neurophysiol 118: 1141–1150, 2017. doi:10.1152/jn.00117.2017. - DOI - PMC - PubMed
    1. Berényi A, Somogyvári Z, Nagy AJ, Roux L, Long JD, Fujisawa S, Stark E, Leonardo A, Harris TD, Buzsáki G. Large-scale, high-density (up to 512 channels) recording of local circuits in behaving animals. J Neurophysiol 111: 1132–1149, 2014. doi:10.1152/jn.00785.2013. - DOI - PMC - PubMed
    1. Buzsáki G, Stark E, Berényi A, Khodagholy D, Kipke DR, Yoon E, Wise KD. Tools for probing local circuits: high-density silicon probes combined with optogenetics. Neuron 86: 92–105, 2015. doi:10.1016/j.neuron.2015.01.028. - DOI - PMC - PubMed

Publication types

LinkOut - more resources