

A Global Vista of the Epigenomic State of the Mouse Submandibular Gland
- PMID: 33978512
- PMCID: PMC8640340
- DOI: 10.1177/00220345211012000
A Global Vista of the Epigenomic State of the Mouse Submandibular Gland
Abstract
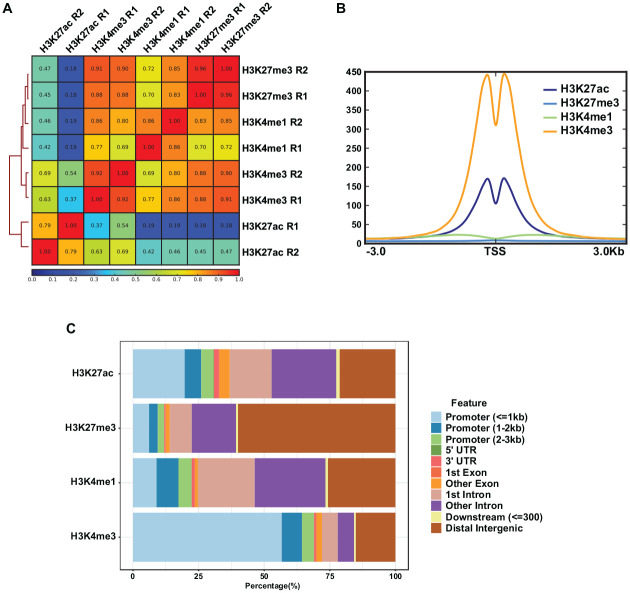
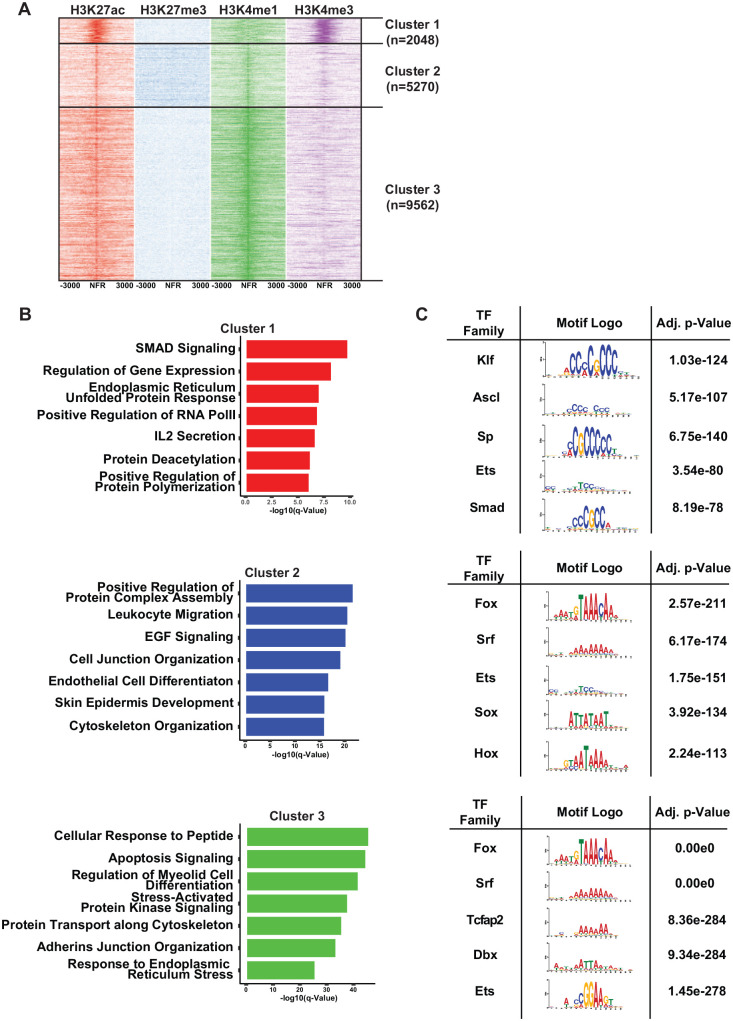
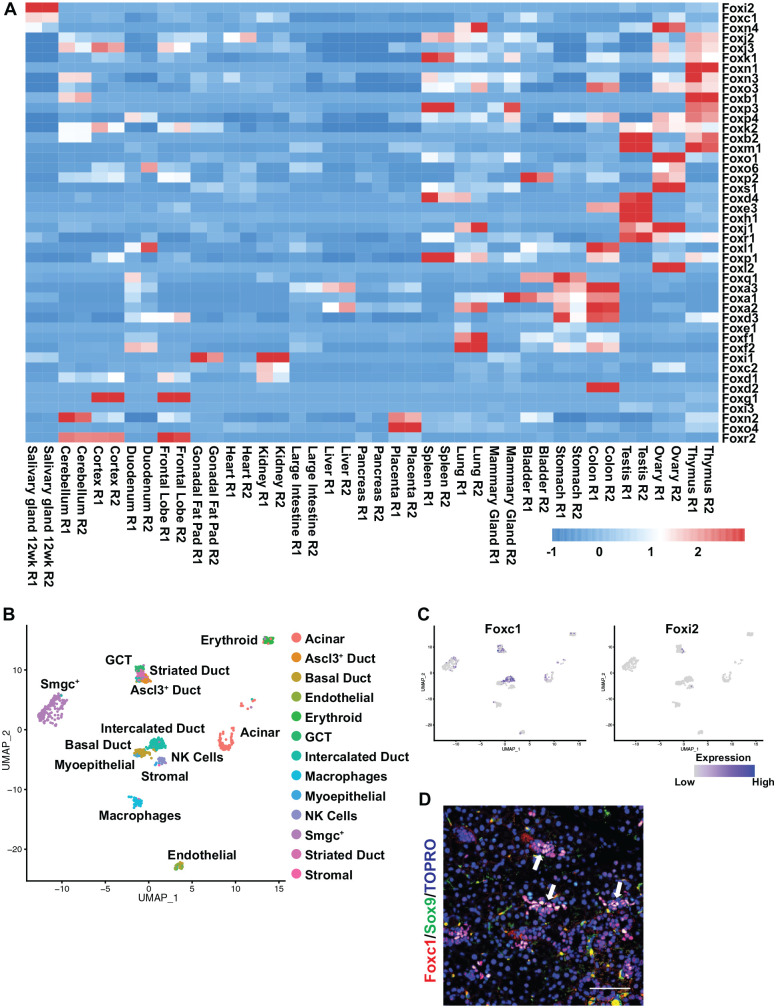
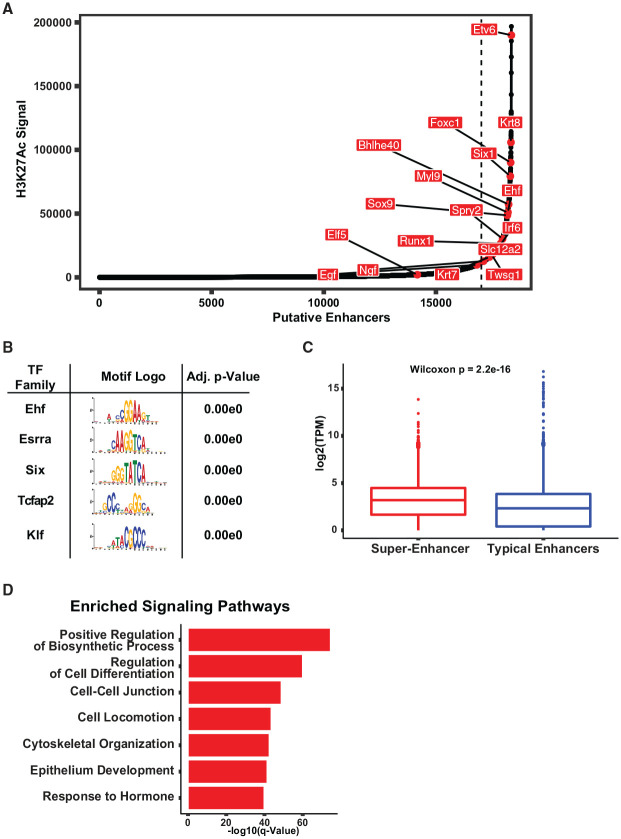
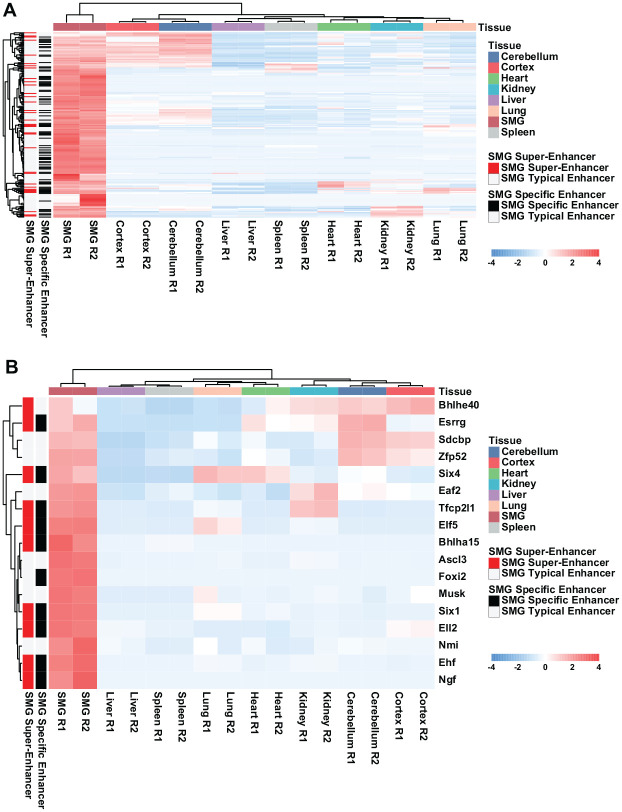
The parotid, submandibular, and sublingual glands represent a trio of oral secretory glands whose primary function is to produce saliva, facilitate digestion of food, provide protection against microbes, and maintain oral health. While recent studies have begun to shed light on the global gene expression patterns and profiles of salivary glands, particularly those of mice, relatively little is known about the location and identity of transcriptional control elements. Here we have established the epigenomic landscape of the mouse submandibular salivary gland (SMG) by performing chromatin immunoprecipitation sequencing experiments for 4 key histone marks. Our analysis of the comprehensive SMG data sets and comparisons with those from other adult organs have identified critical enhancers and super-enhancers of the mouse SMG. By further integrating these findings with complementary RNA-sequencing based gene expression data, we have unearthed a number of molecular regulators such as members of the Fox family of transcription factors that are enriched and likely to be functionally relevant for SMG biology. Overall, our studies provide a powerful atlas of cis-regulatory elements that can be leveraged for better understanding the transcriptional control mechanisms of the mouse SMG, discovery of novel genetic switches, and modulating tissue-specific gene expression in a targeted fashion.
Keywords: ChIP-sequencing; epigenomics; gene expression; histone modification; regulatory regions; salivary glands.
Conflict of interest statement
Figures
Similar articles
-
Submandibular gland removal decreases avoidance of bitter taste in mice.Am J Physiol Regul Integr Comp Physiol. 2025 Mar 1;328(3):R300-R305. doi: 10.1152/ajpregu.00290.2024. Epub 2025 Feb 7. Am J Physiol Regul Integr Comp Physiol. 2025. PMID: 39918748
-
Validation of superior reference genes in mouse submandibular glands under developmental and functional regeneration states.Int J Mol Med. 2022 Nov;50(5):132. doi: 10.3892/ijmm.2022.5188. Epub 2022 Sep 7. Int J Mol Med. 2022. PMID: 36069228 Free PMC article.
-
Neonatal rat submandibular gland protein SMG-A and parotid secretory protein are alternatively regulated members of a salivary protein multigene family.J Biol Chem. 1992 Feb 5;267(4):2679-87. J Biol Chem. 1992. PMID: 1370829
-
Molecular cloning of developmentally regulated neonatal rat submandibular gland proteins.Crit Rev Oral Biol Med. 1993;4(3-4):525-30. doi: 10.1177/10454411930040033801. Crit Rev Oral Biol Med. 1993. PMID: 8374006 Review.
-
Transplantation of the major salivary glands.Dev Ophthalmol. 2008;41:255-268. doi: 10.1159/000131094. Dev Ophthalmol. 2008. PMID: 18453774 Review.
Cited by
-
Cell-specific and shared regulatory elements control a multigene locus active in mammary and salivary glands.Nat Commun. 2023 Aug 17;14(1):4992. doi: 10.1038/s41467-023-40712-0. Nat Commun. 2023. PMID: 37591874 Free PMC article.
-
High-Resolution Transcriptomic Landscape of the Human Submandibular Gland.J Dent Res. 2023 May;102(5):525-535. doi: 10.1177/00220345221147908. Epub 2023 Feb 1. J Dent Res. 2023. PMID: 36726292 Free PMC article.
-
Genetic Study of Elf5 and Ehf in the Mouse Salivary Gland.J Dent Res. 2023 Mar;102(3):340-348. doi: 10.1177/00220345221130258. Epub 2022 Nov 8. J Dent Res. 2023. PMID: 36348499 Free PMC article.
-
Cell-specific and shared enhancers control a high-density multi-gene locus active in mammary and salivary glands.Res Sq [Preprint]. 2023 Feb 7:rs.3.rs-2533579. doi: 10.21203/rs.3.rs-2533579/v1. Res Sq. 2023. Update in: Nat Commun. 2023 Aug 17;14(1):4992. doi: 10.1038/s41467-023-40712-0. PMID: 36789414 Free PMC article. Updated. Preprint.
-
Cell-specific and shared enhancers control a high-density multi-gene locus active in mammary and salivary glands.bioRxiv [Preprint]. 2023 Feb 7:2023.02.06.527373. doi: 10.1101/2023.02.06.527373. bioRxiv. 2023. Update in: Nat Commun. 2023 Aug 17;14(1):4992. doi: 10.1038/s41467-023-40712-0. PMID: 36945503 Free PMC article. Updated. Preprint.
References
-
- Albert FW, Kruglyak L. 2015. The role of regulatory variation in complex traits and disease. Nat Rev Genet. 16(4):197–212. - PubMed
-
- Boecker W, Stenman G, Loening T, Andersson MK, Berg T, Lange A, Bankfalvi A, Samoilova V, Tiemann K, Buchwalow I. 2015. Squamous/epidermoid differentiation in normal breast and salivary gland tissues and their corresponding tumors originate from p63/K5/14-positive progenitor cells. Virchows Arch. 466(1):21–36. - PubMed
Publication types
MeSH terms
Grants and funding
LinkOut - more resources
Full Text Sources
Other Literature Sources
Molecular Biology Databases
Research Materials
