. 2021 Jul 5;218(7):e20202484.
doi: 10.1084/jem.20202484. Epub 2021 May 12.

The atypical antipsychotic risperidone targets hypothalamic melanocortin 4 receptors to cause weight gain

Affiliations

The atypical antipsychotic risperidone targets hypothalamic melanocortin 4 receptors to cause weight gain

Li Li et al. J Exp Med. .

Abstract

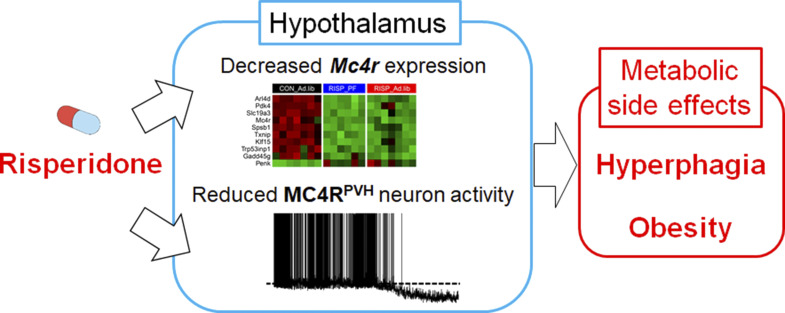
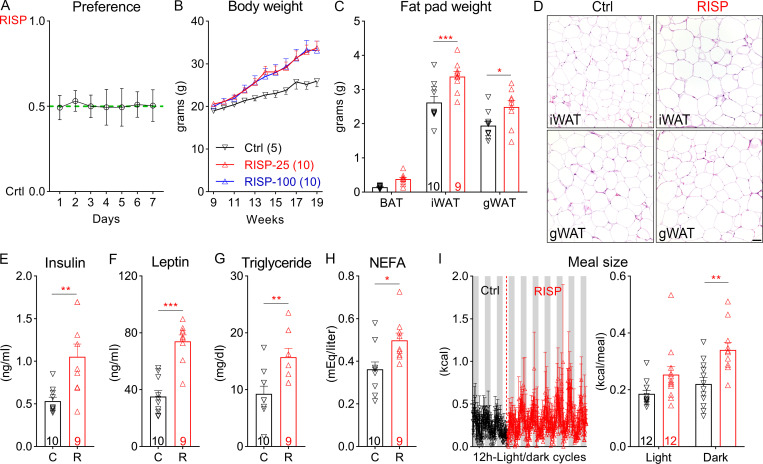
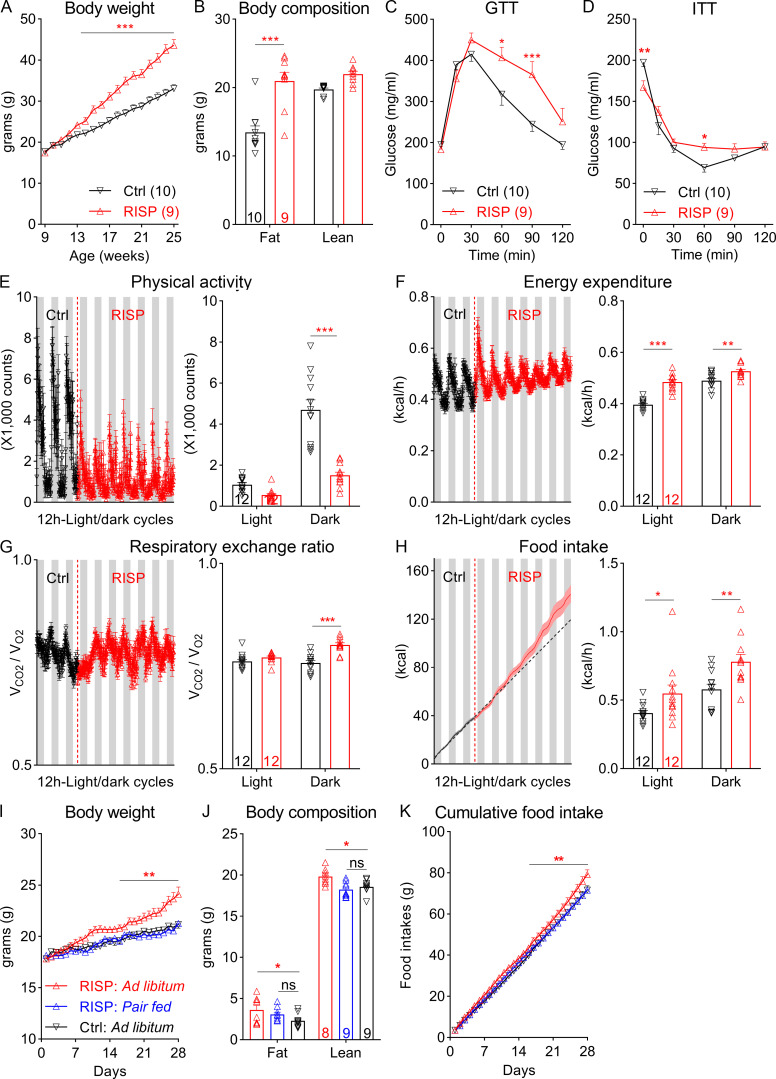
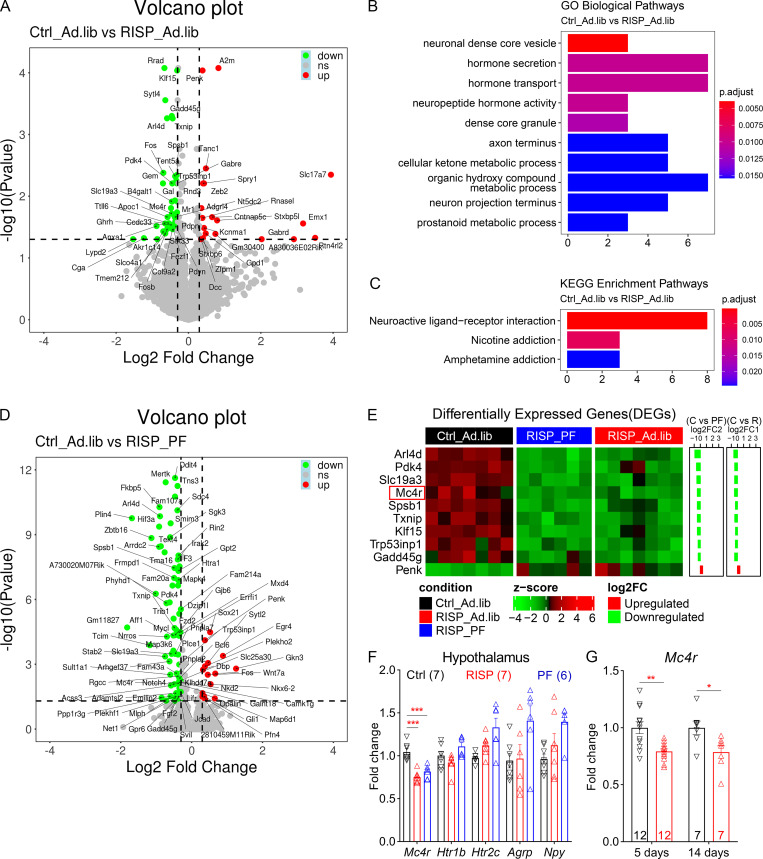
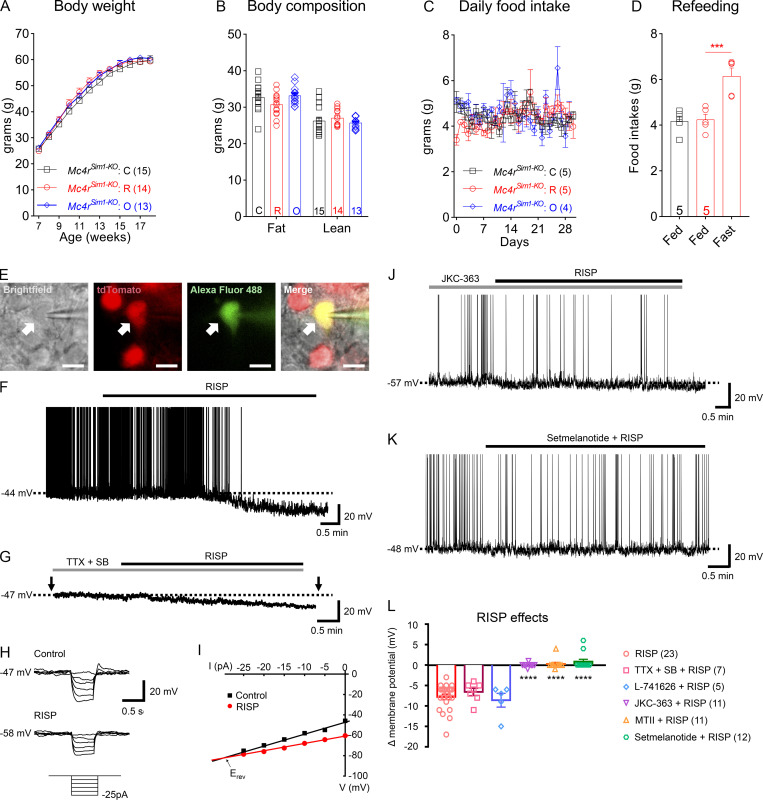
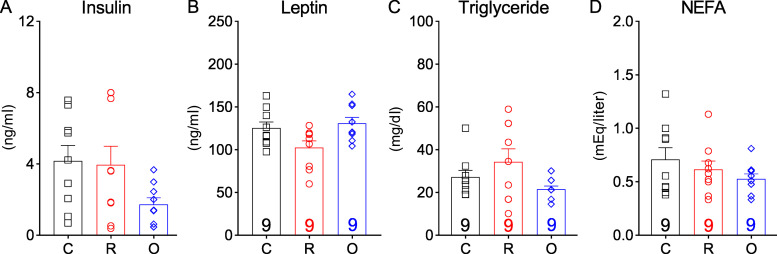
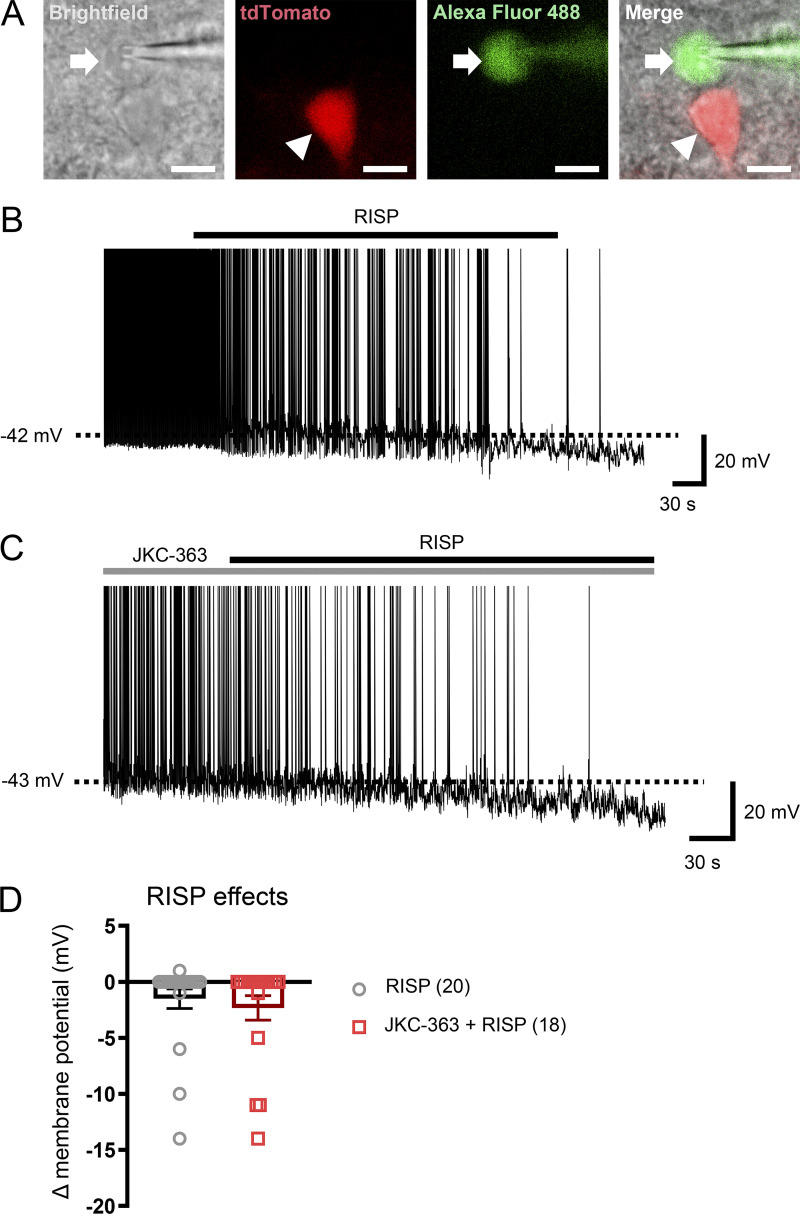
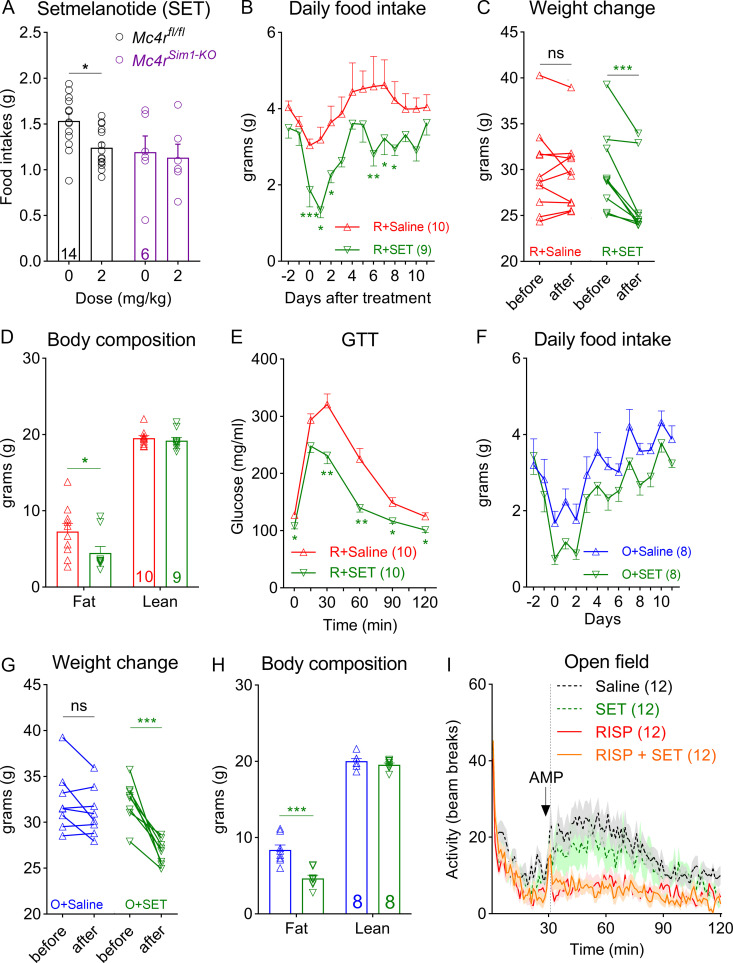
Atypical antipsychotics such as risperidone cause drug-induced metabolic syndrome. However, the underlying mechanisms remain largely unknown. Here, we report a new mouse model that reliably reproduces risperidone-induced weight gain, adiposity, and glucose intolerance. We found that risperidone treatment acutely altered energy balance in C57BL/6 mice and that hyperphagia accounted for most of the weight gain. Transcriptomic analyses in the hypothalamus of risperidone-fed mice revealed that risperidone treatment reduced the expression of Mc4r. Furthermore, Mc4r in Sim1 neurons was necessary for risperidone-induced hyperphagia and weight gain. Moreover, we found that the same pathway underlies the obesogenic effect of olanzapine-another commonly prescribed antipsychotic drug. Remarkably, whole-cell patch-clamp recording demonstrated that risperidone acutely inhibited the activity of hypothalamic Mc4r neurons via the opening of a postsynaptic potassium conductance. Finally, we showed that treatment with setmelanotide, an MC4R-specific agonist, mitigated hyperphagia and obesity in both risperidone- and olanzapine-fed mice.


Conflict of interest statement

Disclosures: The authors declare no competing interests exist.

Figures

None
Graphical abstract
Figure S1.
Figure S1.
Risperidone treatment alters energy metabolism. (A) Ratio of daily intake of the RISP diet (25 mg/kg) over that of the Ctrl diet when both diets were available in the cage for 7 d; n = 9. (B) Body weight of wild-type C57BL/6 mice fed the Ctrl, RISP-25 (25 mg/kg), or RISP-100 (100 mg/kg) diet; n = 5–10; two-way ANOVA; F(20, 220) = 2.71; P < 0.001. (C) Fat pad weight of mice after 16-wk treatment of the Ctrl or RISP diet. n = 9 or 10; F(2, 34) = 409.2; two-way ANOVA; P < 0.001. (D) H&E staining in mice after 16-wk treatment of the Ctrl or RISP diet. Scale bar is 100 µm. (E–H) Plasma levels of insulin (E), leptin (F), triglyceride (G), and NEFA (H) in mice after 16-wk treatment of the Ctrl or RISP diet. n = 9 or 10. (I) Meal size. Left: traces of continuous measurement in metabolic cages; right: summarized daily average (binned into 12-h light and dark phases) before (black) and after (red) the dietary switch; n = 12; two-way ANOVA; F(1, 22) = 7.452; P = 0.012. *, P < 0.05; **, P < 0.01; and ***, P < 0.001. Two-way ANOVA with Sidak’s post hoc tests in A–C and I. Unpaired t test in E–H. All data were verified in at least two independent experiments. C, control; gWAT, gonadal white adipose tissue; iWAT, inguinal white adipose tissue; R, risperidone. Data are presented as mean ± SEM.
Figure 1.
Figure 1.
Chronic exposure to risperidone causes obesity and glucose intolerance in C57BL/6 mice. (A) Body weight of wild-type C57BL/6 mice fed either the Ctrl or the risperidone (RISP) diet; n = 9 or 10; two-way ANOVA; F(16, 272) = 25.53; P < 0.001. (B) Body composition of mice in A after 16-wk treatment with the Ctrl or RISP diet; n = 9 or 10; two-way ANOVA; F(1, 17) = 13.9; P = 0.002. (C) GTT after 16-wk treatment with the Ctrl or RISP diet; n = 9 or 10; two-way ANOVA; F(5, 85) = 8.224; P < 0.001. (D) ITT after 16-wk treatment with the Ctrl or RISP diet; n = 9 or 10; two-way ANOVA; F(5, 85) = 6.334; P < 0.001. (E–H) Left: traces of continuous measurement in metabolic cages; right: summarized daily average (binned into 12-h light and dark phases) before (black) and after (red) the dietary switch. (E) Physical activity, F(1, 22) = 41.49; P < 0.001. (F) EE, F(1, 22) = 26.64; P < 0.001. (G) Respiratory exchange ratio, F(1, 22) = 8.01; P = 0.01). (H) Food intake, F(1, 22) = 5.982; P < 0.05; n = 12. (I–K) A 28-d PF experiment. Body weight (I; n = 8 or 9; two-way ANOVA; F[56, 643] = 9.425; P < 0.001) and food intake (K; two-way ANOVA; F[56, 588] = 3.597; P < 0.001) were measured daily, and body composition (J; n = 8 or 9; two-way ANOVA; F[2, 46] = 7.505; P = 0.002) was measured at the end of the experiment. *, P < 0.05; **, P < 0.01; and ***, P < 0.001. Two-way ANOVA with Sidak’s post hoc tests in A–K. All data were verified in at least two independent experiments. RER, respiratory exchange ratio. Data are presented as mean ± SEM.
Figure 2.
Figure 2.
A hypothalamic gene expression signature associated with chronic risperidone treatment. (A) Volcano plot showing 65 DEGs between Ctrl_Ad.lib and RISP_Ad.lib mice; green, down-regulated, red up-regulated. (B and C) Gene Ontology (GO; B) and Kyoto Encyclopedia of Genes and Genomes (KEGG; C) analyses of DEGs in A showing enriched biological pathways and physiological functions. (D) Volcano plot showing 97 DEGs between Ctrl_Ad.lib and RISP_PF mice; green, down-regulated, red up-regulated. (E) Heat-map of the expression of 10 common DEGs that were down-regulated or up-regulated in both RISP_PF and RISP_Ad.lib mice. Each row shows the relative expression of a DEG in individual mice. (F and G) qPCR analyses of hypothalamic gene expression. (G) Expression of Mc4r in risperidone-fed mice was 79% compared with that in mice fed the control diet. *, P < 0.05; **, P < 0.01; ***, P < 0.001. One-way ANOVA with Sidak’s post hoc tests in F. Unpaired t test in G. Data in F and G were verified in three independent experiments. Agrp, agouti-related peptide; C, control; FC, fold change; p.adjust, adjusted P value; Htr1b, serotonin 1b receptor; Npy, neuropeptide Y; R, risperidone. Data are presented as mean ± SEM in F and G.
Figure 3.
Figure 3.
Risperidone acts on hypothalamic MC4Rs/Mc4r-expressing neurons to cause weight gain. (A) Body weight of Mc4rSim1-KO mice fed the control (C), risperidone (R), or olanzapine (O) diet; n = 14 or 15; two-way ANOVA; F(22, 427) = 2.12; P = 0.46. (B) Body composition of mice in A after 10-wk treatment of the C, R, or O diet; n = 14 or 15; two-way ANOVA; F(1, 54) = 0.4843; P = 0.49. (C) Daily food intake in the first 28 d of treatment with the C, R, or O diet; n = 4 or 5; two-way ANOVA; F(30, 240) = 1.022; P = 0.44. (D) Fast-induced refeeding in risperidone-fed Mc4rSim1-KO mice; n = 5; one-way ANOVA; F(2, 12) = 0.3575; ***, P < 0.001. (E) Bright-field, fluorescent illumination (TRITC [tetramethylrhodamine isothiocyanate] for Mc4r-T2A-Cre::tdTomato; FITC for Alexa Fluor 488) and the merged image of a targeted MC4RPVH neuron for whole-cell patch-clamp experiments. Arrows indicate the targeted cell. Scale bars are 10 µm. (F) Acute effects of RISP (10 µM) on MC4RPVH neurons. (G) Acute effects of RISP in the presence of tetrodotoxin (TTX; 0.5 µM), kynurenic acid (1 mM), and picrotoxin (50 µM). SB, synaptic blocker. (H) Voltage responses to hyperpolarizing current steps (from −25 pA to 0 pA, applied as indicated by arrows in G. (I) Current-voltage relationship demonstrates RISP-induced decreases of input resistance. Erev = reversal potential. (J) Pretreatment with JKC-363 (20 nM, an MC4R antagonist) blocked the acute effects of RISP. (K) Co-treatment with setmelanotide (100 nM, an MC4R agonist) blocked the acute effects of RISP. (L) Bar graphs summarize the acute effects of RISP. The dashed line in F, G, J, and K indicates resting membrane potential. Data are presented as mean ± SEM. ****, P < 0.0001. One-way ANOVA with Sidak’s post hoc tests. All data were verified in at least two independent experiments.
Figure S2.
Figure S2.
Chronic treatment of risperidone or olanzapine did not change plasma levels of insulin, leptin, triglyceride, or NEFA in Mc4rSim1-KO mice. (A–D) Plasma levels of insulin (A), leptin (B), triglyceride (C), and NEFA (D) in mice treated with the control (C), risperidone (R), or olanzapine (O) diet; n = 9. One-way ANOVA with Sidak’s post hoc tests. All data were verified in at least two independent experiments. Data are presented as mean ± SEM.
Figure S3.
Figure S3.
Risperidone inhibits PVH non-MC4R neurons independently of MC4R. (A) Bright-field, fluorescent illumination (TRITC [tetramethylrhodamine isothiocyanate] for Mc4r-T2A-Cre::tdTomato; FITC for Alexa Fluor 488) and the merged image for whole-cell patch-clamp experiments. Arrows indicate the targeted cell. Arrowheads indicate MC4R-positive cells. Scale bars are 10 µm. (B) Acute effects of RISP (10 µM) on PVH non-MC4R neurons. (C) Acute effects of RISP in the presence of JKC-363 (20 nM). (D) Bar graphs summarize the acute effects of RISP. The dashed line in B and C indicates resting membrane potential. Data are presented as mean ± SEM. Unpaired t test. All data were verified in at least two independent experiments.
Figure 4.
Figure 4.
Setmelanotide mitigates hyperphagia and obesity in risperidone- and olanzapine-fed mice. (A) Refeeding after an i.p. dose of setmelanotide (SET; 2 mg/kg) or saline in Mc4rfl/fl and Mc4rSim1-KO mice after an overnight fast; n = 6–14; two-way ANOVA; F(1, 36) = 4.651; P > 0.999. (B) Daily food intake in risperidone-fed wild-type mice treated with SET or saline (mini-pumps); n = 9 or 10; two-way ANOVA; F(1, 15) = 14.46; P = 0.002. (C) Changes in body weight before and after the 14-d treatment with SET or saline; n = 9; two-way ANOVA; F(2, 25) = 9.995; P < 0.001. (D) Body composition in risperidone-fed mice after the 14-d treatment with SET or saline; n = 9 or 10; two-way ANOVA; F(2, 50) = 4.215; P = 0.034. (E) GTT in risperidone-fed mice after the 14-d treatment with SET or saline; n = 10; F (18, 90) = 5.378; two-way ANOVA; P < 0.001. (F) Daily food intake in olanzapine-fed wild-type mice treated with SET or saline (mini-pumps); n = 8; two-way ANOVA; F(1, 14 = 7.734; P = 0.015. (G) Changes in body weight before and after the 14-d treatment with SET or saline; n = 8; two-way ANOVA; F(1, 14) = 14.17; P = 0.002. (H) Body composition in olanzapine-fed mice after the 14-d treatment with SET or saline; n = 8; two-way ANOVA; F(1, 14) = 16.70; P = 0.0011. (I) Open field test measuring amphetamine-induced hyperlocomotion in mice pretreated with saline, SET, RISP, or RISP + SET; n = 12; two-way ANOVA; F(357, 5236) = 1.683; P < 0.001. Saline versus RISP, P = 0.002; RISP versus RISP + SET, P > 0.999. *, P < 0.05; **, P < 0.01; ***, P < 0.001. Two-way ANOVA with Sidak’s post hoc tests. All data were verified in at least two independent experiments.

References

    1. Angrist, B., Rotrosen J., and Gershon S.. 1980. Responses to apomorphine, amphetamine, and neuroleptics in schizophrenic subjects. Psychopharmacology (Berl.). 67:31–38. 10.1007/BF00427592 - DOI - PubMed
    1. Balthasar, N., Dalgaard L.T., Lee C.E., Yu J., Funahashi H., Williams T., Ferreira M., Tang V., McGovern R.A., Kenny C.D., et al. . 2005. Divergence of melanocortin pathways in the control of food intake and energy expenditure. Cell. 123:493–505. 10.1016/j.cell.2005.08.035 - DOI - PubMed
    1. Chen, K.Y., Muniyappa R., Abel B.S., Mullins K.P., Staker P., Brychta R.J., Zhao X., Ring M., Psota T.L., Cone R.D., et al. . 2015. RM-493, a melanocortin-4 receptor (MC4R) agonist, increases resting energy expenditure in obese individuals. J. Clin. Endocrinol. Metab. 100:1639–1645. 10.1210/jc.2014-4024 - DOI - PMC - PubMed
    1. Clément, K., Biebermann H., Farooqi I.S., Van der Ploeg L., Wolters B., Poitou C., Puder L., Fiedorek F., Gottesdiener K., Kleinau G., et al. . 2018. MC4R agonism promotes durable weight loss in patients with leptin receptor deficiency. Nat. Med. 24:551–555. 10.1038/s41591-018-0015-9 - DOI - PubMed
    1. Collet, T.H., Dubern B., Mokrosinski J., Connors H., Keogh J.M., Mendes de Oliveira E., Henning E., Poitou-Bernert C., Oppert J.M., Tounian P., et al. . 2017. Evaluation of a melanocortin-4 receptor (MC4R) agonist (Setmelanotide) in MC4R deficiency. Mol. Metab. 6:1321–1329. 10.1016/j.molmet.2017.06.015 - DOI - PMC - PubMed

Publication types

MeSH terms