. 2021 May 27;125(20):5243-5257.
doi: 10.1021/acs.jpcb.1c02102. Epub 2021 May 12.

Intersection of Biotic and Abiotic Sulfur Chemistry Supporting Extreme Microbial Life in Hot Acid

Affiliations

Intersection of Biotic and Abiotic Sulfur Chemistry Supporting Extreme Microbial Life in Hot Acid

Daniel J Willard et al. J Phys Chem B. .

Abstract

Microbial life on Earth exists within wide ranges of temperature, pressure, pH, salinity, radiation, and water activity. Extreme thermoacidophiles, in particular, are microbes found in hot, acidic biotopes laden with heavy metals and reduced inorganic sulfur species. As chemolithoautotrophs, they thrive in the absence of organic carbon, instead using sulfur and metal oxidation to fuel their bioenergetic needs, while incorporating CO2 as a carbon source. Metal oxidation by these microbes takes place extracellularly, mediated by membrane-associated oxidase complexes. In contrast, sulfur oxidation involves extracellular, membrane-associated, and cytoplasmic biotransformations, which intersect with abiotic sulfur chemistry. This novel lifestyle has been examined in the context of early aerobic life on this planet, but it is also interesting when considering the prospects of life, now or previously, on other solar bodies. Here, extreme thermoacidophily (growth at pH below 4.0, temperature above 55 °C), a characteristic of species in the archaeal order Sulfolobales, is considered from the perspective of sulfur chemistry, both biotic and abiotic, as it relates to microbial bioenergetics. Current understanding of the mechanisms involved are reviewed which are further expanded through recent experimental results focused on imparting sulfur oxidation capacity on a natively nonsulfur oxidizing extremely thermoacidophilic archaeon, Sulfolobus acidocaldarius, through metabolic engineering.


Figures
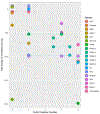
Figure 1:
Figure 1:
Distribution of oxidation states and ΔGf0 of various sulfur species; APS: adenylyl sulfate, GSH: glutathione, GSSH: glutathione disulfide, PAPS: phosphoadenylyl sulfate
Figure 2:
Figure 2:
Schematic of Sulfolobales enzymes involved in sulfur oxidation; solid lines indicate enzymatic reactions, dashed lines indicate abiotic formation of thiosulfate, dashed-dotted lines indicate a shared sulfur species between reactions; Gray barrier represents the cell membrane, with cytoplasmic space below the barrier and extracellular space above.
Figure 3:
Figure 3:
Minimalist representation of RISC reactions involved in Sulfolobales sulfur oxidation; Blue lines indicate abiotic reactions; Red lines indicate enzymatic reactions; Green lines indicate abiotic reactions also catalyzed by enzymes.
Figure 4:
Figure 4:
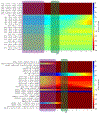
ΔGrxn(kJ/mol) for RISC reactions at pH increments of 0.5 pH; Color scale boundaries are 50 and −50 kJ/mol, and any ΔGrxn exceeding these values are shown at the bounds of the color scale; Purple shading indicates extracellular pH conditions; Green shading indicates cytoplasmic pH conditions; (Top): polysulfide chain-sizing from Reaction 20; (Bottom): RISC Reactions 1-19, excluding Reaction 9.
Figure 5:
Figure 5:
a) Non-phosphorylative Entner-Doudoroff pathway (NPED); b) Representative sulfur oxidation pathway; c) Cumulative free energy change by reaction step for glycolysis (blue), NPED (orange), and sulfur oxidation (gray); d) Overall percent energy conservation of pathways (gray) based on free energy change of total combustion or oxidation of substrate (orange) and free energy change of enzymatic pathway (blue).
Figure 6:
Figure 6:
Reduction potential of enzymatic sulfur half-reactions (green) and energy carrier half-reactions (orange); bars represent the physiological range of reactant/product ratios; vertical lines in each bar represent the equimolar transformed reduction potential of the half-reaction.
Figure 7:
Figure 7:
a) Growth curves of Saci MW001 (blue) and RK34 (red) on amino acids without sulfur (circles) and with sulfur (triangles); Logistic equation models for the data are shown as solid lines (without sulfur) or dotted lines (with sulfur); values for the logistic equation parameters are shown in the insert, where “NS” indicates the no-sulfur condition and “S0” indicates the sulfur condition. b) Plot of principle components 1 and 2 from principle component analysis of growth curves
Figure 8:
Figure 8:
Final pH measurement of serum bottles for Saci MW001 without sulfur (pH 6, top left), Saci MW001 with sulfur (pH 5.5, top right), Saci RK34 without sulfur (pH 5.5, bottom left), and Saci RK34 with sulfur (pH 2, bottom right).

Similar articles

Cited by

References

    1. Counts JA; Willard DJ; Kelly RM, Life in hot acid: a genome-based reassessment of the archaeal order Sulfolobales. Environ Microbiol 2020. - PMC - PubMed
    1. Wheaton G; Counts J; Mukherjee A; Kruh J; Kelly R, The Confluence of Heavy Metal Biooxidation and Heavy Metal Resistance: Implications for Bioleaching by Extreme Thermoacidophiles. Minerals-Basel 2015, 5 (3), 397–451.
    1. Mcdonough WF; Sun SS, The Composition of the Earth. Chem Geol 1995, 120 (3-4), 223–253.
    1. King PL; McLennan SM, Sulfur on Mars. Elements 2010, 6 (2), 107–112.
    1. Elemental Sulfur: Chemistry and Physics. Interscience Publishers: 1965.

Publication types