. 2021 Jun 2;13(596):eabf8654.
doi: 10.1126/scitranslmed.abf8654. Epub 2021 May 11.

High titers and low fucosylation of early human anti-SARS-CoV-2 IgG promote inflammation by alveolar macrophages

Affiliations

High titers and low fucosylation of early human anti-SARS-CoV-2 IgG promote inflammation by alveolar macrophages

Willianne Hoepel et al. Sci Transl Med. .

Abstract

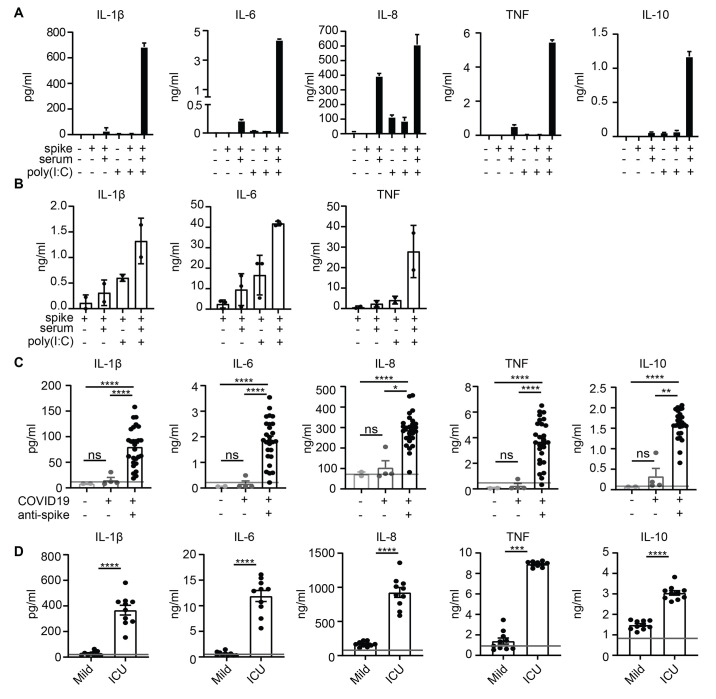
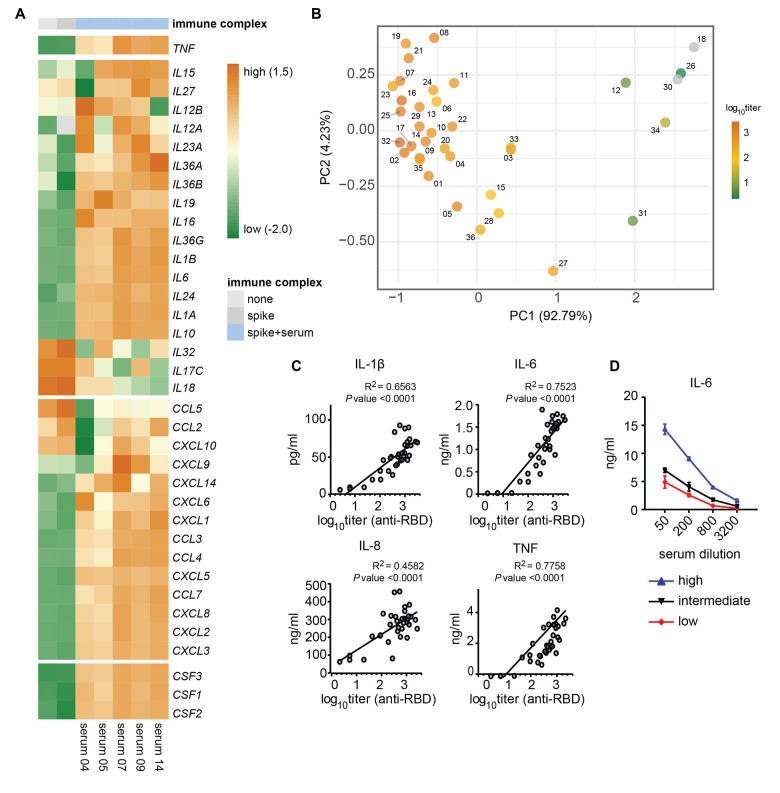
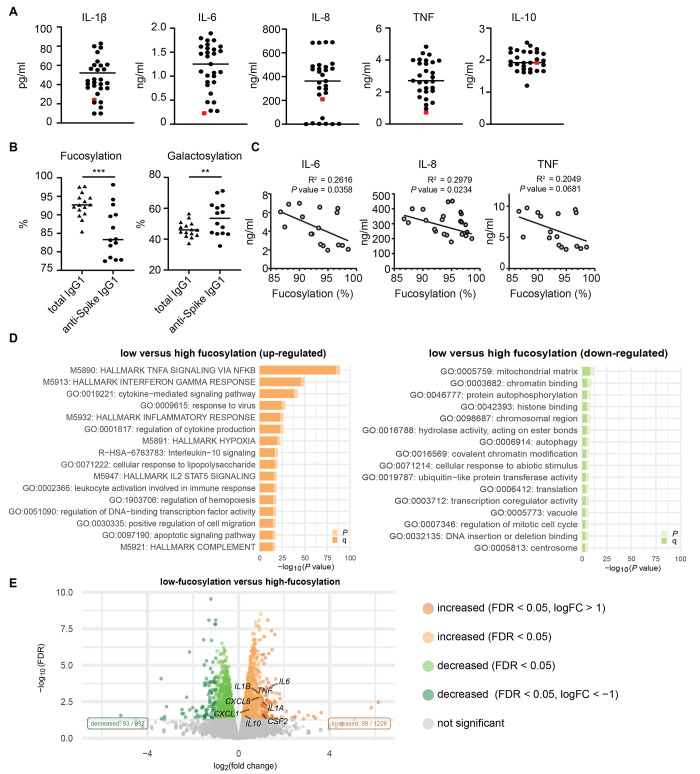
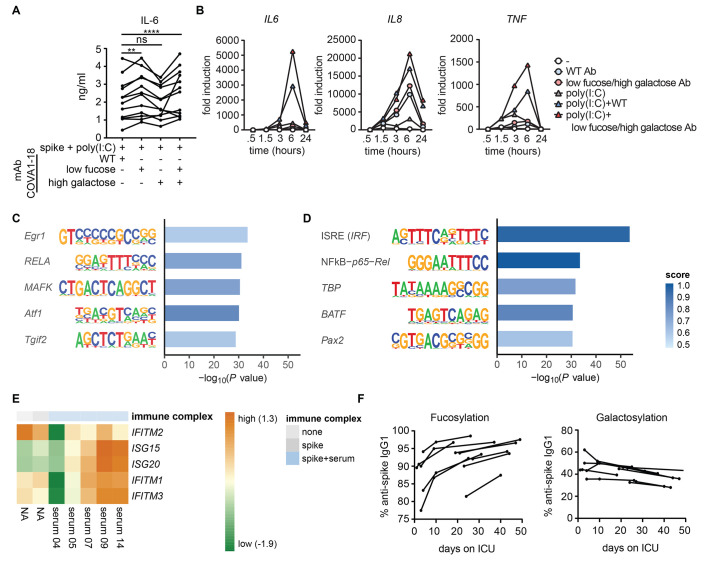
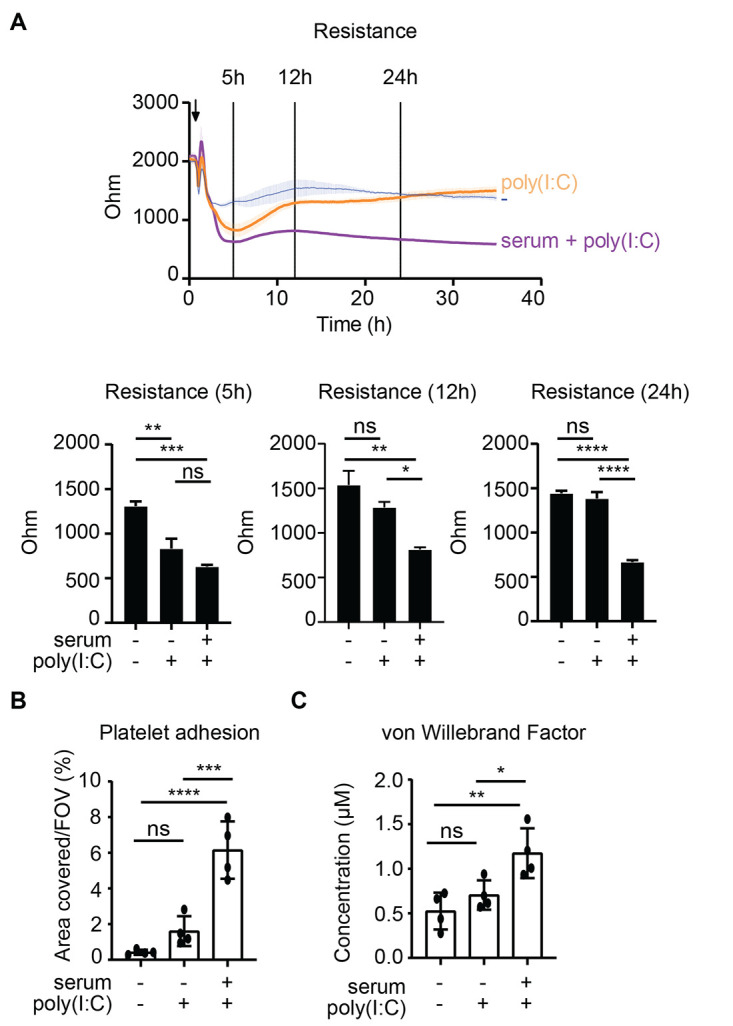
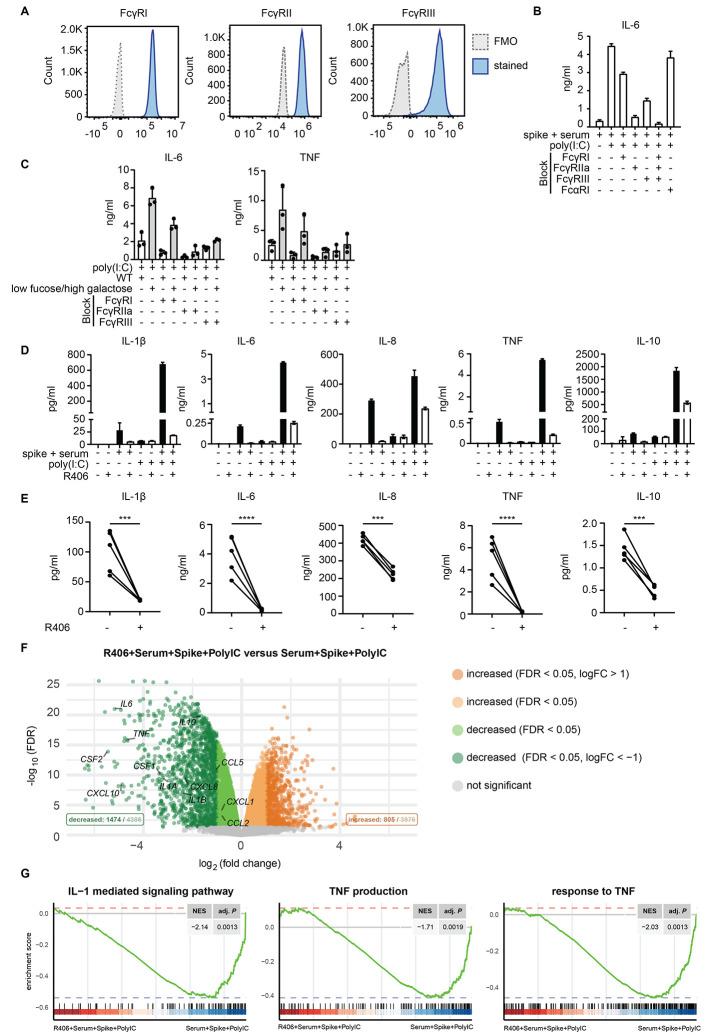
Patients diagnosed with coronavirus disease 2019 (COVID-19) become critically ill primarily around the time of activation of the adaptive immune response. Here, we provide evidence that antibodies play a role in the worsening of disease at the time of seroconversion. We show that early-phase severe acute respiratory distress syndrome coronavirus 2 (SARS-CoV-2) spike protein-specific immunoglobulin G (IgG) in serum of critically ill COVID-19 patients induces excessive inflammatory responses by human alveolar macrophages. We identified that this excessive inflammatory response is dependent on two antibody features that are specific for patients with severe COVID-19. First, inflammation is driven by high titers of anti-spike IgG, a hallmark of severe disease. Second, we found that anti-spike IgG from patients with severe COVID-19 is intrinsically more proinflammatory because of different glycosylation, particularly low fucosylation, of the antibody Fc tail. Low fucosylation of anti-spike IgG was normalized in a few weeks after initial infection with SARS-CoV-2, indicating that the increased antibody-dependent inflammation mainly occurs at the time of seroconversion. We identified Fcγ receptor (FcγR) IIa and FcγRIII as the two primary IgG receptors that are responsible for the induction of key COVID-19-associated cytokines such as interleukin-6 and tumor necrosis factor. In addition, we show that anti-spike IgG-activated human macrophages can subsequently break pulmonary endothelial barrier integrity and induce microvascular thrombosis in vitro. Last, we demonstrate that the inflammatory response induced by anti-spike IgG can be specifically counteracted by fostamatinib, an FDA- and EMA-approved therapeutic small-molecule inhibitor of Syk kinase.


Figures

Fig. 1
Fig. 1. High titers of anti-spike IgG induce inflammation by macrophages.
(A) Cytokine production by human macrophages after 24 hour stimulation with combinations of spike protein, COVID-19 serum (50x diluted), and poly(I:C). Triplicate values from a representative experiment with serum from five different COVID-19 patients and two different macrophage donors (mean+SD). (B) Cytokine production by primary alveolar macrophages obtained from BAL, stimulated as in (A). Every dot represents cytokine production after 24 hours by a different macrophage donor performed in triplicate (mean±SEM). (C) Macrophages stimulated with spike protein and poly(I:C) were co-stimulated with serum from patients in the ICU for lung disease that either did not have COVID-19 (n=2), had COVID-19 but were negative for anti-spike IgG (n=4), or had COVID-19 and were positive for anti-spike IgG (n=27). Horizontal grey line depicts cytokine induction upon stimulation with poly(I:C)+spike protein. Significance was calculated with Brown-Forsythe and Welch’s ANOVA test and corrected by Dunnett T3 test for multiple test correction (mean±SEM). (D) Macrophages stimulated with spike protein and poly(I:C) were co-stimulated with serum isolated from patients with mild COVID-19 (n=10) and were compared to serum from patients in the ICU for COVID-19 (n=10). Significant differences were calculated with an unpaired t test. Each dot represents cytokine production after 24 hours by macrophages stimulated with a different serum donor (mean±SEM). Horizontal grey line depicts cytokine induction upon stimulation with poly(I:C) plus spike protein. *P<0.05; **P<0.01; ***P<0.001; ****P<0.0001; ns=not significant.
Fig. 2
Fig. 2. High titers of anti-spike IgG induce inflammation by macrophages.
(A) Heatmap showing scaled log2 expression (z-score) of genes assessed by RNA sequencing after a 6 hour stimulation of human macrophages with poly(I:C) with or without spike protein and serum from five patients with COVID-19 that tested positive for anti-spike IgG. (B) Principal component analysis of the combined cytokine profile (IL-1β, IL-6, IL-8, IL-10, TNF, IFN-β, IFN-γ, CXCL10) for all serum samples overlaid with log10 anti-RBD IgG titers. Titers of each serum sample is represented by the color scale. Samples with anti-RBD IgG titer below detection limit were colored gray. Numbers represent the patients sample number. (C) Correlation graphs of anti-RBD IgG titer from COVID-19 serum against cytokine production of macrophages after stimulation. The square of Pearson correlation coefficient (R2) and P-value are stated in each graph. (D) Macrophages stimulated with spike protein and poly(I:C) were co-stimulated with different dilutions of serum from patients with varying anti-spike titers. Titers were from patient 2 (high titer), 5 (intermediate titer) or 6 (low titer). IL-6 production was determined after 24 hours.
Fig. 3
Fig. 3. Low fucosylation of IgG correlates with enhanced anti-spike IgG-induced inflammation.
(A) Macrophages stimulated with spike protein and poly(I:C) were co-stimulated with either 50x diluted serum from different anti-spike+ patients with COVID-19 (black dots), or with recombinant anti-spike antibody COVA1-18 (red dot). Representative example of 4 independent macrophages donors is shown. Cytokine production was measured after 24 hours. (B) Fucosylation and galactosylation of total and anti-spike specific IgG1 antibodies. Statistics were calculated with a paired t test. **P < 0.01; ***P <0.001. (C) Correlation graphs of fucosylation percentages of anti-spike IgG1 from COVID-19 serum against cytokine production of macrophages after stimulation. The square of Pearson correlation coefficient (R2) and P-value are stated in each graph. (D) Pathway analysis of differentially expressed genes (DEGs). DEGs were defined by a false discovery rate (FDR) <0.05 and an absolute log2 fold-change higher or lower than 0. Pathway enrichment analyses were performed using the Metascape on 2020-07-29. p=P-value; q=FDR-corrected P-value. (E) Volcano plot depicting up- and down-regulated genes when comparing macrophages stimulated for 6 hours with spike, poly(I:C), and serum with low-fucosylated IgG to the same stimulation with high-fucosylated IgG.
Fig. 4
Fig. 4. Low fucosylation of IgG promotes inflammatory cytokine production.
(A) Macrophages stimulated with spike protein were co-stimulated with combinations of poly(I:C), COVA1-18 (wild-type, recombinant anti-spike IgG1), or COVA1-18 that had been modified to express low fucose or high galactose. IL-6 production was measured after 24 hours. Each line represent 1 macrophage donor, preformed in triplicate. Statistics were calculated with two way ANOVA. **P < 0.01; ****P <0.0001; ns, not significant. (B) Time-dependent fold changes (to 0 hour unstimulated M2 macrophages) in gene expression were depicted in line chart for IL6, IL8, and TNF. Macrophages stimulated with poly(I:C) were co-stimulated with immune complexes of wild-type antibody or an antibody that had been modified to express low fucose or high galactose. Representative example of 6 independent macrophages donors is shown. Cytokine production was measured after 0.5, 1.5, 3, 6 and 24 hours.(C) Enriched motifs for significantly up-regulated genes when comparing macrophages stimulated for 6 hours with spike and poly(I:C), with or without anti-spike IgG. (D) Enriched motifs for significantly up-regulated genes when comparing macrophages stimulated for 6 hours with spike, poly(I:C), and serum with low-fucosylated IgG to the same stimulation with high-fucosylated IgG. (E) Heatmap showing scaled log2 expression (z-score) of IFN-stimulated genes assessed by RNA sequencing after a 6 hour stimulation of human macrophages with poly(I:C) with or without spike protein and serum from 5 sero-positive patients with COVID-19. (F) IgG1 fucosylation and galactosylation of total and anti-spike specific antibodies was determined in serum samples over time for patients in the ICU with COVID-19. Each line represents one donor.
Fig. 5
Fig. 5. Anti-spike IgG breaks endothelial barrier integrity and activates platelets in vitro.
(A) Human pulmonary arterial endothelial cells were exposed to supernatants of macrophages that were unstimulated or had been stimulated with poly(I:C) and spike protein, with or without serum from patients with COVID-19. Endothelial barrier integrity was quantified by measuring the resistance over time using electrical cell-substrate impedance sensing. Statistics were calculated using an ordinary one-way ANOVA and corrected with Tukey’s comparisons test. (B) Endothelium stimulated as in (A) for 24 hours was perfused with platelets for 5 min, after which the area covered by platelets was quantified. FOV, field of view. (C) Flow supernatant was collected after perfusion under B, and von Willebrand Factor concentrations were measured with ELISA. Statistics were calculated using an ordinary one-way ANOVA and corrected using Sidak’s multiple comparison test. *P<0.05; **P<0.01; ***P<0.001; ****P<0.0001; ns=not significant.
Fig. 6
Fig. 6. Anti-spike IgG-induced inflammation is FcγR dependent and can be counteracted by fostamatinib.
(A) Membrane expression of FcγRI, FcγRII, and FcγRIII by human macrophages was determined by flow cytometry. FMO, fluorescence minus one control. (B) FcγRI, FcγRII, FcγRIII, or FcαRI were blocked by specific antibodies, after which macrophages were stimulated with spike, COVID-19 serum, poly(I:C), or a combination. IL-6 production was measured after 24 hours. Triplicate values from a representative experiment with serum from 3 different patients with COVID-19 and two different macrophage donors (mean±SD). (C) FcγRI, FcγRII, and FcγRIII were blocked by specific antibodies, after which macrophages stimulated with poly(I:C) and immune complexes of wild-type antibody or an antibody that had been modified to express low fucose and high galactose. Each dot represents cytokine production after 24 hours by a different macrophage donor (mean±SEM). (D and E). Macrophages were pre-incubated with Syk inhibitor R406, after which cells were stimulated as in (B). Cytokine production was measured after 24h. A representative donor is shown (D) and data are presented as mean±SD. The response for multiple donors with or without pre-incubation with R406 is shown (E). Every pair of dots represents cytokine production after 24 hours by a different serum donor. Statistics were calculated with a ratio paired t test. ***P<0.001; ****P<0.0001. (F) Volcano plot depicting up- and down-regulated genes when comparing macrophages stimulated for 6 hours with spike, poly(I:C), and serum to the same stimulation in the presence of R406. FDR=false discovery rate. (G) Gene set enrichment analysis (GSEA) of curated gene sets suppressed by R406: interleukin-1-mediated signaling pathway (GO:0070498), TNF production (GO:0032640), response to TNF (GO:0034612). NES stands for normalized enrichment score and adj. P represents the Benjamini-Hochberg (BH)-adjusted P-value.

References

    1. Gandhi R. T., Lynch J. B., Del Rio C., Mild or Moderate Covid-19. N. Engl. J. Med. 383, 1757–1766 (2020). 10.1056/NEJMcp2009249 - DOI - PubMed
    1. Tay M. Z., Poh C. M., Rénia L., MacAry P. A., Ng L. F. P., The trinity of COVID-19: Immunity, inflammation and intervention. Nat. Rev. Immunol. 20, 363–374 (2020). 10.1038/s41577-020-0311-8 - DOI - PMC - PubMed
    1. Merad M., Martin J. C., Pathological inflammation in patients with COVID-19: A key role for monocytes and macrophages. Nat. Rev. Immunol. 20, 355–362 (2020). 10.1038/s41577-020-0331-4 - DOI - PMC - PubMed
    1. Mangalmurti N., Hunter C. A., Cytokine Storms: Understanding COVID-19. Immunity 53, 19–25 (2020). 10.1016/j.immuni.2020.06.017 - DOI - PMC - PubMed
    1. Blanco-Melo D., Nilsson-Payant B. E., Liu W. C., Uhl S., Hoagland D., Møller R., Jordan T. X., Oishi K., Panis M., Sachs D., Wang T. T., Schwartz R. E., Lim J. K., Albrecht R. A., tenOever B. R., Imbalanced Host Response to SARS-CoV-2 Drives Development of COVID-19. Cell 181, 1036–1045.e9 (2020). 10.1016/j.cell.2020.04.026 - DOI - PMC - PubMed

Publication types