. 2022 Apr 1;106(4):806-820.
doi: 10.1097/TP.0000000000003815.

Serum MicroRNA Transcriptomics and Acute Rejection or Recurrent Hepatitis C Virus in Human Liver Allograft Recipients: A Pilot Study

Affiliations

Serum MicroRNA Transcriptomics and Acute Rejection or Recurrent Hepatitis C Virus in Human Liver Allograft Recipients: A Pilot Study

Thangamani Muthukumar et al. Transplantation. .

Abstract

Background: Acute rejection (AR) and recurrent hepatitis C virus (R-HCV) are significant complications in liver allograft recipients. Noninvasive diagnosis of intragraft pathologies may improve their management.

Methods: We performed small RNA sequencing and microRNA (miRNA) microarray profiling of RNA from sera matched to liver allograft biopsies from patients with nonimmune, nonviral (NINV) native liver disease. Absolute levels of informative miRNAs in 91 sera matched to 91 liver allograft biopsies were quantified using customized real-time quantitative PCR (RT-qPCR) assays: 30 biopsy-matched sera from 26 unique NINV patients and 61 biopsy-matched sera from 41 unique R-HCV patients. The association between biopsy diagnosis and miRNA abundance was analyzed by logistic regression and calculating the area under the receiver operating characteristic curve.

Results: Nine miRNAs-miR-22, miR-34a, miR-122, miR-148a, miR-192, miR-193b, miR-194, miR-210, and miR-885-5p-were identified by both sRNA-seq and TLDA to be associated with NINV-AR. Logistic regression analysis of absolute levels of miRNAs and goodness-of-fit of predictors identified a linear combination of miR-34a + miR-210 (P < 0.0001) as the best statistical model and miR-122 + miR-210 (P < 0.0001) as the best model that included miR-122. A different linear combination of miR-34a + miR-210 (P < 0.0001) was the best model for discriminating NINV-AR from R-HCV with intragraft inflammation, and miR-34a + miR-122 (P < 0.0001) was the best model for discriminating NINV-AR from R-HCV with intragraft fibrosis.

Conclusions: Circulating levels of miRNAs, quantified using customized RT-qPCR assays, may offer a rapid and noninvasive means of diagnosing AR in human liver allografts and for discriminating AR from intragraft inflammation or fibrosis due to R-HCV.

Trial registration: ClinicalTrials.gov NCT00135694.


Conflict of interest statement

T.T. is a cofounder of and scientific advisor to Alnylam Pharmaceuticals and a scientific advisor to Regulus Therapeutics. M.S. has a Consultancy Agreement with CareDx, Inc. Brisbane, CA and with Sparks Therapeutics, Philadelphia, PA. The other authors of this article declare no conflicts of interest. The other authors declare no conflict of interests.

Figures

Figure 1.
Figure 1.. Flowchart illustrating the sequential steps used to identify circulating extracellular miRNAs diagnostic of human liver allograft biopsies.
A, NINV Cohort: Total RNA was isolated from 30 sera matched to 30 allograft biopsies from 26 unique liver allograft recipients with nonimmune nonviral (NINV) etiology for their native liver disease. Among the 30 sera, 14 were matched to 14 acute rejection (AR) biopsies from 12 recipients (2 patients had 2 AR biopsies) and 16 were matched to 16 no rejection (NR) biopsies from 14 recipients (1 patient had 2 NR biopsies and 1 patient with an initial AR biopsy had a later NR biopsy and is included in both groups). Table 1 and Table S1A provide additional information regarding the NINV cohort including liver allograft biopsy findings for each biopsy. Barcoded complementary DNA libraries were prepared from the RNA isolated from the biopsy-matched sera and small RNA sequenced for unbiased characterization of the circulating micro RNA (miRNA) transcriptomes. A TaqMan low-density array (TLDA) was used to measure relative levels of 377 mature human miRNAs in sera matched to biopsies. Differential gene abundance analysis was performed to identify miRNAs that discriminate the AR biopsy group from the NR biopsy group. Absolute levels of miRNAs discriminating AR group from NR group were quantified using customized real time quantitative polymerase chain reaction (RT-qPCR) assays. Area under the receiver operating characteristic curve was calculated as a measure of discrimination. Logistic regression analyses were performed and goodness-of-fit using Akaike’s information criterion and Akaike weight were used to evaluate candidate models for discriminating AR group from NR group. Bootstrap analysis was performed for the best-fit models. B, Recurrent Hepatitis C Virus (HCV) Cohort: Total RNA was isolated from 61 sera matched to 61 allograft biopsies from 41 unique liver allograft recipients with HCV native liver disease. Among the 61 sera, 19 were matched to 19 liver allograft biopsies without intragraft inflammation or fibrosis and classified as normal biopsies (recurrent HCV-N); 27 were matched to liver allograft biopsies with intragraft inflammation (recurrent HCV-I); and 15 were matched to 15 liver allograft biopsies with intragraft fibrosis (recurrent HCV-F). Table 6 and Table S1B provide additional information regarding the recurrent HCV cohort including liver allograft biopsy findings for each biopsy. Table 6 also provides information regarding recurrent HCV patients who underwent multiple biopsies with different biopsy classification (eg, HCV-N on initial biopsy and HCV-I in a later biopsy). Total RNA was isolated from each serum sample and absolute levels of miR-34a, miR-122 and miR-210- the components of the 2 diagnostic signatures for discriminating AR biopsies from NR biopsies in the NINV cohort- were quantified using customized RT-qPCR assays. Logistic regression analyses were performed to address the following: (i) Do the best predictors of NINV-AR discriminate recurrent HCV-N group from recurrent HCV-I group or recurrent HCV-F group? (ii) Do the best predictors of AR discriminate NINV-NR group from recurrent HCV-N, recurrent HCV-I, or recurrent HCV-F group? (iii) Do the best predictors of AR discriminate NINV-AR group from recurrent HCV-N, recurrent HCV-I or recurrent HCV-F group?
Figure 2.
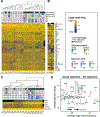
Figure 2.. Heatmap of circulating extracellular micro RNAs in sera matched to liver allograft biopsies, micro RNA expression in selected tissues and cells and differential gene abundance analysis: nonimmune nonviral cohort.
A total of 30 sera matched to 30 liver allograft biopsies were processed for small RNA sequencing and 4 of 30 sera (3 sera matched no Rejection biopsies, N-27, N-55, N-56 and 1 serum matched to acute rejection biopsy, AR-44) did not pass quality control thresholds and were excluded from downstream analysis. Unsupervised hierarchical clustering (Euclidean distance, complete linkage) of circulating extracellular micro RNAs showing individual micro RNAs that constitute the top 80% sequencing reads in the remaining 26 of 30 sera matched to liver allograft biopsies (A); compared to human vascular endothelial cells, liver tissue, red blood cells, and peripheral blood mononuclear cells (B); and of chosen liver-typic micro RNAs (C). Residual micro RNAs are shown as “all-other” at the bottom of each heatmap; samples were clustered by rows and columns, but the row dendrogram is not shown. The inbox indicates the coloring and codes used in panels A-C. MA-plot showing the results of differential gene abundance analysis comparing micro RNAs from the 13 serum samples matched to 13 liver allograft biopsies showing acute rejection with micro RNAs from the 13 serum samples matched to 13 liver allograft biopsies without any rejection changes (no rejection, N) biopsies (D). Micro RNAs in sera from patients with acute rejection compared to sera from patients with no rejection histology are colored red if higher or blue if lower. Micro RNAs on the right side of the 2 vertical dashed lines are composed of 80% or 90% of all sequencing reads across all samples; low abundance micro RNAs further to the left are not shown in this plot. ALP, serum alkaline phosphatase; ALT, serum alanine aminotransferase; AST, serum aspartate aminotransferase; HUVEC, human vascular endothelial cells; PBMC, human peripheral blood mononuclear cells; RBC, human red blood cells.
Figure 3.
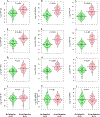
Figure 3.. Violin plots of circulating levels of miRNAs in sera matched to liver allograft biopsies: NINV cohort.
Total RNA was isolated from pristine aliquots of 30 sera for absolute quantification of miRNAs using customized real time quantitative polymerase chain reaction assays. The miRNA copy numbers were normalized using the spiked-in cel-miR-54 copy number (x10−8) in the same serum sample, and the ratio of miRNA copies to cel-miR-54 copies (x10−8) was loge transformed prior to data visualization using violin plots and statistical analysis. In the violin plots, the distribution of the ratios in the 16 sera matched to 16 liver allograft biopsies without histological features of acute rejection (No Rejection, in green) and in the 14 sera matched to 14 acute liver allograft rejection biopsies (Acute Rejection, in pink) is represented by the density shape; the thin black lines show the ratio of messenger RNA copy numbers to cel-miR-54 copy number (x10−8) for each serum sample, and the thick black horizontal line crossing the contour of the violin plot show the mean for that group. the mean for each distribution is shown as a thick black horizontal line crossing the contour of the individual violin plot. The P-values are based on the Mann-Whitney U test comparing the acute rejection group with the no rejection group. miR, microRNA; snRNA, small nuclear RNA.
Figure 4.
Figure 4.. Predicted probability of acute rejection for circulating level of extracellular based statistical models: nonimmune nonviral cohort.
A, Plot shows the predicted probability of acute rejection for given levels of a diagnostic signature based on miR-210 and miR-34a. The y-axis represents the probability of acute rejection. The x-axis represents the diagnostic signature score, which is a linear combination of liver specific miR-210 and miR-34a (normalized by cel-miR-54 (x10−8) and loge transformed), determined by logistic regression analysis (Table S4). The vertical dotted line represents the cut point of the diagnostic signature score that maximized the combined sensitivity and specificity (Youden’s index) to discriminate between sera matched to acute rejection biopsies and sera matched to no rejection biopsies. The value of this cut point is shown at the top of the vertical line. Each serum sample is represented by a colored dot; sera matched to acute rejection biopsies are shown in red and sera matched to no rejection biopsies are shown in green. A comparison of models using Akaike information criterion showed that this miR-210 + miR-34a model is superior to all other 2-miRNA prediction models (Δ Akaike information criterion was ≥ 5.9). The Akaike weight for the combination of miR-210 + miR-34a compared to the 35 other 2-miRNA combinations was 84.0% (Table S4). B-I, Graphs depict the logistic regression model-based linear combination of miR-122 with each of the 8 informative miRNAs. The y-axis represents the probability of acute rejection. The x-axis represents the diagnostic signature score, which is a linear combination of liver specific miR-122 and each of the other 8 miRNAs (normalized by cel-miR-54 (x10−8) and loge transformed), determined by logistic regression analysis (Table 4). The vertical dotted line represents the cut point of the diagnostic signature score that maximized the combined sensitivity and specificity (Youden’s index) to discriminate between sera matched to acute rejection biopsies and sera matched to no rejection biopsies. The value of this cut point is shown at the top of the vertical line. In Panels B-I, each serum sample is represented by a colored dot; sera matched to acute rejection biopsies are shown in red and sera matched to no rejection biopsies are shown in green. A comparison of models using Akaike information criterion showed that the miR-122 + miR-210 combination is superior to all other 2-miRNA prediction models that include miR-122 (Δ Akaike information criterion was ≥ 4.5). The Akaike weight for this combination of miR-122 + miR-210 compared to the other 7 combinations that included miR-122, was 88.5% (Table S4). AUROC, area under the receiver operating characteristic curve; miR, micro RNA.
Figure 5.
Figure 5.. Receiver operating characteristic curve analyses: nonimmune nonviral acute rejection vs recurrent HCV-inflammation and nonimmune nonviral acute rejection vs recurrent-HCV-fibrosis.
Receiver operating characteristic curve analyses portraying the extent to which miR-34a, miR-122, miR-210 and the 2-miRNA combinations distinguish the nonimmune nonviral acute rejection group from the recurrent HCV-inflammation group and from the recurrent-HCV-fibrosis group. For nonimmune nonviral acute rejection vs recurrent HCV-inflammation, the area under the receiver operating characteristic curve (95% CI) for miR-34a was 0.92 (0.84–1.000) (P<0.0001, Figure 5 A); 0.52 (0.31–0.73) for miR-122 (P=0.94, Figure 5B); 0.68 (0.50–85) for miR-210 (P=0.02, Figure 5 C), 1.00 (1.00–1.00) for miR-34a + miR-210 (P=<0.0001, Figure 5 D) and 1.00 (1.00–1.00) for miR-34a + miR-122 (P=<0.0001, Figure 5 E). For nonimmune nonviral acute rejection vs recurrent-HCV-fibrosis, the area under the receiver operating characteristic curve (95% CI) for miR-34a was 0.95 (0.88–1.000) (P <0.0001, Figure 5 F); 0.54 (0.31–0.76) for miR-122 (P=0.74, Figure 5G); 0.76 (0.58–0.94) for miR-210 (P=0.02, Figure 5 H); 0.99 (0.97–1.00) for miR-34a + miR-210 (P<0.0001, Figure 5 I); and 1.00 (1.00–1.00) for miR-34a + miR-122 (P=<0.0001, Figure 5 J). Table 7 shows the Youden’s cutpoint, sensitivity, specificity and accuracy for-miR-34a, miR-122, miR-210 and for the 2-miR models, and their logistic regression equations. HCV, hepatitis C virus; miR, micro RNA.

Comment in

References

    1. Kwong A, Kim WR, Lake JR, et al. OPTN/SRTR 2018 annual data report: liver. Am J Transplant. 2020;20 Suppl s1:193–299. - PubMed
    1. Adams DH, Sanchez-Fueyo A, Samuel D. From immunosuppression to tolerance. J Hepatol. 2015;62(Suppl 1):S170–S185. - PubMed
    1. Cillo U, Bechstein WO, Berlakovich G, et al. Identifying risk profiles in liver transplant candidates and implications for induction immunosuppression. Transplant Rev (Orlando). 2018;32(3):142–150. - PubMed
    1. Levitsky J. Operational tolerance: past lessons and future prospects. Liver Transpl. 2011;17(3):222–232. - PubMed
    1. Demetris AJ, Bellamy C, Hübscher SG, et al. 2016 comprehensive update of the Banff Working Group on liver allograft pathology: introduction of antibody-mediated rejection. Am J Transplant. 2016;16(10):2816–2835. - PubMed

Publication types

Associated data