. 2021 May 12;16(5):e0251363.
doi: 10.1371/journal.pone.0251363. eCollection 2021.

Auditory evoked potentials: Differences by sex, race, and menstrual cycle and correlations with common psychoacoustical tasks

Affiliations

Auditory evoked potentials: Differences by sex, race, and menstrual cycle and correlations with common psychoacoustical tasks

Dennis McFadden et al. PLoS One. .

Abstract

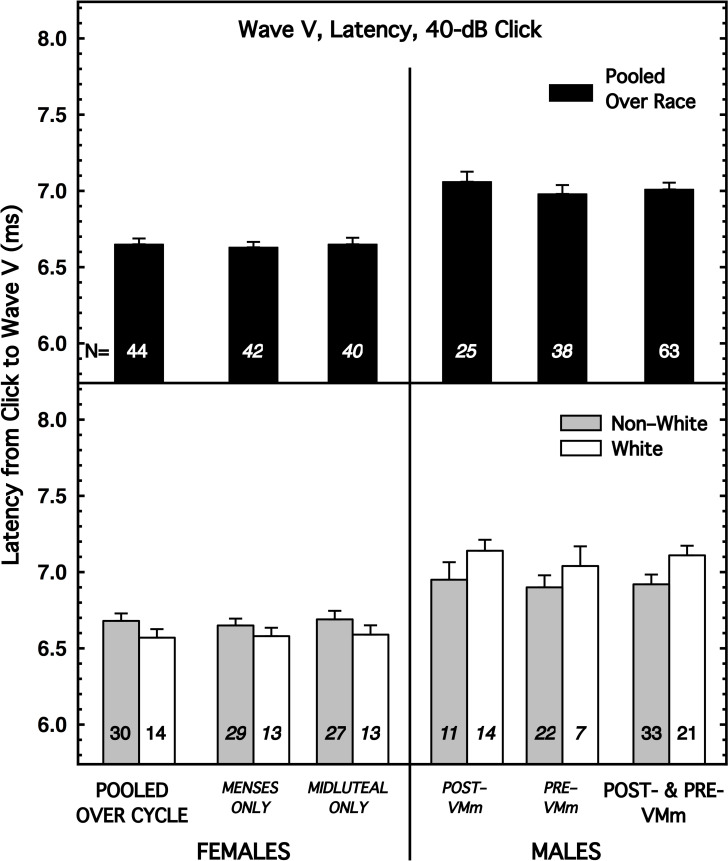
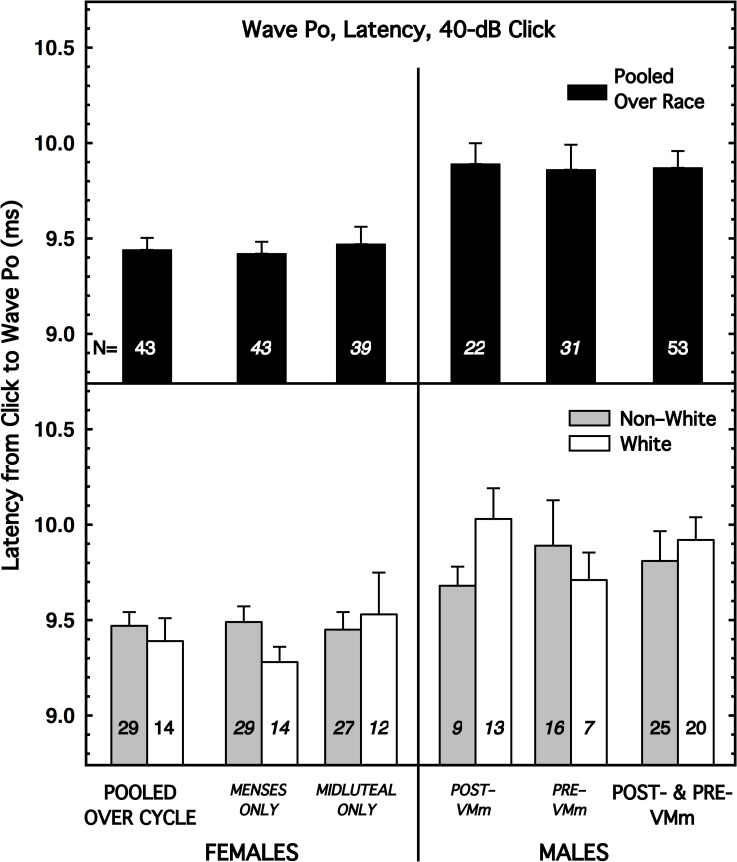
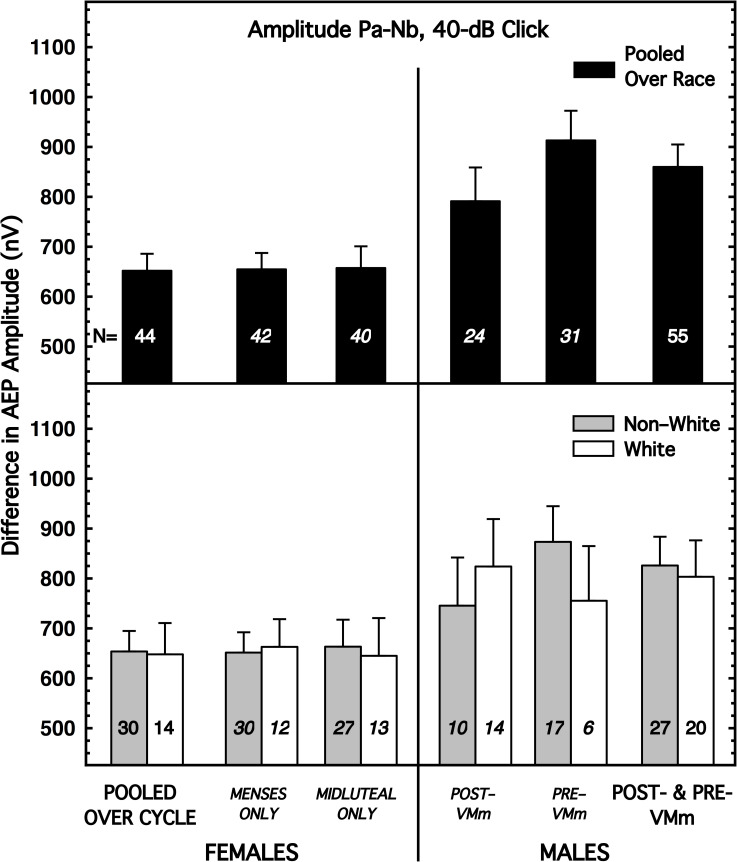
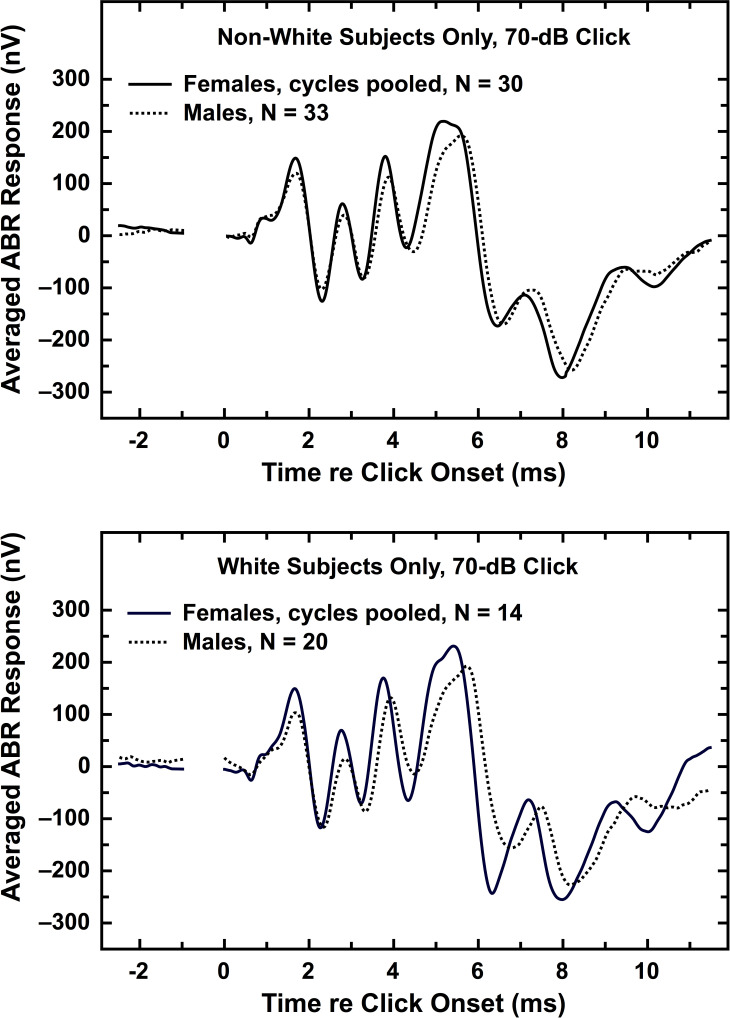
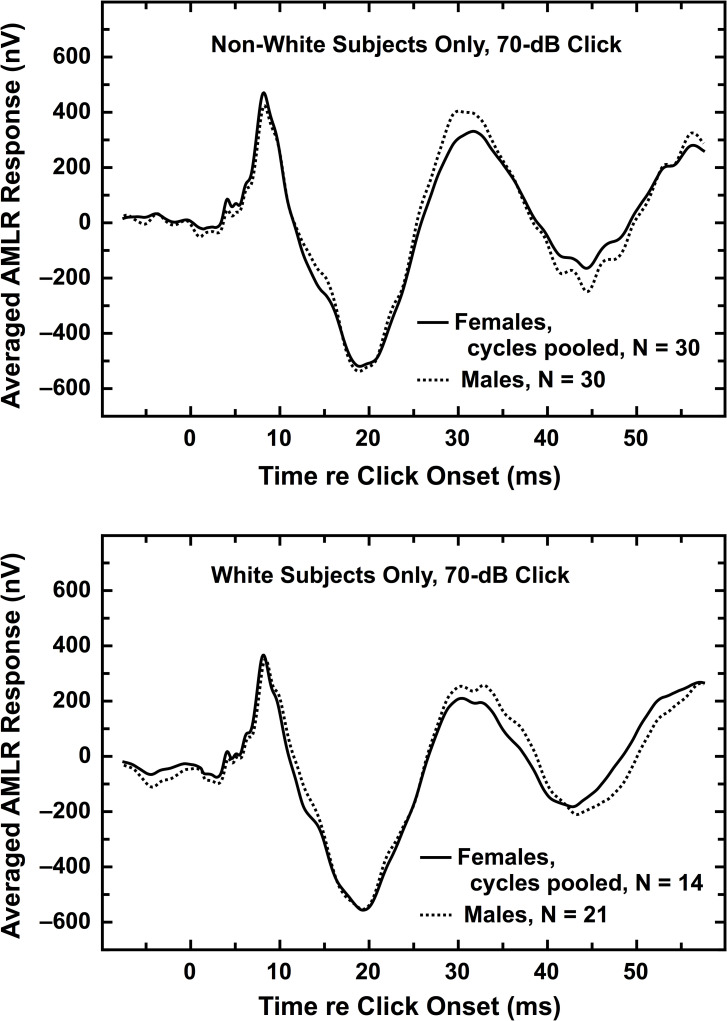
Auditory brainstem responses (ABRs) and auditory middle-latency responses (AMLRs) to a click stimulus were measured in about 100 subjects. Of interest were the sex differences in those auditory evoked potentials (AEPs), the correlations between the various AEP measures, and the correlations between the AEP measures and measures of otoacoustic emissions (OAEs) and behavioral performance also measured on the same subjects. Also of interest was how the menstrual cycle affected the various AEP measures. Most ABR measures and several AMLR measures exhibited sex differences, and many of the former were substantial. The sex differences tended to be larger for latency than for amplitude of the waves, and they tended to be larger for a weak click stimulus than for a strong click. The largest sex difference was for Wave-V latency (effect size ~1.2). When subjects were dichotomized into Non-Whites and Whites, the race differences in AEPs were small within sex. However, sex and race interacted so that the sex differences often were larger for the White subjects than for the Non-White subjects, particularly for the latency measures. Contrary to the literature, no AEP measures differed markedly across the menstrual cycle. Correlations between various AEP measures, and between AEP and OAE measures, were small and showed no consistent patterns across sex or race categories. Performance on seven common psychoacoustical tasks was only weakly correlated with individual AEP measures (just as was true for the OAEs also measured on these subjects). AMLR Wave Pa unexpectedly did not show the decrease in latency and increase in amplitude typically observed for AEPs when click level was varied from 40 to 70 dB nHL (normal Hearing Level). For the majority of the measures, the variability of the distribution of scores was greater for the males than for the females.


Conflict of interest statement

The authors have declared that no competing interests exist.

Figures

Fig 1
Fig 1. Mean latency for Wave V with the 40-dB click, shown for females on the left and males on the right.
The female data are shown pooled over the menstrual cycle (far left; abscissa label not italicized) and also partitioned by cycle. The male data of most interest are at the far right (abscissa label not italicized), but, for consistency, data also are shown separately for the male subjects tested before and after the malfunction of the voltmeter (VM; which was not used for the ABR or AMLR measurements). (top) Subjects are pooled over race. (bottom) Subjects are partitioned by race. The sex difference was larger for the White subjects than for the Non-White subjects. Flags denote standard errors of the mean. Additional ABR measures are illustrated in (S1-S7 Figs in S1 File) [36].
Fig 2
Fig 2. Mean latency for Wave Po with the 40-dB click, shown for females on the left and males on the right.
The female data are shown pooled over the menstrual cycle (far left; abscissa label not italicized) and also partitioned by cycle. The male data of most interest are at the far right (abscissa label not italicized), but, for consistency, data also are shown separately for the male subjects tested before and after the malfunction of the voltmeter (VM; which was not used for the ABR or AMLR measurements). (top) Subjects are pooled over race. (bottom) Subjects are partitioned by race. Flags denote standard errors of the mean. Additional AMLR latency measures are illustrated in (S8-S14 Figs in S1 File) [36].
Fig 3
Fig 3. Mean amplitude for Wave Pa-Nb with the 40-dB click, shown for females on the left and males on the right.
The female data are shown pooled over the menstrual cycle (far left; abscissa label not italicized) and also partitioned by cycle. The male data of most interest are at the far right (abscissa label not italicized), but, for consistency, data also are shown separately for the male subjects tested before and after the malfunction of the voltmeter (VM; which was not used for the ABR or AMLR measurements). (top) Subjects are pooled over race. (bottom) Subjects are partitioned by race. Flags denote standard errors of the mean. Additional AMLR amplitude measures are illustrated in (S15-S19 Figs in S1 File) [36].
Fig 4
Fig 4. Averaged waveforms illustrating the sex differences for ABR, shown separately for the two race groups, using the 70-dB click.
Each panel contains an averaged waveform for females pooled across the menstrual cycle (solid trace) and an averaged waveform for all males (dotted trace). (top panel) Non-White females and males. (bottom panel) White females and males. A 1-ms segment has been deleted from all waveforms during the baseline period in order to remove an electrical artifact. Additional comparisons of averaged waveforms are shown in (S21-S46 Figs in S1 File) [36].
Fig 5
Fig 5. Averaged waveforms illustrating the sex differences for AMLR, shown separately for the two race groups, using the 70-dB click.
Each panel contains an averaged waveform for females pooled across the menstrual cycle (solid trace) and an averaged waveform for all males (dotted trace). (top) Non-White females and males. (bottom) White females and males.

References

    1. McFadden D, Pasanen EG, Maloney MM, Leshikar EM, Pho MH. Differences in common psychoacoustical tasks by sex, menstrual cycle, and race. J Acoust Soc Am. 2018;143: 2338–2354. 10.1121/1.5030998 - DOI - PMC - PubMed
    1. McFadden D, Pasanen EG, Maloney MM, Leshikar EM, Pho MH. Correlations between otoacoustic emissions and performance in common psychoacoustical tasks. J Acoust Soc Am. 2018;143: 2355–2367. 10.1121/1.5030999 - DOI - PMC - PubMed
    1. Hall JW III. eHandbook of auditory evoked responses: Principles, procedures and protocols. New York: Kindle Direct Publishing; 2015. ASIN: B011J59898
    1. Jerger J, Hall J. Effects of age and sex on auditory brainstem response. Arch Otolaryngol. 1980;106: 387–391. 10.1001/archotol.1980.00790310011003 - DOI - PubMed
    1. Chan YW, Woo EKW, Hammond SR, Yiannikas C, McLeod JG. The interaction between sex and click polarity in brain-stem auditory potentials evoked from control subjects of Oriental and Caucasian origin. Electroencephalog Clin Neurophysiol. 1988;71: 77–80. 10.1016/0168-5597(88)90022-6 - DOI - PubMed

Publication types

LinkOut - more resources