. 2021 May 11;54(5):916-930.e7.
doi: 10.1016/j.immuni.2021.04.011.

Six distinct NFκB signaling codons convey discrete information to distinguish stimuli and enable appropriate macrophage responses

Affiliations

Six distinct NFκB signaling codons convey discrete information to distinguish stimuli and enable appropriate macrophage responses

Adewunmi Adelaja et al. Immunity. .

Abstract

Macrophages initiate inflammatory responses via the transcription factor NFκB. The temporal pattern of NFκB activity determines which genes are expressed and thus, the type of response that ensues. Here, we examined how information about the stimulus is encoded in the dynamics of NFκB activity. We generated an mVenus-RelA reporter mouse line to enable high-throughput live-cell analysis of primary macrophages responding to host- and pathogen-derived stimuli. An information-theoretic workflow identified six dynamical features-termed signaling codons-that convey stimulus information to the nucleus. In particular, oscillatory trajectories were a hallmark of responses to cytokine but not pathogen-derived stimuli. Single-cell imaging and RNA sequencing of macrophages from a mouse model of Sjögren's syndrome revealed inappropriate responses to stimuli, suggestive of confusion of two NFκB signaling codons. Thus, the dynamics of NFκB signaling classify immune threats through six signaling codons, and signal confusion based on defective codon deployment may underlie the etiology of some inflammatory diseases.

Keywords: Hopf bifurcation analysis; immune sentinel cells; live cell imaging; machine learning classification; mathematical modeling; mutual information; pathogen-associated molecular patterns; response specificity; signaling dynamics; tumor necrosis factor.


Conflict of interest statement

Declaration of interests The authors declare no competing interests.

Figures

Figure 1.
Figure 1.. Complex NFκB dynamics induced by diverse immune threats
(A) Schematic of the innate immune signaling network activating NFκB. Environmental information is transmitted via ligand-specific signaling pathways that converge on a few key transcription factors, including NFκB, but produce stimulus-specific physiological responses. (B) Workflow diagram: a reporter mouse line expressing mVenus-RelA (RelAV/V) was generated. Bone-marrow-derived macrophages (BMDMs) were differentiated, imaged, tracked, and quantified in multiple stimulus conditions. (C) Single-cell heatmaps of fluorescent nuclear NFκB levels over time, in BMDMs expressing endogenously tagged mVenus-RelA, in response to 10 ng/mL TNF or LPS. Each row is one cell’s NFκB trajectory. (D) Table indicating the number of single-cell NFκB trajectories quantified in each indicated experimental condition. This analysis involved 12,203 cell trajectories produced by quantifying more than 3 million cell images. More details in Table S2. All single-cell imaging data were confirmed, here and elsewhere, with at least two independent experiments per condition. (E) First-harmonic distributions for other stimuli. Shaded region corresponds to the period of 1–2.2 h that is characteristic of NFκB oscillations. (F) Fraction of cells in which a response is detected, by stimulus and dose. (G) Fraction of responder cells that show characteristic NFκB oscillations.
Figure 2.
Figure 2.. Informative features within complex NFκB dynamics
(A) Examples of metrics to be employed in an information theoretic analysis. Two single-cell NFκB responses (to LPS in red, and to TNF in blue) are shown. All NFκB trajectories were characterized using 918 metrics (Table S3). (B) Channel capacity as a function of the number of most informative metrics (Table S4), either using the entire dataset of all ligand types and doses (black line) or using the dose response data for each indicated ligand. Channel capacity is a correlation score based in information theory; it indicates the degree to which a metric of NFκB dynamics or a combination of such metrics are correlated with the stimulus condition, defined by ligand identity and dose. (C) Dynamical features that are informative about ligand and dose, as revealed by the seven metrics selected by the information theoretic analysis. E: early activity; L: late activity. (D) Average probability distribution from the channel capacity calculations using all optimal vectors. Probabilities sum to 1 and indicate the input distribution that leads to a computationally maximized mutual information.
Figure 3.
Figure 3.. Six NFκB signaling codons are sufficient to classify immune threats
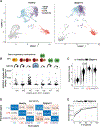
(A) Violin plots of dynamical features that optimally encode stimulus-specific NFκB dynamics: activation speed, peak amplitude, oscillatory dynamics, total activity, duration, and ratio of early to late activity. These are termed “signaling codons,” and they are deployed in a stimulus-specific manner, as shown. (B) Top: schematic of supervised machine learning approach to predict ligand identity using NFκB dynamics. Bottom: F1 scores (harmonic mean of precision and recall) of ligand predictions using either all features or signaling codons alone or random. Models are evaluated on out-of-bag observations. (C) F1 score of dose predictions for each indicated ligand using either all features or only six signaling codons. (D) The effect of each signaling codon on the certainty of ligand prediction: the loss in classification confidence when the indicated signaling codon is missing from the set of six (versus all features). Mean classification margin: probability of the correct class minus the highest probability of the incorrect classes; ΔMean Margin: difference in mean classification margin of codon classifier versus all predictors classifier; ΔΔMean Margin: difference in ΔMean Margins when using a classifier with all six signaling codons and with classifiers lacking the indicated signaling codon. (E) The effect of each signaling codon on the certainty of dose prediction for each ligand: the loss in classification confidence when the indicated signaling codon is missing from the set of six (versus all features).
Figure 4.
Figure 4.. A Sjögren’s syndrome mouse model shows more confusion in classifying immune cytokine TNF and immune threat LPS based on NFκB dynamics
(A) Confusion matrices showing classification precision of ligand identity information. The machine learning model correctly identifies the ligand identity given an NFκB trajectory a majority of the time with the primary confusion being between bacterial ligands Pam3CSK4 and LPS most apparent. Evaluated by 5-fold cross-validation. (B) Confusion matrices showing classification precision of ligand source information. Bacterial ligands are generally correctly identified as such. Evaluated by 5-fold cross-validation. (C) Testing ligand confusion in macrophages isolated from a Sjögren’s disease model mouse (Peng et al., 2010). Violin plots depicting the signaling codons deployed by macrophages, derived from healthy or Sjögren’s mice, stimulated with TNF, LPS, or poly(I:C). (D) Classification of ligand identity in healthy and Sjögren mouse model macrophages by a machine learning classifier trained on healthy macrophage data: false positive rate (FPR), false discovery rate (FDR), and mean margin. Evaluated by 5-fold cross-validation and an independent test set (Figure S4). (E) Confusion matrices for sensitivity/recall for the healthy and Sjögren’s macrophage data. Evaluated by 5-fold cross-validation and an independent test set (Figure S4).
Figure 5.
Figure 5.. Stimulus specificity of gene expression responses is diminished in macrophages from a Sjögren’s mouse model
(A) Single-cell RNA sequencing data of healthy and SS BMDMs collected after 8 h of stimulation with indicated ligands is visualized using the UMAP dimensionality reduction technique. (B) Genes plotted by loss of stimulus specificity (difference of ANOVA F statistic between healthy and SS) in expression, grouped by the indicated gene regulatory clusters identified in Cheng et al., 2017. Positive difference represents greater stimulus specificity in healthy than in SS. (C) Violin plots depicting the expression of Ccl5 in individual cells stimulated in indicated conditions. (D) Confusion matrices from a random forest classifier comparing the distinguishability (sensitivity/recall, a measure of accuracy) of each ligand between healthy and SS. The classifier was trained on top 100 genes and was evaluated using a 30% holdout set. (E) Comparison of channel capacity (the maximum amount of information about ligand identities that can be abstracted from expression of genes; Mackay, 2003) as a function of the number of genes between Healthy and SS cells. Genes were added by forward selection based on ANOVA F statistic difference ranking. Dotted line represents theoretical maximum for three stimulus conditions.
Figure 6.
Figure 6.. Kinetic models of receptor-associated signaling modules share circuit design principles that generate NFκB signaling codons in a stimulus-specific manner
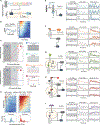
(A) A simple schematic suggesting that NFκB control is mediated by two regulatory networks: the core IκBα-NFκB signaling module is downstream of receptor-associated signaling modules. Receptor-associated signaling modules determine IKK activity over time. Within the core module, IKK activity destabilizes IκBα, freeing NFκB to translocate to the nucleus, where it induces expression of IκBα. (B) The IκBα-feedback is required for generating the oscillatory component of NFκB dynamics characteristic of the response to TNF. Single-cell trajectories and heatmaps of NFκB responses to 3.3 ng/mL TNF in BMDMs derived from RelAV/V, IκBα-deficient mouse. (C) A mathematical model predicts bifurcating behavior in NFκB dynamics based on the level of IKK activation. Left: model steady-state values and primary oscillation frequency are shown as a function of sustained IKK level (Hopf bifurcation analysis). Right: single simulated trajectories of IKK and NFκB activation, at each of four regimes identified in the steady-state diagram. (D) The IκBα feedback loop is sufficient to sustain the non-oscillatory characteristic of the NFκB response to LPS. Single-cell heatmaps of NFκB responses to 3.3 ng/mL TNF and 10 ng/mL LPS in BMDMs derived from a RelAV/VIκBβ−/−IκBε−/− mouse. Below each heatmap, a histogram indicates each cell’s first harmonic showing relative proportions of oscillatory cells (n > 400 individual cells for each experiment, representative of two independent replicates). (E–I) Simplified schematics showing salient features of TNF, TLR1/2, TLR9, TLR4, and TLR3 signaling pathways, and the simulated IKK and NFκB activity (left/middle) and four measured median cell NFκB trajectories (right) at each of three log-spaced (TNF and TLR4) or four half-log-spaced (TLR9, TLR1/2, and TLR3) doses of each receptor’s cognate ligand. The complete reaction sets of the model are described in STAR Methods and Table S7.
Figure 7.
Figure 7.. Oscillatory NFκB in response to PAMPs is a hallmark of feedforward TNF
(A) Activity onset times in single-cell NFκB responses to 100 nM CpG, grouped by dynamic subtypes of the response (persistent, oscillatory, or transient). (B) Early-phase TNF secretion dynamics from macrophages stimulated with 100 nM CpG, as measured by ELISA. (C) Top: median surface TNFR1 expression over time in BMDMs exposed to 1 ng/mL TNF or 100 nM CpG, monitored by flow cytometry. Bottom: median surface TNFR1 expression over time in wild-type or Tnf−/− BMDMs in response to 100 nM CpG (scaled to receptor levels before treatment). Error bars show standard deviations across three independently performed experiments, and double asterisks indicate a p value <0.001 using a Student’s t test comparing wild-type and Tnf−/− levels at a particular timepoint. (D) Single-cell heatmaps of NFκB activation in RelAV/V BMDMs in response to 100 nM CpG, with or without feedforward TNF signaling blocked using saturating amounts (5 mg/mL) of soluble TNFR2 co-injected with treatment. (E) Proportions of NFκB dynamic subtypes (off, transient, oscillatory, or persistent) as quantified from the data in (D). (F) Schematic depicting two cells. One cell (left) responds to CpG by activating NFκB and producing TNF that may act upon it in an autocrine manner. Another cell (right) does not respond to CpG (possibly because of low TLR9 expression), but responds to paracrine TNF and hence produces oscillatory NFκB activity.

Comment in

References

    1. Akosa JS (2017). Predictive Accuracy: A Misleading Performance Measure for Highly Imbalanced Data. SAS Glob. Forum 942, 1–12.
    1. Alpaydin E (2014). Introduction to Machine Learning (MIT Press; ).
    1. Ashall L, Horton CA, Nelson DE, Paszek P, Harper CV, Sillitoe K, Ryan S, Spiller DG, Unitt JF, Broomhead DS, et al. (2009). Pulsatile stimulation determines timing and specificity of NF-kappaB-dependent transcription. Science 324, 242–246. - PMC - PubMed
    1. Barken D, Wang CJ, Kearns J, Cheong R, Hoffmann A, and Levchenko A (2005). Comment on “Oscillations in NF-kappaB signaling control the dynamics of gene expression”. Science 308, 52a. - PMC - PubMed
    1. Basak S, Behar M, and Hoffmann A (2012). Lessons from mathematically modeling the NF-kB pathway. Immunol. Rev 246, 221–238. - PMC - PubMed

Publication types