. 2021 May 11;35(6):109123.
doi: 10.1016/j.celrep.2021.109123.

Generation of a DAT-P2A-Flpo mouse line for intersectional genetic targeting of dopamine neuron subpopulations

Affiliations

Generation of a DAT-P2A-Flpo mouse line for intersectional genetic targeting of dopamine neuron subpopulations

Daniel J Kramer et al. Cell Rep. .

Abstract

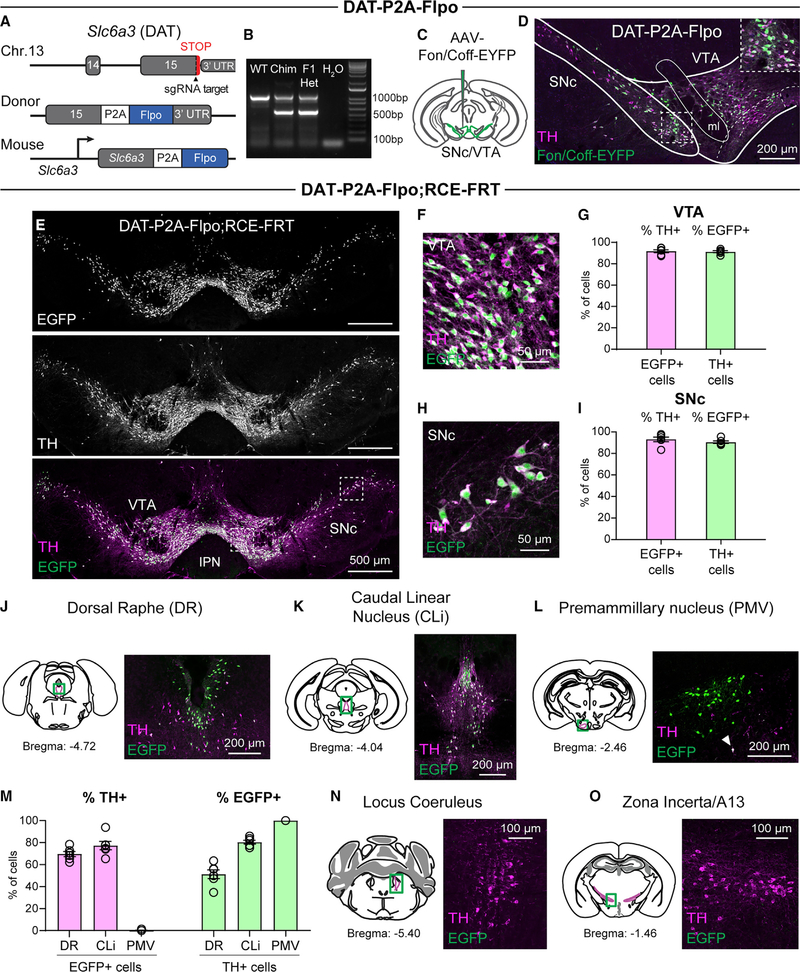
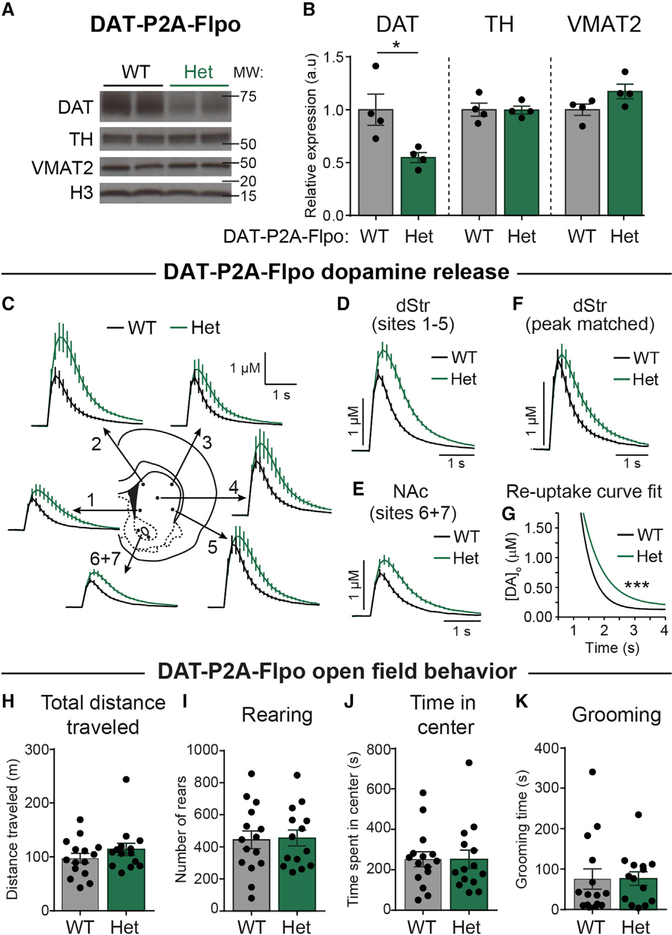
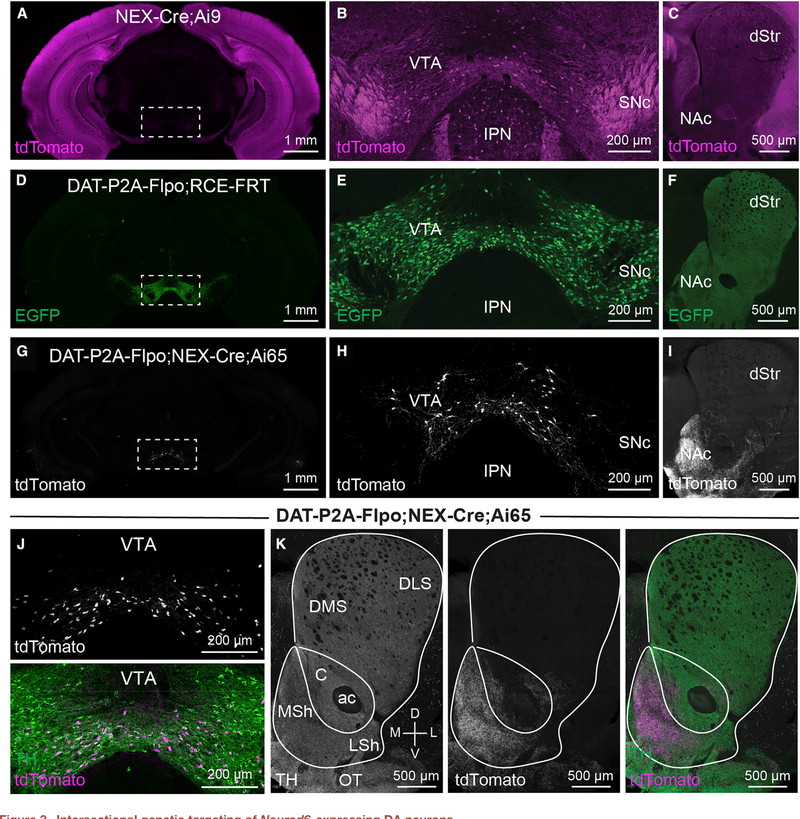
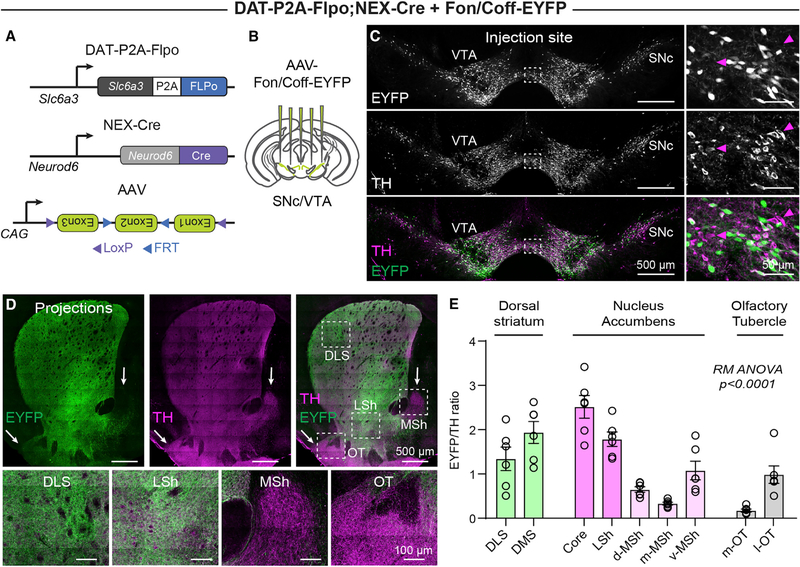
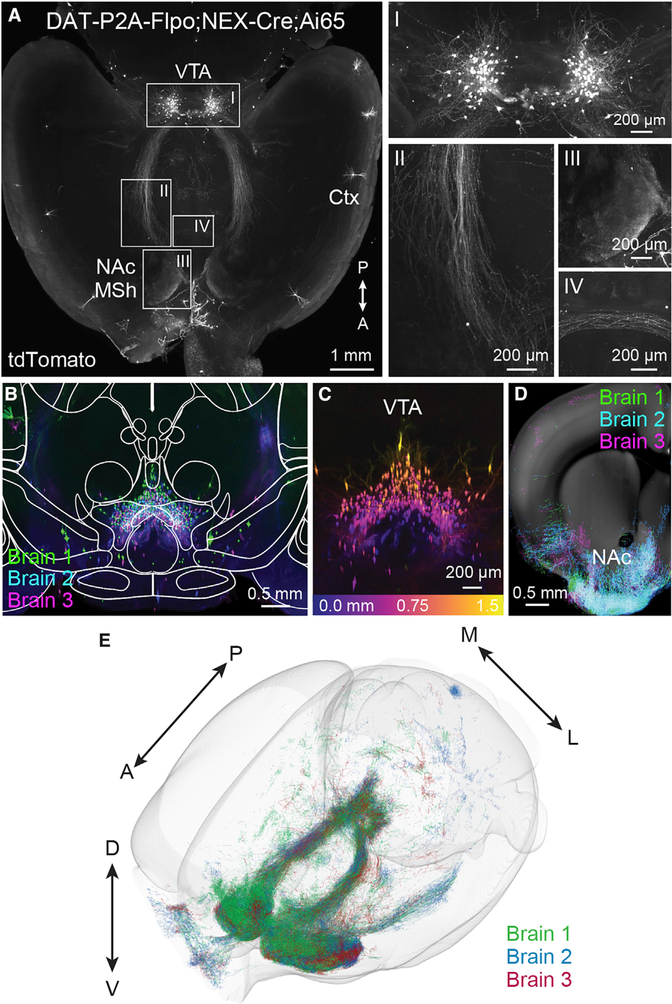
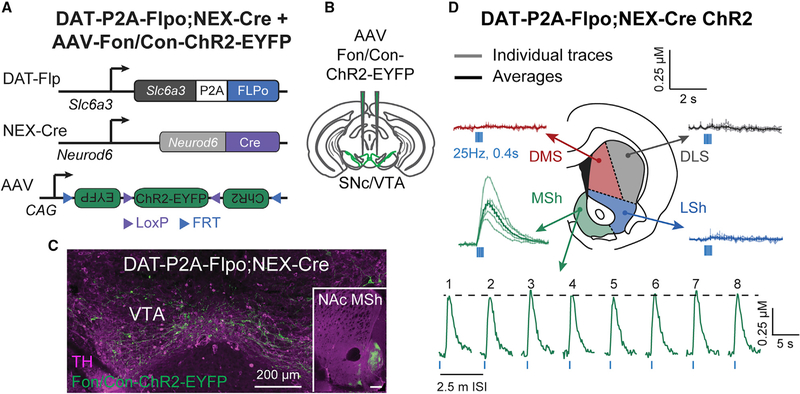
Dopaminergic projections exert widespread influence over multiple brain regions and modulate various behaviors including movement, reward learning, and motivation. It is increasingly appreciated that dopamine neurons are heterogeneous in their gene expression, circuitry, physiology, and function. Current approaches to target dopamine neurons are largely based on single gene drivers, which either label all dopamine neurons or mark a subset but concurrently label non-dopaminergic neurons. Here, we establish a mouse line with Flpo recombinase expressed from the endogenous Slc6a3 (dopamine active transporter [DAT]) locus. DAT-P2A-Flpo mice can be used together with Cre-expressing mouse lines to efficiently and selectively label dopaminergic subpopulations using Cre/Flp-dependent intersectional strategies. We demonstrate the utility of this approach by generating DAT-P2A-Flpo;NEX-Cre mice that specifically label Neurod6-expressing dopamine neurons, which project to the nucleus accumbens medial shell. DAT-P2A-Flpo mice add to a growing toolbox of genetic resources that will help parse the diverse functions mediated by dopaminergic circuits.

Keywords: DAT; DAT-dopamine neurons; Flp recombinase; Neurod6; TrailMap; intersectional genetics; nucleus accumbens; substantia nigra pars compacta; ventral tegmental area.


Conflict of interest statement

Declaration of interests The authors declare no financial or non-financial competing interests.

Figures

Figure 1.
Figure 1.. Generation of DAT-P2A-Flpo mice
(A) Targeting scheme to generate dopamine active transporter (DAT)-P2A-Flpo knockin mice. Top: shown are the last two exons of the Slc6a3 (DAT) gene on chromosome 13 and the position of the single-guide RNA (sgRNA). Middle: a targeting donor was used to replace the stop codon (STOP) of Slc6a3 with a P2A sequence followed by the Flpo recombinase reading frame. Bottom: correct targeting leads to a modified locus expressing Flpo under the control of the endogenous Slc6a3 regulatory elements. (B) PCR-genotyping strategy for DAT-P2A-Flpo mice. The 1,000 bp band denotes the wild-type (WT) allele. The 650 bp band indicates the presence of the P2A-Flpo insert. Expression in the F1 generation indicates successful germline transmission. Chim, chimeric founder (F0). (C) Schematic of the unilateral injection of AAV-Fon/Coff-EYFP into the medial substantia nigra pars compacta (SNc) and ventral tegmental area (VTA). (D) Representative image of a midbrain section stained with an antibody against tyrosine hydroxylase (TH; magenta) showing expression of Fon/Coff-EYFP in the midbrain (green). Inset shows a zoomed-in image of SNc neurons. This experiment was performed twice. (E) Representative images of the midbrain from a DAT-P2A-Flpo;RCE-FRT mouse showing EGFP Flp reporter expression in TH+ SNc and VTA neurons. Representative of 7 mice. IPN, interpeduncular nucleus. (F) Zoomed-in image of the VTA from the boxed region in (E). (G) Quantification (mean ± SEM) of the percentage of EGFP+ cells in the VTA that were TH+ (pink bar) and the percentage of TH+ cells in the VTA that were EGFP+ (green bar). Circles represent values from individual mice (n = 6, 2 male and 4 female mice, post-natal day [P] 60–450). (H) Zoomed-in image of the SNc from the boxed region in (E). (I) Quantification (mean ± SEM) of the percentage of EGFP+ cells in the SNc that were TH+ (pink bar) and the percentage of TH+ cells in the SNc that were EGFP+ (green bar). Circles represent values from individual mice (n = 6). (J–L) Left panels show anatomical schematics of the brain regions imaged (green boxes denote imaged areas). Right panels show representative images of the dorsal raphe (DR; J), caudal linear nucleus (CLi; K), and ventral premammillary nucleus of the hypothalamus (PMV; L) from a DAT-P2A-Flpo;RCE-FRT mouse showing EGFP+ cells (green). Representative of 7 mice. (M) Quantification (mean ± SEM) of the percentage of EGFP+ cells in the DR, CLi, and PMV that were TH+ (pink bars) and the percentage of TH+ cells in the DR, CLi, and PMV that were EGFP+ (green bars). Circles represent values from individual mice (n = 6, 2 male and 4 female mice, P60–450). One mouse had a single TH+ neuron in the PMV (denoted by the arrowhead in L); the rest had no detectable TH+ cells. (N and O) Left panels show anatomical schematics of the brain regions imaged (green boxes denote imaged areas). Right panels show representative images of the locus coeruleus (N) and zona incerta/A13 (O) from a DAT-P2A-Flpo;RCE-FRT mouse showing no EGFP+ reporter expression in TH+ cells in these regions. Representative of 2 mice. See also Figure S1.
Figure 2.
Figure 2.. DAT expression and function in DAT-P2A-Flpo mice
(A) Representative western blot images of DAT, TH, vesicular monoamine transporter 2 (VMAT2), and histone H3 (H3) loading control from striatal lysates from DAT-P2A-Flpo WT and heterozygous (Het) mice. Two independent samples per genotype are shown. Blots were cropped to show the relevant bands. Molecular weight (MW) in kDa is indicated on the right. Representative of 4 mice.(B) Quantification of protein levels relative to H3, normalized to WT. Bars represent mean ± SEM. Each dot represents the average of two striatal samples from one mouse (n = 4 mice per genotype, 2 males and 2 females, P100–120). DAT, *p = 0.0259; TH, p = 0.9639; VMAT2, p = 0.0930; unpaired t tests. (C) Extracellular DA ([DA]o) transients evoked by single electrical pulses and recorded with fast-scan cyclic voltammetry (FCV) in different striatal sub-regions. Traces are mean ± SEM [DA]o versus time (average of 32 transients per recording site from 4 pairs of DAT-P2A-Flpo WT and Het mice, 2 male pairs and 2 female pairs, P100–120). 1, ventromedial striatum; 2, dorsomedial striatum; 3, dorsolateral striatum; 4, central striatum; 5, ventrolateral striatum; 6+7, nucleus accumbens (NAc). (D) Mean ± SEM [DA]o versus time (average of 80 transients per genotype) from the dorsal striatum (dStr) sites 1–5. (E) Mean ± SEM [DA]o versus time (average of 32 transients per genotype) from the NAc sites 6+7. (F) Mean ± SEM [DA]o of selected region- and peak-matched transients from the dStr of DAT-P2A-Flpo WT and Het mice (average of 22 transients per genotype). (G) Single exponential curve fit of the decay phase of the transients in (F). DAT-P2A-Flpo Het mice have significantly slower [DA]o re-uptake than WT mice (***p < 0.0001; WT tau = 0.409, Het tau = 0.648). (H–K) Behavioral performance of DAT-P2A-Flpo mice in a 60-min open-field test. For all graphs, bars represent mean ± SEM and dots represent values for individual mice. n = 15 WT mice, 6 males and 9 females; n = 14 Het mice, 5 males and 9 females, P50–90. (H) Total distance traveled in 60 min; p = 0.2680, unpaired t test. (I) Total number of rears in 60 min; p = 0.8847, unpaired t test. (J) Total time spent in the center of open field in 60 min; p = 0.9981, unpaired t test. (K) Total number of grooming bouts in the first 20 min; p = 0.8061, unpaired t test. See also Figure S2.
Figure 3.
Figure 3.. Intersectional genetic targeting of Neurod6-expressing DA neurons
(A–C) Confocal images from a P28 male NEX-Cre;Ai9 mouse showing tdTomato Cre-reporter expression (representative of 3 mice). (A) Whole brain coronal section showing tdTomato expression throughout the cortex and hippocampus. Boxed region denotes the VTA and ventral SNc (B) TdTomato expression in the midbrain including the SNc, VTA, and IPN. (C) TdTomato expression in the dorsal striatum (dStr) and NAc. (D–F) Confocal images from a P50 male DAT-P2A-Flpo;RCE-FRT mouse showing EGFP Flp reporter expression (representative of 7 mice). (D) Whole brain coronal section showing restricted EGFP expression in the midbrain (boxed region). (E) EGFP expression in the midbrain. (F) EGFP expression in the dStr and NAc. (G–I) Confocal images from a P50 female DAT-P2A-Flpo;NEX-Cre;Ai65 mouse showing tdTomato expression (representative of 5 mice). (G) Whole brain coronal section showing restricted tdTomato expression in the VTA (boxed region). (H) TdTomato expression in the midbrain. (I) TdTomato expression in the dStr and NAc. (J) Confocal images of a VTA section from a P50 DAT-P2A-Flpo;NEX-Cre;Ai65 mouse. Top panel shows tdTomato fluorescence, bottom panel shows a merged image with TH immunostaining in green and tdTomato in magenta. (K) Confocal images of the projection targets of Neurod6+ DA neurons in the striatum and NAc (representative of 5 mice). Left panel shows TH immunostaining. Middle panel shows tdTomato+ projections. Right panel shows merged image with TH in green and tdTomato+ projections in magenta. DMS, dorsomedial striatum; DLS, dorsolateral striatum; C, nucleus accumbens core; ac, anterior commissure; LSh, lateral shell (of NAc); MSh, medial shell (of NAc); OT, olfactory tubercle.
Figure 4.
Figure 4.. Neurod6+ neurons make up the majority of NAc MSh- and OT-projecting DA neurons
(A and B) Strategy to label DA neurons that do not express Neurod6 using an AAV-expressing Flp-on/Cre-off EYFP injected in to the midbrain of DAT-P2A-Flpo;NEX-Cre mice (5 injections per mouse). (C) Confocal images of the midbrain of a P111 male DAT-P2A-Flpo;NEX-Cre mouse injected with AAV-Fon/Coff-EYFP and immunostained for TH. Right panels show zoomed-in images of the boxed regions. Magenta arrows denote cells with TH expression (magenta), but not EYFP expression (green). Representative of 4 mice. (D) Confocal images of the striatum and NAc from a P111 male DAT-P2A-Flpo;NEX-Cre mouse injected with AAV-Fon/Coff-EYFP and immunostained for TH. Bottom panels show zoomed-in merged images of the boxed regions. Arrows point to the NAc MSh and OT, which lack EYFP+ projections. (E) Quantification of the ratio of bulk EYFP fluorescence to bulk TH immunofluorescence in the indicated striatal sub-regions. Bars represent mean ± SEM. Circles represent individual hemispheres (n = 6 hemispheres from 3 mice). DLS, dorsolateral striatum; DMS, dorsomedial striatum; core, NAc core; d-MSh, MSh-dorsal region (of NAc); m-MSh, MSh-medial region (of NAc); v-MSh, mSh-ventral region (of NAc); m-OT, medial OT; l-OT, lateral OT. Repeated-measures (RM) ANOVA revealed a significant difference, p < 0.0001. Holm-Sidak’s multiple comparisons tests with p < 0.05: d-MSh versus LSh, p = 0.0146; d-MSh versus core, p = 0.0144; d-MSh versus m-OT, p = 0.0089; m-MSh versus DMS, p = 0.0412; m-MSh versus LSh, p = 0.0142; m-MSh versus core, p = 0.0133; v-MSh versus core, p = 0.0063; m-OT versus DMS, p = 0.0159; m-OT versus LSh, p = 0.0040; m-OT versus core, p = 0.0058. See also Figure S3.
Figure 5.
Figure 5.. Whole-brain imaging of DAT-P2A-Flpo;NEX-Cre;Ai65 mice
(A) Whole brains from 2 male and 1 female P120 DAT-P2A-Flpo;NEX-Cre;Ai65 mice were optically cleared and imaged without sectioning using a light sheet microscope. Shown is a representative max projection of 600 μm from a horizontal plane z stack (representative of 3 mice). Right panels show zoomed-in images of Neurod6+ DA neurons in the midbrain (I), axonal tracts from the midbrain to the NAc MSh (II), Neurod6+ DA neuron axon terminals in the MSh (III), and fibers crossing the midline (IV). Ctx, cortex. (B) Coronal view (XZ projection) comprising a 1.5 mm anterior/posterior (A/P) cross section of the VTA in optically cleared DAT-P2A-Flpo;NEX-Cre;Ai65 mice. Three separate brains were aligned and merged. Image is overlaid with brain region outlines from the middle position of the 1.5 mm cross section from the Allen Brain Atlas. (C) Coronal z stack image of a 1.5 mm cross section of the VTA from a single brain color coded by depth. Depth scale is shown in bottom panel. (D) Coronal z stack image of TrailMap-extracted axons from a 500 μm section of the striatum and NAc. Three separate brains were aligned and merged. Extracted axons are overlaid onto a reference slice from the middle position of the 500 μm section from the Allen Brain Atlas. (E) Projections and processes of DAT-P2A-Flpo;NEX-Cre;Ai65-positive neurons visualized in a 3D view of TrailMap-extracted processes from three aligned brains. See also Figure S4, Table S1, and Videos S1, S2, and S3.
Figure 6.
Figure 6.. Optogenetic activation of DA release in DAT-P2A-Flpo;NEX-Cre mice
(A) Schematic of the intersectional genetic strategy to target Neurod6+ DA neurons in DAT-P2A-Flpo;NEX-Cre mice with an AAV-expressing Flp- and Cre-dependent channelrhodopsin (ChR2) fused to EYFP. (B) Schematic showing bilateral injection of AAV-Fon/Con-ChR2-EYFP into the midbrain of DAT-P2A-Flpo;NEX-Cre mice. (C) Representative confocal image showing midbrain expression of Fon/Con-ChR2-EYFP (green) together with TH immunostaining (magenta) in a DAT-P2A-Flpo;NEX-Cre mouse. Inset shows ChR2-EYFP+ projections in the NAc MSh in an injected mouse. Scale bar in the inset image represents 200 μm. Representative of 3 mice. (D) FCV traces of optically-evoked [DA]o in striatal slices from DAT-P2A-Flpo;NEX-Cre mice injected with AAV-Fon/Con-ChR2-EYFP. DA release was evoked from different striatal sub-regions by 10 light pulses delivered at 25 Hz. Light colored lines show individual traces (n = 3–9 transients per recording site) and dark colored lines are the mean ± SEM from each region, recorded from 4 hemispheres of two P120 male mice. Bottom panel shows DA transients recorded in the MSh from 8 consecutive stimulations delivered 2.5 min apart. See also Figure S4.

References

    1. Agarwal A, Dibaj P, Kassmann CM, Goebbels S, Nave KA, and Schwab MH (2012). In vivo imaging and noninvasive ablation of pyramidal neurons in adult NEX-CreERT2 mice. Cereb. Cortex 22, 1473–1486. - PubMed
    1. Anderzhanova EA, Bächli H, Buneeva OA, Narkevich VB, Medvedev AE, Thoeringer CK, Wotjak CT, and Kudrin VS (2013). Strain differences in profiles of dopaminergic neurotransmission in the prefrontal cortex of the BALB/C vs. C57Bl/6 mice: consequences of stress and afobazole. Eur. J. Pharmacol. 708, 95–104. - PubMed
    1. Awatramani R, Soriano P, Rodriguez C, Mai JJ, and Dymecki SM (2003). Cryptic boundaries in roof plate and choroid plexus identified by intersectional gene activation. Nat. Genet. 35, 70–75. - PubMed
    1. Bäckman CM, Malik N, Zhang Y, Shan L, Grinberg A, Hoffer BJ, Westphal H, and Tomac AC (2006). Characterization of a mouse strain expressing Cre recombinase from the 3′ untranslated region of the dopamine transporter locus. Genesis 44, 383–390. - PubMed
    1. Bateup HS, Santini E, Shen W, Birnbaum S, Valjent E, Surmeier DJ, Fisone G, Nestler EJ, and Greengard P (2010). Distinct subclasses of medium spiny neurons differentially regulate striatal motor behaviors. Proc. Natl. Acad. Sci. USA 107, 14845–14850. - PMC - PubMed

Publication types

Substances