. 2021 May 11;35(6):109112.
doi: 10.1016/j.celrep.2021.109112.

RIPK1 activation mediates neuroinflammation and disease progression in multiple sclerosis

Affiliations

RIPK1 activation mediates neuroinflammation and disease progression in multiple sclerosis

Matija Zelic et al. Cell Rep. .

Abstract

Receptor interacting protein kinase 1 (RIPK1) mediates cell death and inflammatory signaling and is increased in multiple sclerosis (MS) brain samples. Here, we investigate the role of glial RIPK1 kinase activity in mediating MS pathogenesis. We demonstrate RIPK1 levels correlate with MS disease progression. We find microglia are susceptible to RIPK1-mediated cell death and identify an inflammatory gene signature that may contribute to the neuroinflammatory milieu in MS patients. We uncover a distinct role for RIPK1 in astrocytes in regulating inflammatory signaling in the absence of cell death and confirm RIPK1-kinase-dependent regulation in human glia. Using a murine MS model, we show RIPK1 inhibition attenuates disease progression and suppresses deleterious signaling in astrocytes and microglia. Our results suggest RIPK1 kinase activation in microglia and astrocytes induces a detrimental neuroinflammatory program that contributes to the neurodegenerative environment in progressive MS.

Keywords: RIPK1; astrocyte; cell death; inflammation; microglia; multiple sclerosis; necroptosis.


Conflict of interest statement

Declaration of interests M.Z., F.P., L.W., C.Z., A.M., Y.R., M.L., R.G., L.G., P.L., T.X., T.H., and D.O. were employees of Sanofi at the time this research was conducted. The authors declare no other conflicts of interest.

Figures
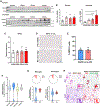
Figure 1.
Figure 1.. RIPK1 protein levels are elevated in progressive forms of MS
(A) Protein levels assessed by immunoblotting soluble (TBS/Triton) and insoluble (RIPA/urea) brain lysates from control (CTRL) and MS patients; *non-specific band. (B) Quantification of blots in (A) normalized to NAWM control (n = 5 RRMS; n = 6 NAWM, SPMS, and PPMS samples). (C) qRT-PCR analysis of RIPK1 expression in control and MS patient samples from (B). (D) RIPK1 in situ hybridization (ISH) of CTRL and progressive MS (prog. MS) brains (perilesion area). The inset depicts RIPK1+ ISH as brown dots. Scale bar: 100 μM. (E) Quantification of RIPK1+ ISH cells (n = 4 per group). 2–3 areas of similar size were quantified per sample, including lesion area in prog. MS samples. (F) Pseudo-bulk analysis of RIPK1 expression in astrocytes, microglia, oligodendrocytes and OPCs, and neurons from control and MS patients from an RNA-seq database (Schirmer et al., 2019). (G) Single-cell RIPK1 expression represented by read count distribution in microglia and astrocytes in control and MS patients (top), with violin plots (bottom) depicting pseudo-bulk analysis expression from (F) in individuals (n = 7–9 control, n = 12 MS). (H) ISH and immunohistochemistry (IHC) staining of prog. MS brains (perilesion area) depicting RIPK1+ ISH as brown dots and IBA1+ microglia/macrophages or GFAP+ astrocytes in purple. Digital co-localization of RIPK1 and IBA1 or GFAP is depicted in pseudo-yellow in the analysis image (inset), where RIPK1+ ISH is green and IBA1+ or GFAP+ IHC is red. Scale bar: 50 μM. Error bars represent mean ± SEM. Images are representative of 4 NAWM and 4 prog. MS samples (D and H). One-way ANOVA with Tukey post hoc test was performed (B). ****p < 0.0001. See also Figure S1 and Table S1.
Figure 2.
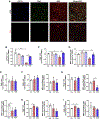
Figure 2.. RIPK1 kinase activity regulates pro-inflammatory signaling and cell death in murine microglia in vitro
(A) MSD assay quantifying pRIPK1 levels in microglia treated for 2 h. (B) Viability of microglia stimulated for 20 h (n = 3). (C) Representative images depicting microglial morphology 20 h after treatment. Scale bar: 100 μM. (D) Quantification of DRAQ7+ microglia imaged in the IncuCyte Zoom system. (E) Relative gene expression in microglia treated for 4 h (n = 3). (F) RNA-seq data in microglia treated with T/5z (RDA) or T/S/Z (necroptosis) for 4 h with or without Nec-1s (RIPK1-dependent), comparing upregulated and downregulated genes (cutoff ∣FC∣ > 1.5, p < 0.05). (G) PCA of RNA-seq microglia (n = 4). (H) Hierarchical heatmap clustering of RIPK1-kinase-dependent genes. (I) Overlap of RIPK1-dependent genes (cutoff ∣FC∣ > 2, p < 0.05). (J) List of overlapping RIPK1-dependent genes from (I). (K) Top 5 diseases associated with genes in (J) from the ToppGene database. Error bars represent mean ± SD. Data depict technical replicates and are representative of 2 (A) or 3 (D) independent experiments. One-way ANOVA with Tukey post hoc test was performed (B and E). *p < 0.05, **p < 0.01, ***p < 0.001, ****p < 0.0001. T, TNF; S, Smac; Z, zVAD; N, Nec-1s. See also Figures S2 and S3.
Figure 3.
Figure 3.. RIPK1 kinase activation mediates pro-inflammatory signaling, but not cell death, in murine mixed glia and astrocytes in vitro
(A) Representative images depicting GFP+ microglia seeded on mixed glial culture and treated for 48 h. Scale bar: 100 μM. (B) Viability of mixed glia stimulated for 20 h (n = 3). (C) Quantification of GFP+ microglia in mixed glial culture measured as GFP+ area normalized to DMSO control (n = 5). (D) Representative images depicting astrocytes 20 h after treatment. Scale bar: 100 μM. (E) Viability of astrocytes stimulated for 20 h (n = 4). (F) Protein expression in astrocytes assessed by immunoblotting after stimulation with FLAG-tagged human TNF and immunoprecipitation with anti-FLAG. (G) Protein expression assessed by immunoblotting after 2 h stimulation in microglia, mixed glia, and astrocytes. (H–K) MSD quantification of pRIPK1 in mixed glia (H) or astrocytes (J) treated for 2 h. Relative gene expression in mixed glia (I) or astrocytes (K) treated for 4 h (n = 4 mixed glia, n = 3 astrocytes). Error bars represent mean ± SD. Data depict technical replicates and are representative of 2 independent experiments (F–H and J). One-way ANOVA with Tukey post hoc test was performed (C, E, I, and K). *p < 0.05, **p < 0.01, ***p < 0.001, ****p < 0.0001. See also Figure S4.
Figure 4.
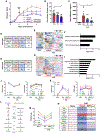
Figure 4.. RIPK1 kinase activity regulates a pro-inflammatory transcriptional program in murine astrocytes in vitro
(A) RNA-seq in astrocytes comparing upregulated and downregulated genes with T/S/Z or T/S/Z/N (RIPK1 dependent) stimulation (cutoff ∣FC∣ > 1.5, p < 0.05). (B) PCA of astrocytes (n = 3) treated for 4 h. (C) Hierarchical heatmap clustering of RIPK1-kinase-dependent genes. (D) Overlap of RIPK1-dependent genes from T/S/Z-stimulated microglia and astrocytes (cutoff ∣FC∣ > 1.5, p < 0.05). (E) List of overlapping RIPK1-dependent genes from (D), with cutoff ∣FC∣ > 2. (F) Gene Ontology terms for biological processes from ToppGene Suite for genes in (E). (G) Overlap of upstream transcriptional regulators predicted in Ingenuity Pathway Analysis (IPA) for genes in (D). (H) Top transcriptional regulators in astrocytes from (G), with overlapping transcription factors in bold. (I) Gene expression in astrocytes and microglia (n = 6 astrocytes, n = 8 microglia for DMSO and Nec-1s samples). (J and K) Expression of individual genes involved in inflammatory (J) or lipid and metabolism (K) signaling. (L) Heatmap of sterol profile from astrocytes treated for 24 h (n = 4). (M) Concentrations of altered sterol species in astrocytes treated for 24 h (n = 4). Error bars represent mean ± SD. One-way ANOVA with Tukey post hoc test was performed. *p < 0.05, **p < 0.01, ****p < 0.0001. See also Figure S5.
Figure 5.
Figure 5.. RIPK1 kinase activation in microglia and astrocytes mediates deleterious non-cell-autonomous signaling in vitro
(A) Representative images depicting OPCs seeded on mixed glial cells, treated for 72 h, and stained with indicated antibodies. Scale bar: 50 μM. (B–D) Quantification of CSF1R+ area (B), Olig2+ cells (C), and MBP+ area (D) from OPCs co-cultured with mixed glial cells and treated for 72 h (n = 3). (E–I) Quantification of Olig2+ cells and MBP+ area from OPCs cultured with mixed glia (E), astrocyte (H), or microglia (I) conditioned media or OPCs co-cultured with astrocytes (F) or microglia (G) and treated for 48 h (E) or 72 h (F–I) as outlined (n = 3). Error bars represent mean ± SD. One-way ANOVA with Tukey post hoc test was performed. *p < 0.05, **p < 0.01, ***p < 0.001, ****p < 0.0001.
Figure 6.
Figure 6.. RIPK1 kinase inhibition attenuates clinical disease progression and suppresses microglial and astrocyte signaling pathways in a murine model of MS
(A) Mean disease scores for vehicle (0.5% methylcellulose, twice a day [BID]) and RIPK1 kinase inhibitor groups (RIPK1inh-1, 30 or 60 mg/kg BID) in C57BL/6 EAE mice (n = 12 mice/group). (B) Cumulative disease scores for each mouse are depicted. (C) Neurofilament heavy levels measured in the plasma of naive or EAE-induced mice at sacrifice (n = 11 naive and vehicle, n = 12 RIPK1inh-1). (D–H) RNA-seq data in microglia (D) and astrocytes (G) isolated from naive or EAE-induced mice depicting upregulated and downregulated genes (cutoff ∣FC∣ 1.5, p < 0.05; n = 4 naive, n = 6 EAE-vehicle [20% Captisol], and n = 5 EAE-RIPK1inh-1 [50 mg/kg BID] mice). Hierarchical heatmap clustering of RIPK1-kinasedependent genes in microglia (E) and astrocytes (H). Top pathways predicted from IPA for RIPK1-kinase-dependent genes in microglia (F) and astrocytes (I). (J–M) Gene expression levels in RNA-sequenced microglia (J) and astrocytes (K and M); Ccl2 p = 0.072 (EAE-vehicle versus EAE-RIPK1inh-1), all other genes p < 0.05. (L) Diagram of genes and sterol intermediates in the cholesterol biosynthesis pathway. (N) Heatmap of cholesterol biosynthesis genes from RNA-sequenced astrocytes, normalized to naive mice, with significant changes for naive versus EAE-vehicle and EAE-vehicle versus EAE-RIPK1inh-1 shown. Error bars represent mean ± SEM. One-way ANOVA with Tukey post hoc test (B and C) or two-way ANOVA with Dunnett test (A) was performed. *p < 0.05, **p < 0.01, ***p < 0.001, ****p < 0.0001. See also Figure S6.

References

    1. Al Nimer F, Elliott C, Bergman J, Khademi M, Dring AM, Aeinehband S, Bergenheim T, Romme Christensen J, Sellebjerg F, Svenningsson A, et al. (2016). Lipocalin-2 is increased in progressive multiple sclerosis and inhibits remyelination. Neurol. Neuroimmunol. Neuroinflamm 3, e191. - PMC - PubMed
    1. Baecher-Allan C, Kaskow BJ, and Weiner HL (2018). Multiple Sclerosis: Mechanisms and Immunotherapy. Neuron 97, 742–768. - PubMed
    1. Berard JL, Wolak K, Fournier S, and David S (2010). Characterization of relapsing-remitting and chronic forms of experimental autoimmune encephalomyelitis in C57BL/6 mice. Glia 58, 434–445. - PubMed
    1. Bittner S, Afzali AM, Wiendl H, and Meuth SG (2014). Myelin oligodendrocyte glycoprotein (MOG35-55) induced experimental autoimmune encephalomyelitis (EAE) in C57BL/6 mice. J. Vis. Exp 86, 51275. - PMC - PubMed
    1. Bove R, Healy BC, Musallam A, Soltany P, Diaz-Cruz C, Sattarnezhad N, Glanz BI, Kivisäkk P, Miller KK, and Chitnis T (2019). Fatty acid binding protein-4 is associated with disability in multiple sclerosis patients. Mult. Scler 25, 344–351. - PMC - PubMed

Publication types

Substances