. 2021 May 19;109(10):1621-1635.e8.
doi: 10.1016/j.neuron.2021.03.013. Epub 2021 May 11.

Efficient optogenetic silencing of neurotransmitter release with a mosquito rhodopsin

Affiliations

Efficient optogenetic silencing of neurotransmitter release with a mosquito rhodopsin

Mathias Mahn et al. Neuron. .

Abstract

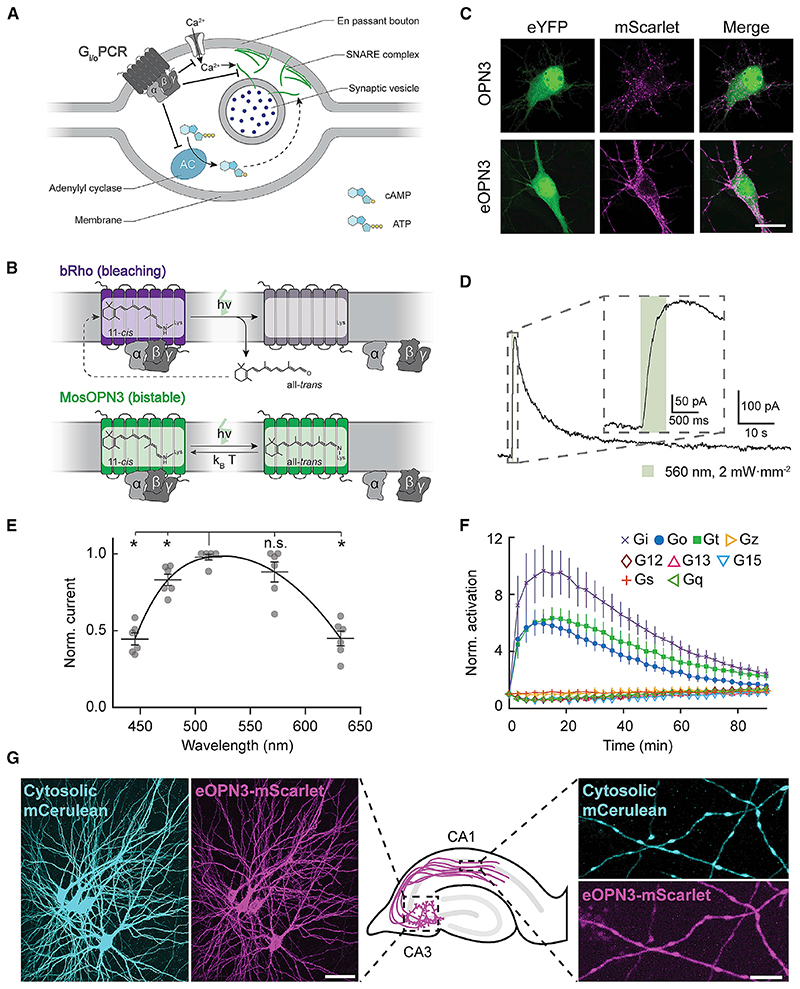
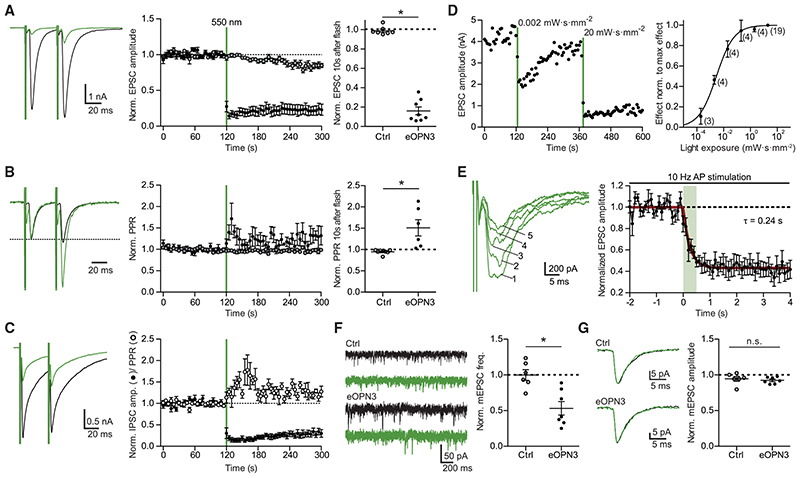
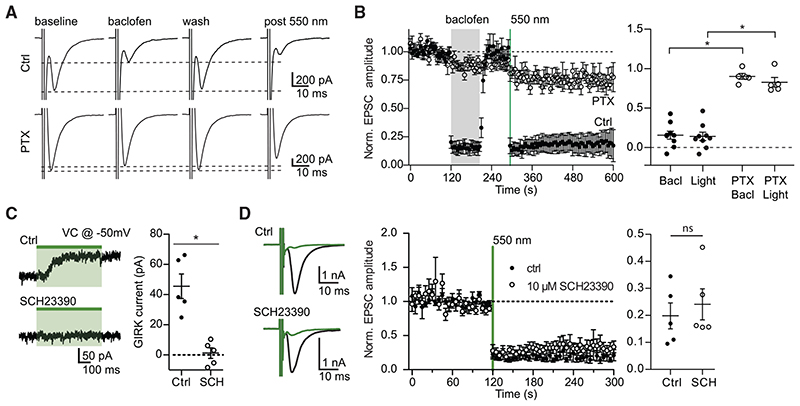
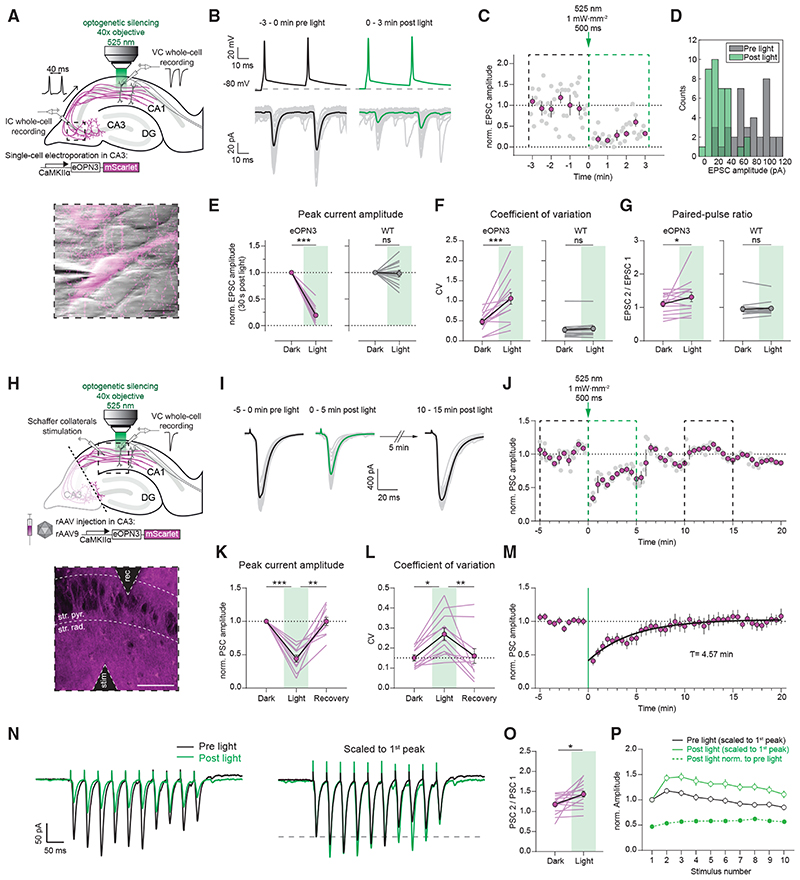
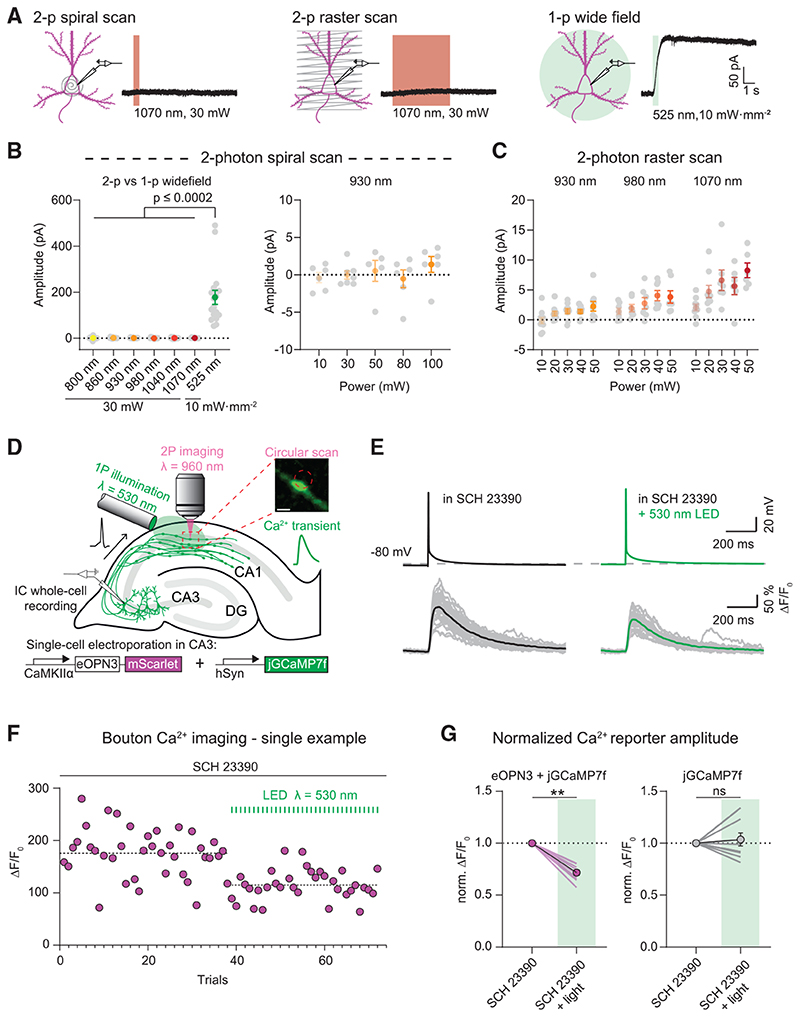
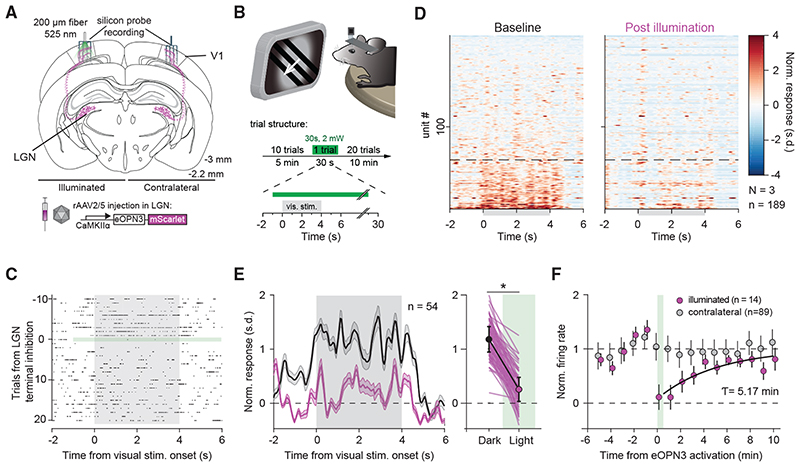
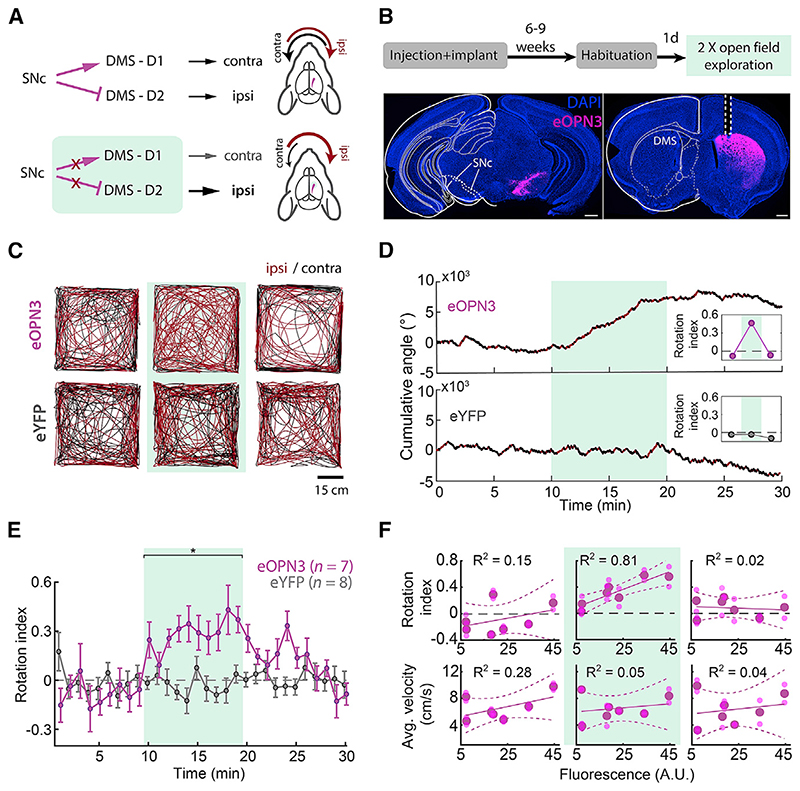
Information is carried between brain regions through neurotransmitter release from axonal presynaptic terminals. Understanding the functional roles of defined neuronal projection pathways requires temporally precise manipulation of their activity. However, existing inhibitory optogenetic tools have low efficacy and off-target effects when applied to presynaptic terminals, while chemogenetic tools are difficult to control in space and time. Here, we show that a targeting-enhanced mosquito homolog of the vertebrate encephalopsin (eOPN3) can effectively suppress synaptic transmission through the Gi/o signaling pathway. Brief illumination of presynaptic terminals expressing eOPN3 triggers a lasting suppression of synaptic output that recovers spontaneously within minutes in vitro and in vivo. In freely moving mice, eOPN3-mediated suppression of dopaminergic nigrostriatal afferents induces a reversible ipsiversive rotational bias. We conclude that eOPN3 can be used to selectively suppress neurotransmitter release at presynaptic terminals with high spatiotemporal precision, opening new avenues for functional interrogation of long-range neuronal circuits in vivo.

Keywords: G protein-coupled receptor; GCPR; autaptic neurons; dopaminergic; eOPN3; inhibitory; mosquito; optogenetics; presynaptic; silencing; thalamocortical.


Conflict of interest statement

Declaration of interests O.Y. and M.M. have disclosed these findings to Yeda, the Weizmann Institute Technology Transfer Arm, which is filing a patent application on these developments. The constructs and viral vectors remain freely available from the authors and through Addgene.

Figures

Figure 1
Figure 1. Gi/o-coupled rhodopsins for light-mediated presynaptic inhibition
(A) Schematic diagram depicting the mechanism through which Gi/o signaling reduces the synaptic vesicle release probability. An activated GPCR leads to inhibition of voltage-gated Ca2+ channels as well as reduced cAMP levels, both leading directly (solid arrow) and indirectly (dashed arrow) to a reduction of Ca2+-dependent vesicle release. (B) Schematic diagram of distinct retinal binding mechanisms in bleaching (top) and bistable (bottom) rhodopsins. Bleaching rhodopsins release all-trens-retinal following photon absorption (h-v) and need to bind a new 11-c/s-retinal before being ableto enterthe next photocycle. Bistable rhodopsins sustain theircovalent bond with retinal independent of its configuration, removing the influence of 11-c/s-retinal tissue availability. In bistable rhodopsins, all-trans-retinal switches back to 11-c/s-retinal either by absorbing another photon or spontaneously in the darkwith a probability depending on the kinetic energy of the molecule (k B-T). kB = Boltzmann constant; T = thermodynamic temperature; h = Planck constant; n = photon frequency. (C) Representative confocal images of neurons co-transfected with expression vectors for eYFP and OPN3 or eOPN3. Images show fluorescence in the eYFP channel (left), the mScarlet channel (middle) and the merged images (right). See Figure S2 for all tested rhodopsin variants and quantifications. Scale bar, 15 mm. (D) Sample whole-cell voltage-clamp recording of a cultured hippocampal neuron co-expressing eOPN3 and GIRK2-1, held at −70 mV. Inset shows an expanded view of the GIRK current onset during the light pulse. (E) Action spectrum of endogenous GIRK-mediated currents in neurons expressing eOPN3, normalized to peak activation per cell (n = 6, p = 3.45-10 Friedman rank sum test followed by pairwise comparisons using Conover’s test). Peak excitation occurred at 512 nm (p < 4.24-10−3 Holm corrected pairwise comparisons to all other wavelengths except 572 nm). (F) Light-dependent G protein activation by eOPN3, assayed as in Figure S3. eOPN3 specifically and strongly activated inhibitory G proteins (Gi, Go, Gt) in a lightdependent manner (n = 5). See Figure S3 for complete assay and statistics. (G) Two-photon maximum-intensity projections of CA3 neurons co-expressing the cytosolic fluorophore mCerulean (cyan) and eOPN3-mScarlet (magenta). Shown are the somatodendritic compartment of neurons electroporated with the two plasmids (left; scale bar, 50 mm) and their axons projecting into stratum radiatum of CA1 (right; scale bar, 5 mm). Plots depict individual data points and average ± SEM.
Figure 2
Figure 2. Light-induced inhibition of neurotransmitter release in autaptic hippocampal neurons expressing eOPN3
(A) Typical autaptic EPSCs evoked by a pair of 1 ms depolarizing current injections (40 ms inter-stimulus interval, injected currents clipped for presentation) before (black) and after (green) illumination with 550 nm light (40 mW-mm−2, unless otherwise indicated). Traces are averages of 6 sweeps. A 500 ms light pulse caused sustained suppression of EPSCs in eOPN3-expressing neurons. EPSCs decreased to 16 ± 4% of baseline (n = 8), while EPSCs in control neurons were not affected by illumination (open circles, n = 7, p = 3·10−4 two-tailed Mann-Whitney test). (B) Traces from (A) scaled to the amplitude of the first EPSC (dashed line). Illumination increased the paired-pulse ratio (EPSC2/EPSC1) in the eOPN3-positive neurons (n = 6) compared to controls (p = 1.2-10−3 unpaired, two-tailed Student’s t test). (C) Amplitudes and PPR of evoked autaptic IPSCs in GABAergic neurons, compared to the pre-light baseline (IPSCs: n = 7; PPR: n = 5). (D) Quantification of light exposure required for half maximal synaptic inhibition. Normalized effect size was fit as a sigmoidal dose-response curve (n is reported next to the measurement points, EC50 = 2.895 mW-s-mm−2). (E) Time-course of the eOPN3 activation on EPSC amplitudes evoked by APs triggered at 10 Hz. Traces show five consecutive EPSCs of the train following the onset of a single 500 ms light pulse. EPSCs decreased with a time constant ton of 240 ms (n = 6). (F) Representative traces of mEPSCs (left) and quantification (right). eOPN3 activation decreased mEPSC frequency to 53 ± 9% compared to baseline (n = 7), significantly different from controls (n = 6, p = 3·10−3, two-tailed Mann-Whitney test). (G) Quantal EPSC amplitude in eOPN3-expressing and control neurons after illumination (p = 0.3 unpaired, two-tailed Student’s t test). Plots show individual data points and average (black) ± SEM.
Figure 3
Figure 3. The effect of eOPN3 on neurotransmitter release is sensitive to pharmacological inhibition of Gi/o-protein signaling but is not affected by a GIRK channel blocker
(A) Action potential-evoked EPSCs in control neurons (upper row) were suppressed both by the GABABR agonist baclofen (30 μM) and by subsequent activation of eOPN3 with 550 nm light (500 ms, 40 mW·mm 2). In pertussis toxin (PTX)-treated neurons (20-26 h pre-treatment, 0.5 μg-mL ‘, bottom row), both baclofen and eOPN3 largely failed to suppress release. (B) Averaged time-course of EPSCs recorded in neurons treated with PTX (open circles; n = 5) and neurons not treated with PTX (filled circles; n = 9; p = 3·10 4 Kruskal-Wallis test followed by Dunn’s multiple comparison tests: p < 0.05 for Bacl versus PTX Bacl, Light versus PTX Bacl and Light versus PTX Light). (C) Illumination of eOPN3-expressing neurons evokes robust outward currents (45.5 ± 8.1 pA, n = 5), which are abolished in the presence of the GIRK channel blocker SCH23390 (10 μM, 1.2 ± 3.5 pA; n = 5; p = 1·10 3 unpaired, two-tailed Student’s t test). (D) The extent and time-course of EPSC suppression by eOPN3 activation is not affected by the GIRK channel blocker SCH23390 (filled circles: ctrl recordings, n = 5; open circles: SCH23390, n = 5; p = 0.59 unpaired, two-tailed Student’s t test). Plots show individual data points and average ± SEM.
Figure 4
Figure 4. eOPN3 activation induces long-lasting, reversible inhibition of synaptic transmission at Schaffer collateral synapses
(A) Schematic diagram of experimental setup for whole-cell paired-recordings in organotypic hippocampal slices (see STAR Methods for details). Inset: IR-scanning gradient contrast image overlaid with the fluorescence image of patch-clamped, eOPN3 expressing CA3 neuron. Scale bar, 20 mm. (B) Top: representative voltage traces of electrically induced APs from an eOPN3 expressing CA3 neuron, before and after light delivery to the CA1 region (dashed line shows the resting membrane potential at the beginning of the experiment. Note that APs were still reliably evoked after light stimulation). Bottom: corresponding current traces from a postsynaptic CA1 neuron in response to the paired-pulse stimulation, before and after light delivery (gray: single trials, black and green: averaged trials). (C) Time course of the normalized EPSCs peak amplitudes from the example shown in (B) (gray circles: single trials, magenta: means of 30 s time bins ± SEM). (D) Histogram count of peak current amplitudes of the example shown in (B). (E) Normalized EPSC amplitudes in the eOPN3 group (left) and wild-type (WT) control group (right) (eOPN3: 0.19 ± 0.04, n = 14 pairs from 14 slices, p = 1.10−4, Wilcoxon test; WT: 0.98 ± 0.06, n = 13 pairs from 13 slices, p = 0.5, Wilcoxon test). (F) Coefficient of variation of EPSCs in the dark and after light application for the eOPN3 (left) and control group (right) (eOPN3 dark: 0.48 ± 0.06, eOPN3 light: 1.06 ± 0.15, n = 14 pairs from 14 slices, p = 4·10−4, paired t test; WT dark: 0.27 ± 0.06, WT light: 0.31 ± 0.06, n = 13 pairs from 13 slices, p = 0.11, Wilcoxon test). (G) Paired-pulse ratio change in the dark compared to after light application for the eOPN3 (left) and control group (right) (eOPN3 dark: 1.11 ± 0.08, eOPN3 light: 1.32 ± 0.14, n = 14 pairs from 14 slices, p = 0.02, Wilcoxon test; WT dark: 0.95 ± 0.07, WT light: 0.97 ± 0.06, n = 13 pairs from 13 slices, p = 0.59, Wilcoxon test). Circles in (E-G): mean ± SEM. (H) Schematic diagram of experimental setup for field stimulation (see STAR Methods for details). Inset: two-photon single-plane image of the CA1 region with the stimulating and recording electrodes. eOPN3-expressing axons (magenta) surround CA1 pyramidal neurons (dark shadows). Scale bar, 50 γm. (I) Representative voltage traces (PSCs) before, immediately and 10 min after light (gray: single trials, black and green: average trials). (J) Time course of the normalized PSC peak amplitudes from the example shown in (I). Dashed boxes indicate the time periods shown in (I) (gray circles: single trials, magenta: 30 s time bins ± SEM). (K) Quantification of eOPN3 effect on PSC peak amplitudes (“Dark”: 5 min period before light; “Light”: maximal eOPN3 effect during first 30 s post light, 0.44 ± 0.05, p < 1·10−4; “Recovery”: 10−15 min period after light, 0.99 ± 0.06, p = 1.9·10−3; n = 11 slices, Friedman test with Dunn’s multiple comparison test). (L) Quantification of the effect of eOPN3 activation on the coefficient of variation. “Light” refers to the 5 min post light application matching the duration of the two other conditions (“Dark”: 0.15 ± 0.02; “Light”: 0.27 ± 0.03, p = 0.02; “Recovery”: 0.16 ± 0.04, p = 8·5-10−3, n = 11 slices, Friedman test with Dunn’s multiple comparison test). (M) Summary of all field stimulation experiments. Mono-exponential fit is shown in black. (N) Left: representative voltage traces in response to a 10-pulse stimulus train (25 Hz). Traces are averages of5 sweeps each. Right: same traces as on the left, each scaled to its 1st PSC peak amplitude. (O) Quantification of the PPR (PSC 2 / PSC 1 of the train), showing increased facilitation (Dark: 1.18 ± 0.05, Light: 1.43 ± 0.07, p = 0.01, n = 16 slices, Paired t test). (P) Summary of all train stimulation experiments. Circles in (K-P): mean ± SEM.
Figure 5
Figure 5. eOPN3 two-photon activation properties and modulation of presynaptic voltage-gated Ca2+ channels
(A) Two-photon (left, middle) versus single-photon (right) activation of eOPN3 in CA3 pyramidal neurons in organotypic hippocampal slice cultures expressing eOPN3-mScarlet and GIRK2-1. Somatic 500 Hz spiral scans (2 ms/spiral, 250 cycles, 500 ms total duration) or raster scans (FOV = 106*106 μm, 512x512 pixels, 1.8 ms/line, 5 frames, 4.6 s total duration) at 1.09 Hz over the somatodendritic compartment were used for two-photon activation characterization. Example voltage-clamp traces show photocurrents obtained by the different stimulation modalities in the same cell. (B) Quantification of the photocurrents elicited by two-photon versus single-photon illumination. Left: GIRK-mediated currents in eOPN3 expressing neurons stimulated with two-photon spiral scanning at wavelengths from 800 nm to 1070 nm at 30 mW, or with full-field 525 nm light (Kruskal-Wallis test, Dunn’s multiple comparisons test). Right: Increasing laser intensity during spiral scans at930 nm did not result in significant photocurrent. (C) Slower and longer raster scanning over a larger field of view resulted in minimal outward currents and was wavelength and laser-intensity dependent (Linear regression indicated positive slopes. Bonferroni-Holm corrected p values: wavelength: p = 6.1·10−4; laser power: 930 nm: p = 0.01; 980 nm: p = 7.2·10−3; 1070 nm: p = 1.2·10−3). (D) Schematic diagram of presynaptic Ca2+ imaging experiments (see STAR Methods for details). Inset shows a single-plane jGCaMP7f image of an en passant bouton and the circular imaginglaser scanning path (red dashed circle, scale bar, 1 μm). A fiber-coupled LED was used to locally activate eOPN3 in CA1 the presence of the GIRK channel blocker SCH 23390. (E) Top: representative voltage traces of electrically evoked APs in a transfected CA3 pyramidal neuron in the dark and after a green light pulse (dashed line shows the resting membrane potential at the beginning of the experiment). Bottom: corresponding Ca2+ responses from a presynaptic bouton. Single trials are shown in gray; black and green traces represent the averaged responses before and after light, respectively. (F) Peak jGCaMP7f transients in the dark and after green light pulses in a single experiment, indicating a light-dependent decrease in presynaptic Ca2+ influx. Dashed lines show the average for the two conditions. (G) Quantification of normalized eOPN3-jGCaMP7f transients (left) (SCH 23390 + light = 0.72 ± 0.026, p = 2.10_3, Wilcoxon-test, n = 10 slices) and jGCaMP7f alone (right) (SCH 23390 + light = 1.04 ± 0.06, p = 0.89, paired t test, n = 10 slices). Plots show individual data points (lines), and average (circles) ± SEM.
Figure 6
Figure 6. eOPN3 mediated suppression of thalamocortical inputs in awake head-fixed mice
(A) Schematic diagram of the investigated circuit. Lateral geniculate nucleus (LGN) neurons were bilaterally transduced with eOPN3. Acute silicon probe recordings were performed bilaterally in primary visual cortex (V1) before and after unilateral illumination of LGN terminals in V1. (B) During recordings, head-fixed mice were presented with a compound drifting grating stimulus (4 s duration) every 30 s for 21 trials (top). Ten baseline trials were followed by a single trial paired with 30 s of light delivery (525 nm at ~2 mW from a 200 mm, 0.5 NA optical fiber) to V1, and 20 post-light trials. (C) Raster plot of a representative V1 unit with reduced firing rate induced by eOPN3 activation. (D) Heat plot of the population response to visual stimulus presentation of all recorded units (189 units from 3 mice) on the hemisphere of eOPN3 activation before (left) and after (right) eOPN3 activation. Units were sorted by their response magnitude to visual stimulus presentation during baseline condition. Units below the dashed line (n = 54) show a positive average response during the 4 s visual stimulus presentation. (E) Left: Average peristimulus time histogram of the visual stimulus responsive units (below dashed line in D). Each unit’s activity was normalized to the average firing rate in the 15 s prior to stimulus presentation during the two trials before eOPN3 activation. Right: Quantification of the average response during 4 s visual stimulus presentation in the two trials before (Dark) and first two trials after eOPN3 activation onset (Light). Dark: 1.17 ± 0.23, Light: 0.25 ± 0.22, p < 1 o 10_3, Wilcoxon test, n = 54 units. Plot shows individual units (lines), and population average (circles) ± SEM. (F) Kinetics of the recovery of visual stimulus response amplitude for units that showed a reduction >50% in their visual stimulus response (magenta), fitted with a mono-exponential function (black line). Units recorded simultaneously from the contralateral hemisphere (gray) did not change their response following ipsilateral eOPN3 activation. During the baseline and post light period, the plot shows the averages of two consecutive trials (circles) ± SEM.
Figure 7
Figure 7. eOPN3-mediated suppression of dopaminergic projections from the substantia nigra to the dorsomedial striatum leads to ipsiversive bias during free locomotion
(A) Schematic diagram of the experimental setup and hypothesis. Unilateral expression of eOPN3 in SNc dopaminergic neurons and light-mediated suppression of their striatal projections would induce an ipsiversive side bias during free locomotion. (B) Top: experimental timeline. Bottom: Representative images of neurons expressing eOPN3-mScarlet in the SNc (left) and their striatal projections (right) in DAPI-stained brain sections. Scale bars, 500 mm. (C) Locomotion trajectories of representative eOPN3 (top) and eYFP (bottom) mice, over successive 10-min periods: (left to right) before, during and after light delivery (540 nm, 500 ms pulses at 0.1 Hz, 10 mW from the fiber tip), together covering continuous 30 min sessions. Red and black color code trajectory segments where the mice showed ipsilateral or contralateral angle gain, respectively. (D) Representative cumulative angle traces of individual eOPN3-expressing (top) and eYFP-expressing (bottom) mice, over 30 min of free locomotion in an open field arena. Red and black colors depict ipsilateral or contralateral segments, respectively. Green shaded region marks the light delivery period. (E) The rotation index (mean ± SEM), calculated as the difference between cumulative ipsilateral and contralateral rotations, divided by their sum, over 1-min bins for eOPN3-expressing mice (magenta, n = 7) and eYFP controls (gray, n = 8). Green shaded region marks the light delivery period, where eOPN3 demonstrate significant ipsiversive bias (p = 1.3·10 3 Kruskal-Wallis test followed by Bonferroni-Holm corrected pairwise comparisons using Wilcoxon rank sum tests. Baseline: ctrl versus eOPN3 p = 1; light: ctrl versus eOPN3 p = 1.9·10 3; post light: ctrl versus eOPN3 p = 0.09). (F) Top: rotation index, calculated for individual mice before (left), during (middle), and after (right) light-induced activation of eOPN3, plotted against eOPN3 expression levels measured at the DMS projections (symbols). Solid and dashed lines are linear regression fit with 95% confidence intervals, respectively. Bottom: average velocity of individual mice, plotted against expression levels in the same manner shown above. R2 values are indicated separately for each plot.

Comment in

References

    1. Alcaro A, Huber R, Panksepp J. Behavioral functions of the mesolimbic dopaminergic system: an affective neuroethological perspective. Brain Res Brain Res Rev. 2007;56:283–321. - PMC - PubMed
    1. Armbruster BN, Li X, Pausch MH, Herlitze S, Roth BL. Evolving the lock to fit the key to create a family of G protein-coupled receptors potently activated by an inert ligand. Proc Natl Acad Sci USA. 2007;704:5163–5168. - PMC - PubMed
    1. Bailes HJ, Zhuang L-Y, Lucas RJ. Reproducible and sustained regulation of Gas signalling using a metazoan opsin as an optogenetic tool. PLoS ONE. 2012;7:e30774. - PMC - PubMed
    1. Ballister ER, Rodgers J, Martial F, Lucas RJ. A live cell assay of GPCR coupling allows identification of optogenetic tools for controlling Go and Gi signaling. BMC Biol. 2018;76:10. - PMC - PubMed
    1. Barter JW, Li S, Lu D, Bartholomew RA, Rossi MA, Shoemaker CT, >Salas-Meza D, Gaidis E, Yin HH. Beyond reward prediction errors: the role of dopamine in movement kinematics. Front Integr Nuerosci. 2015;9:39. - PMC - PubMed

Publication types

MeSH terms

LinkOut - more resources